Observational Study
. 2024 Feb 2;26(2):279-294.
doi: 10.1093/neuonc/noad198.

Immune signatures of checkpoint inhibitor-induced autoimmunity-A focus on neurotoxicity

Affiliations
Observational Study

Immune signatures of checkpoint inhibitor-induced autoimmunity-A focus on neurotoxicity

Leonie Müller-Jensen et al. Neuro Oncol. .

Abstract

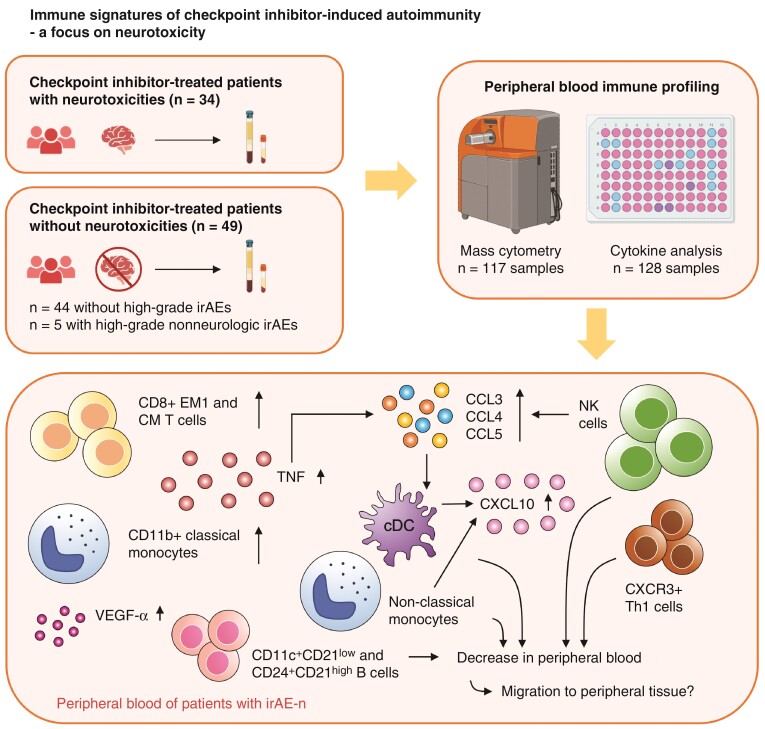
Background: Neurologic immune-related adverse events (irAE-n) are rare but severe toxicities of immune checkpoint inhibitor (ICI) treatment. To overcome diagnostic and therapeutic challenges, a better mechanistic understanding of irAE-n is paramount.

Methods: In this observational cohort study, we collected serum and peripheral blood samples from 34 consecutive cancer patients with irAE-n (during acute illness) and 49 cancer control patients without irAE-n (pre- and on-ICI treatment, n = 44 without high-grade irAEs, n = 5 with high-grade nonneurologic irAEs). Patients received either anti-programmed cell death protein (PD)-1 or anti-PD ligand-1 monotherapy or anti-PD-1/anti-cytotoxic T-lymphocyte-associated protein-4 combination therapy. Most common cancers were melanoma, lung cancer, and hepatocellular carcinoma. Peripheral blood immune profiling was performed using 48-marker single-cell mass cytometry and a multiplex cytokine assay.

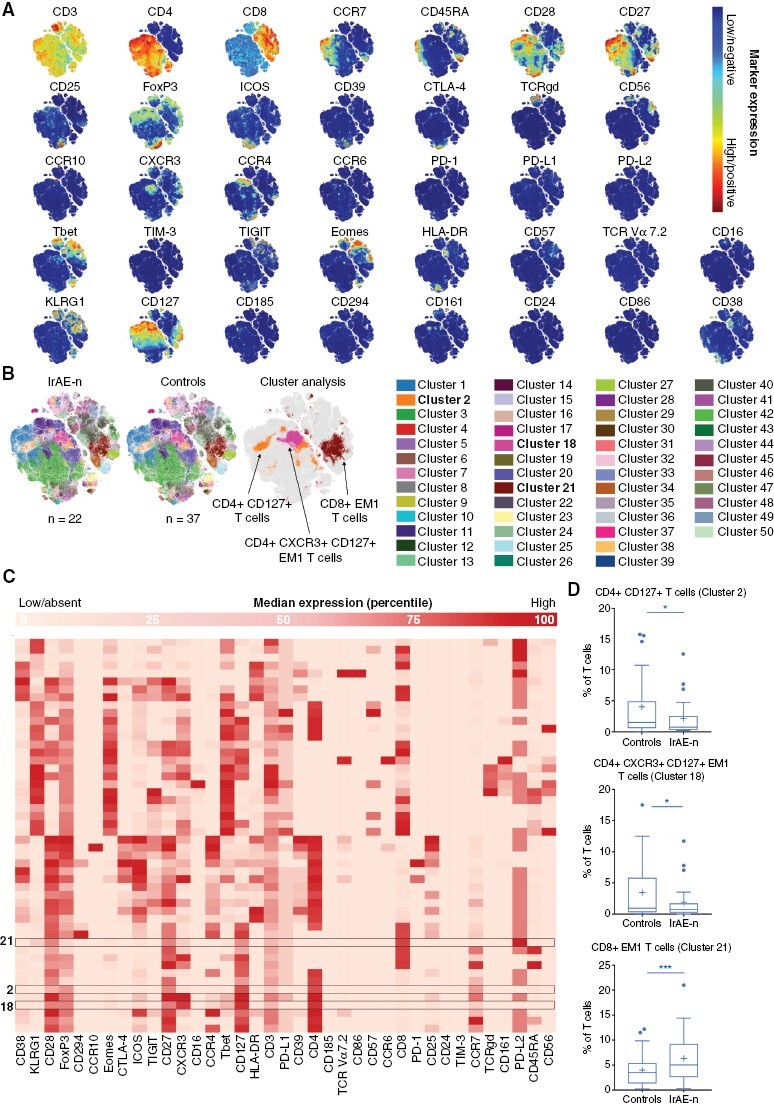
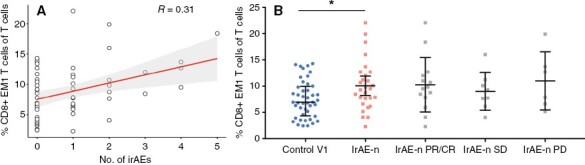
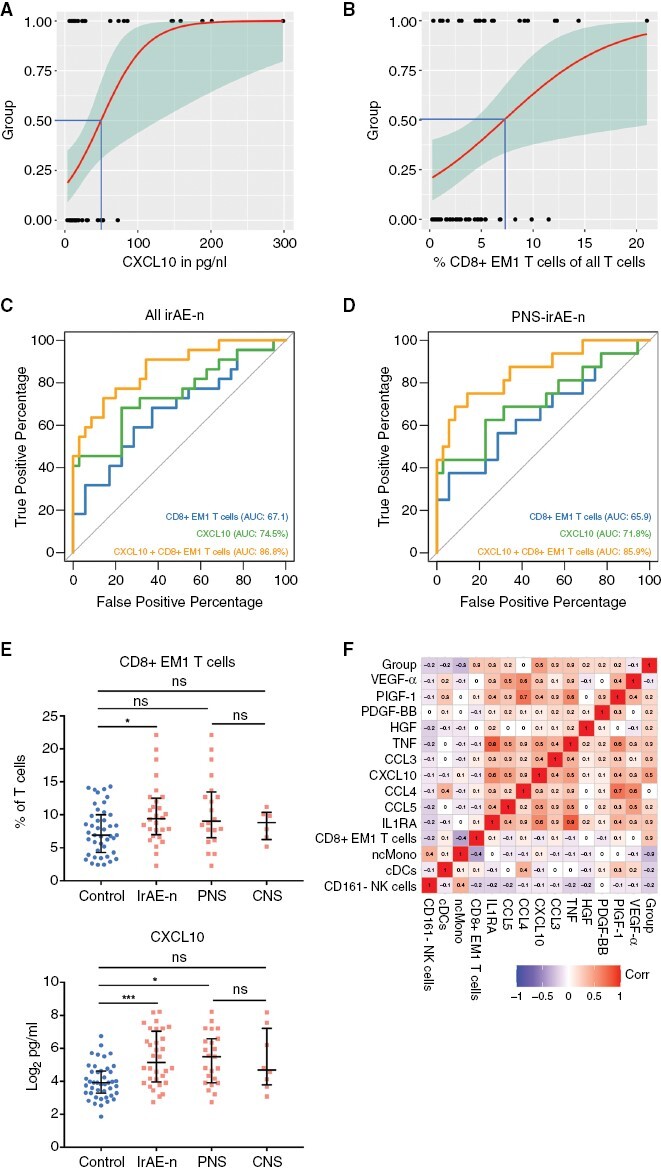
Results: During acute illness, patients with irAE-n presented higher frequencies of cluster of differentiation (CD)8+ effector memory type (EM-)1 and central memory (CM) T cells compared to controls without irAEs. Multiorgan immunotoxicities (neurologic + nonneurologic) were associated with higher CD8+ EM1 T cell counts. While there were no B cell changes in the overall cohort, we detected a marked decrease of IgD- CD11c+ CD21low and IgD- CD24+ CD21high B cells in a subgroup of patients with autoantibody-positive irAE-n. We further identified signatures indicative of enhanced chemotaxis and inflammation in irAE-n patients and discovered C-X-C motif chemokine ligand (CXCL)10 as a promising marker to diagnose high-grade immunotoxicities such as irAE-n.

Conclusions: We demonstrate profound and partly subgroup-specific immune cell dysregulation in irAE-n patients, which may guide future biomarker development and targeted treatment approaches.

Keywords: immune checkpoint inhibitors; immune-related adverse events; immunotherapy; mass cytometry; neurotoxicity.


Conflict of interest statement

L.M.J., R.M., C.U., P.K., N.F., S.F., D.K., C.S., L.G.R., S.K.M., F.T.N., and M.E. have declared that no conflict of interest exists related to the submitted work. A.R.S. and H.E.M. are listed as inventors on patents relating to mass cytometry reagents; H.E.M. receives royalties from Standard BioTools. L.H. declares research support from Therakos; speakers and advisory board honoraria from 4SC, Amgen, BiomeDx, Bristol Myers Squibb, Curevac, Merck, Merck Sharp & Dohme, Myoncare, Novartis, Pierre Fabre, Sanofi, SUN, and Roche. L.H. further holds patents described in publications nos. (1) WO/2001/052874; PCT/EP2001/000363, (2) WO/2003/093419; PCT/US2003/013350, and (3) WO/2019/219705; PCT/EP2019/062378. W.B. and P.H. have received lecture fees from Bristol-Meyers-Squibb (W.B.) and/or NOGGO e.V. (W.B. and P.H.), all unrelated to this work. S.K. has received lecture fees from the Nationale Gesundheits-Akademie GmbH, outside of the submitted work.

Figures

Graphical Abstract
Graphical Abstract
Figure 1.
Figure 1.
Unsupervised mass cytometry analysis of peripheral blood T cell signatures in patients with irAE-n and controls. (A) Overlay t-distributed stochastic neighbor embedding (t-SNE) maps of all patients with irAE-n and controls, each plot represents the expression of the indicated marker. One dot represents one cell. Heat colors show overall expression levels (red, high expression; dark blue, low or no expression). (B) 2D single-cell t-SNE maps with 50 metaclusters in patients with irAE-n and controls. Analysis for differential cluster abundance using significance analysis of microarrays (SAM) reveals differences in 3 metaclusters (cluster 2, cluster 18, cluster 21; printed in bold). (C) Heatmap of 37 different T cell markers illustrates individual expression levels for the 3 differential clusters 2, 18, and 21. Colour intensity shows overall expression levels (dark = high expression, bright = low or no expression). (D) Inspection of marker expression and plotted frequencies demonstrate a decrease of CD4+ CD127+ T cells (cluster 2) and CD4+ CXCR+ CD127+ EM1 T cells (cluster 18) as well as an increase of CD8+ effector memory type 1 (EM1) T cells (cluster 21) in patients with irAE-n compared to controls. Tukey’s box plots depict median (horizontal bar), mean (cross), interquartile range (hinges), and whiskers (fences). Outliers are represented as dots. * = P value ≤ .05, *** = P ≤ .001. CTLA-4, cytotoxic T-lymphocyte-associated protein 4; FoxP3, forkhead-Box-Protein P3; ICOS, inducible T-cell costimulatory; KLRG-1, killer cell lectin-like receptor subfamily G member 1; PD-1, programmed cell death protein 1; PD-L1, programmed death-ligand 1; PD-L2, programmed death-ligand 2; Tbet, T-box expressed in T cells; TIGIT, T cell immunoreceptor with Ig and ITIM domains; TIM-3, T-cell immunoglobulin and mucin-domain containing-3.
Figure 2.
Figure 2.
Association of peripheral blood CD8+ effector memory type 1 (EM1) T cell frequency, number of irAEs, and outcome. (A) Spearman’s rank correlation reveals a positive correlation between the frequency of CD8+ EM1 T cells and the total number of irAEs (neurologic and nonneurologic). (B) Elevation of CD8+ EM1 T cells in patients with irAE-n is not associated with better tumor response. * = P value ≤ .05. CR, complete remission; EM1, effector memory type 1; irAE-n, neurologic immune-related adverse event; no., number; PD, progressive disease; PR, partial remission; SD, stable disease; V1, visit 1 (after ICI treatment initiation).
Figure 3.
Figure 3.
Unsupervised mass cytometry analysis of peripheral blood non-T cell signatures in patients with irAE-n and controls. (A) 2D single-cell t-distributed stochastic neighbor embedding (t-SNE) maps with 30 metaclusters in patients with irAE-n and controls. Cluster analysis using significance analysis of microarrays (SAM) reveals between-group differences in 5 metaclusters (cluster 2, cluster 4, cluster 8, cluster 14, cluster 20; printed in bold). (B) Overlay t-SNE maps of all patients with irAE-n and controls, each plot represents the expression of the indicated marker. One dot represents one cell. Heat colors show overall expression levels (red = high expression; dark blue = low or no expression). (C) Heatmap shows the individual expression of 21 different markers of B cells, NK cells, monocytes, and DCs for the 5 differential metaclusters (cluster 2, cluster 4, cluster 8, cluster 14, cluster 20). Colour intensity shows overall expression levels (dark = high expression, bright = low or no expression). (D) Inspection of marker expression and plotted frequencies demonstrate (1) a decrease of CD11c+ conventional DCs (cDCs; cluster 14), (2) a decrease of CD161+ NK cells (cluster 2) and CD161 NK cells (cluster 8), and (3) a decrease of CD16+ CD14 monocytes (cluster 20) with a concurrent increase of CD14+ CD11b+ monocytes (cluster 4) in patients with irAE-n compared to controls. Tukey’s box plots depict median (horizontal bar), mean (cross), interquartile range (hinges), and whiskers (fences). Outliers are represented as dots. * = P value ≤ .05, *** = P ≤ .001. KLRG1, killer cell lectin-like receptor subfamily G member 1; PD-L1/2, programmed death-ligand 1/2.
Figure 4.
Figure 4.
Serum cytokine signatures in patients with irAE-n and controls. Comparison of serum levels of 45 different cytokines in patients with irAE-n and controls using Mann–Whitney U test reveals significant differences for 10 cytokines. Scatter dot plots depict individual log2 transformed cytokine levels (dots), log2 transformed median cytokine concentration in pg/mL (middle bar), and interquartile range (upper and lower error bar). * = P ≤ .05, ** = P ≤ .01, *** = P ≤ .001; irAE-n, neurologic immune-related adverse events; IL-1RA, interleukin-1 receptor antagonist; ns, not significant; PIGF-1, placental growth factor 1; V0, baseline (before ICI treatment initiation); V1, after ICI therapy initiation.
Figure 5.
Figure 5.
Potential peripheral blood markers of irAE-n. (A, B) In a logistic regression model, a probability of more than .5 for the diagnosis of irAE-n was predicted at (A) CXCL10 levels >49.5 pg/mL and (B) CD8+ EM1 T cell frequencies of >7.2%. Blue area filling indicates 95% confidence intervals. (C) ROC analysis of CD8+ EM1 T cell frequency, CXCL10 levels, and a combination of both parameters revealed an area under the curve (AUC) of 67.1%, 74.5%, and 86.8%, respectively, when all patients with irAE-n were included. (D) When only patients with irAE-n of the PNS were included, ROC analysis revealed an AUC of 65.9%, 71.8%, and 85.9% for CD8+ EM1 T cell frequency, CXCL10 concentration, and the combination of both parameters, respectively. (E) CD8+ EM1 T cell frequency and serum concentration of CXCL10 are comparable between patients with PNS-irAE-n and patients with CNS-irAE-n. (F) Correlation matrix of peripheral blood immune markers shows a low correlation between CD8+ EM1 T cell frequency and CXCL10 levels. cDCs, conventional dendritic cells; CNS, central nervous system; EM1, effector memory type 1; IL-1RA, interleukin 1 receptor antagonist; ncMono, nonconventional monocytes; PIGF-1, placental growth factor 1; PNS, peripheral nervous system.

References

    1. Haslam A, Gill J, Prasad V.. Estimation of the percentage of US patients with cancer who are eligible for immune checkpoint inhibitor drugs. JAMA Netw open. 2020;3(3):e200423. - PMC - PubMed
    1. Postow MA, Sidlow R, Hellmann MD.. Immune-related adverse events associated with immune checkpoint blockade. N Engl J Med. 2018;378(2):158–168. - PubMed
    1. Marini A, Bernardini A, Gigli GL, et al. . Neurologic adverse events of immune checkpoint inhibitors: a systematic review. Neurology. 2021;96(16):754–766. - PubMed
    1. Mikami T, Liaw B, Asada M, et al. . Neuroimmunological adverse events associated with immune checkpoint inhibitor: a retrospective, pharmacovigilance study using FAERS database. J Neurooncol. 2021;152(1):135–144. - PubMed
    1. Moehn N, Mahjoub S, Gutzmer R, et al. . Diagnosis and differential diagnosis of neurologic adverse events during immune checkpoint inhibitor therapy. J Oncol. 2020;7:8865054. - PMC - PubMed

Publication types