Randomized Controlled Trial
. 2023 Dec;22(12):e13963.
doi: 10.1111/acel.13963. Epub 2023 Oct 12.

Calorie restriction modulates the transcription of genes related to stress response and longevity in human muscle: The CALERIE study

Affiliations
Randomized Controlled Trial

Calorie restriction modulates the transcription of genes related to stress response and longevity in human muscle: The CALERIE study

Jayanta Kumar Das et al. Aging Cell. 2023 Dec.

Abstract

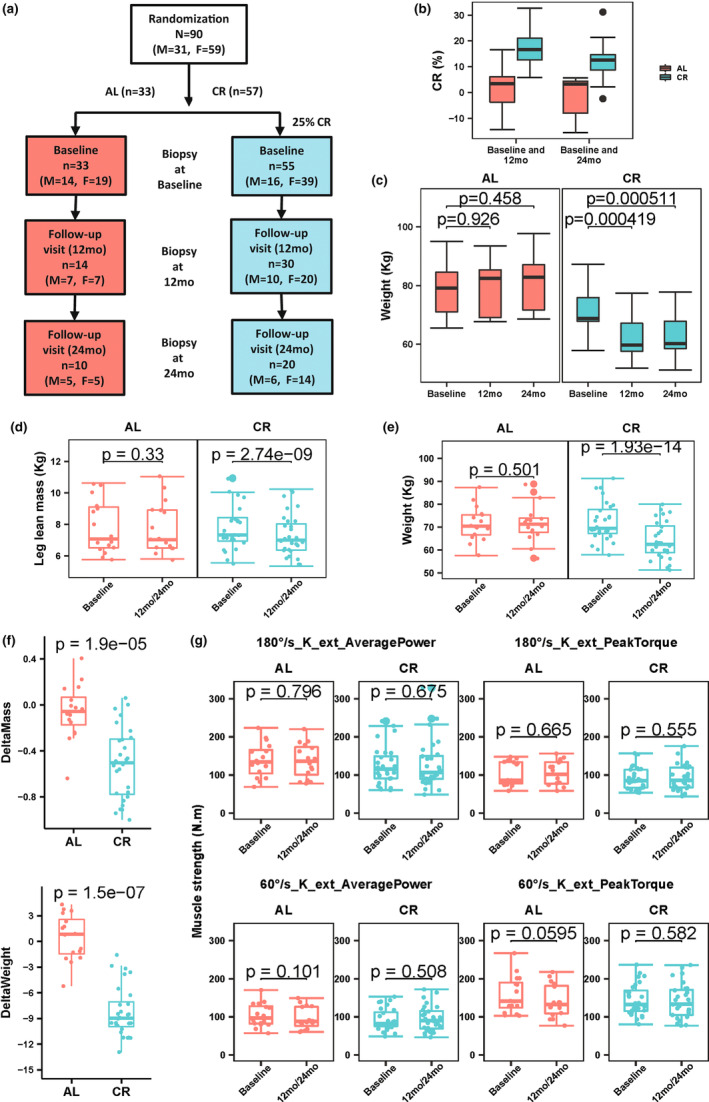
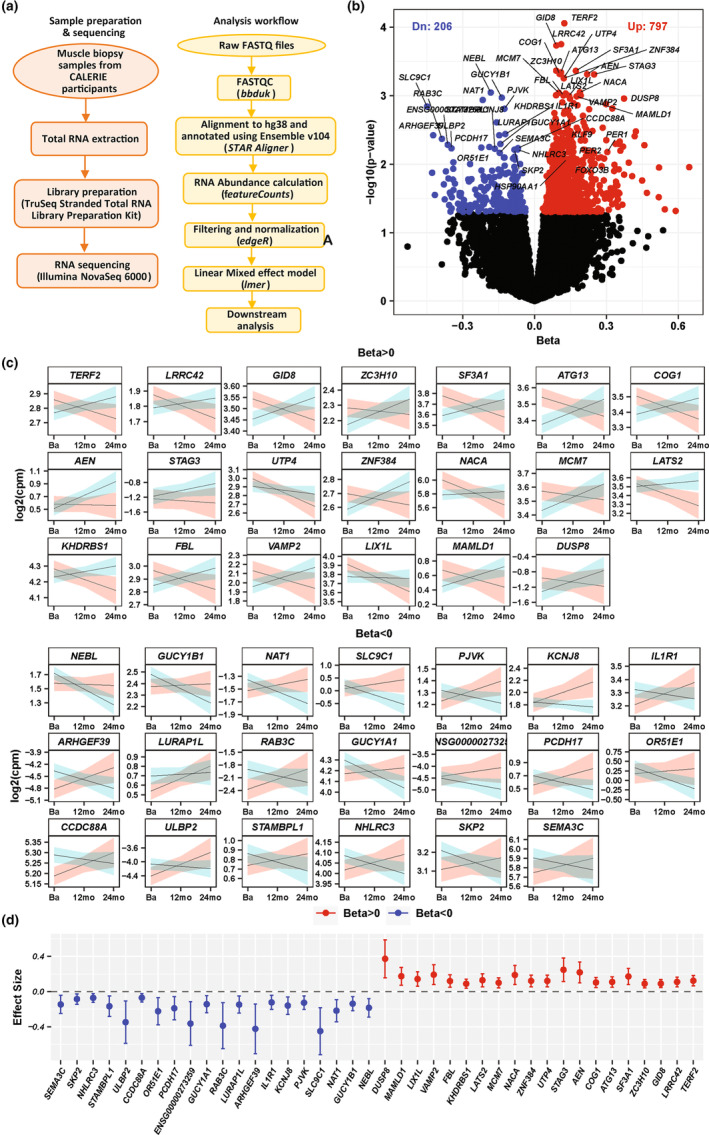
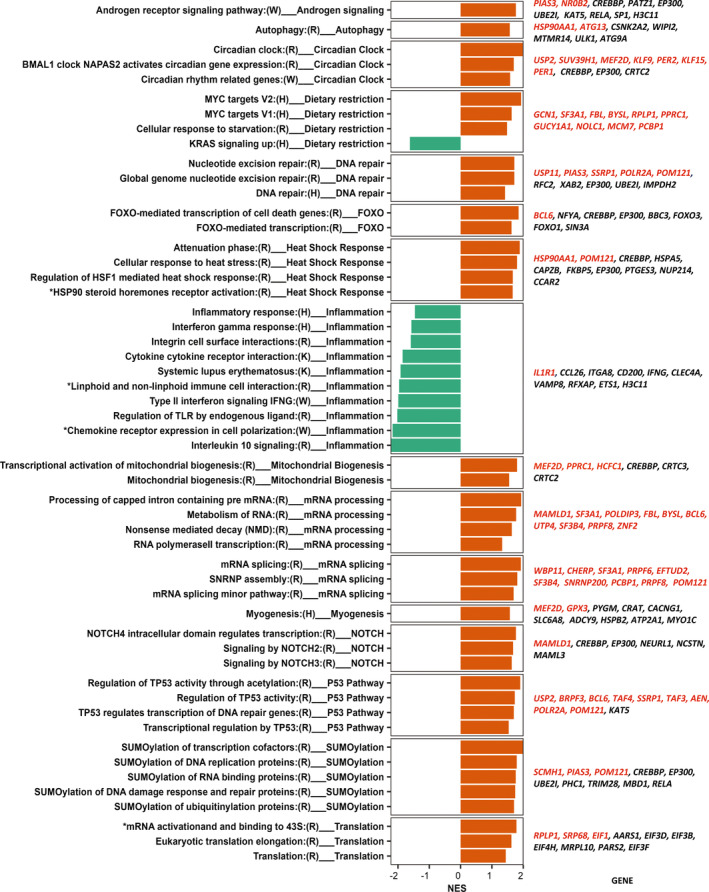
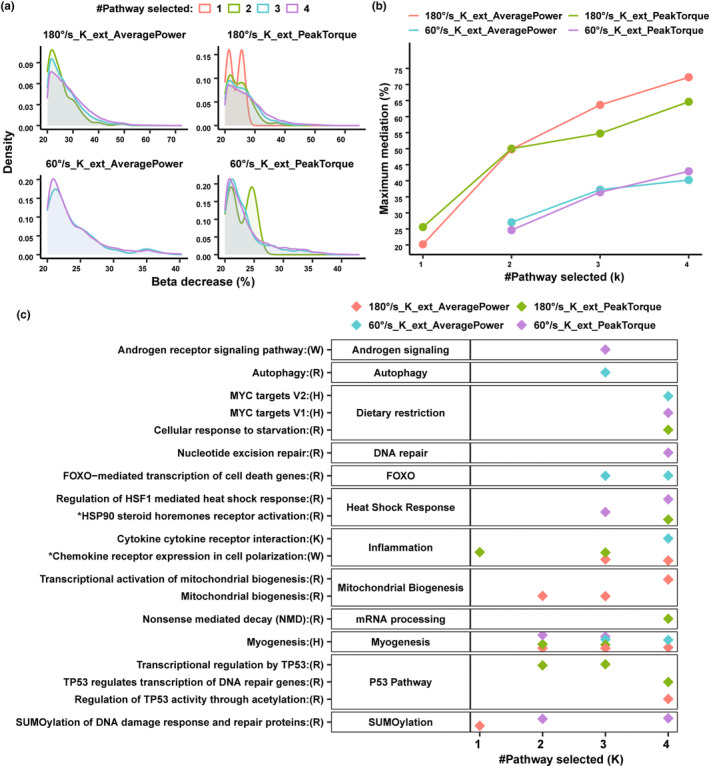
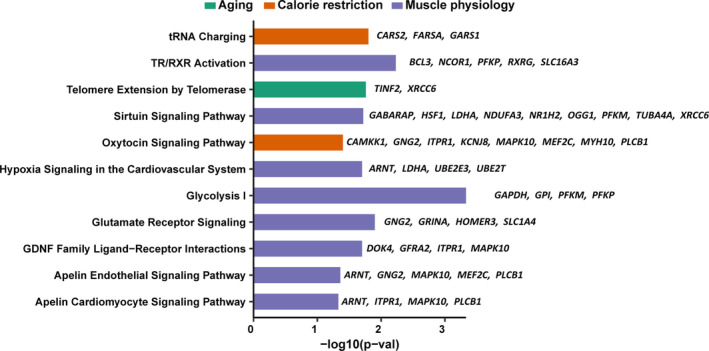
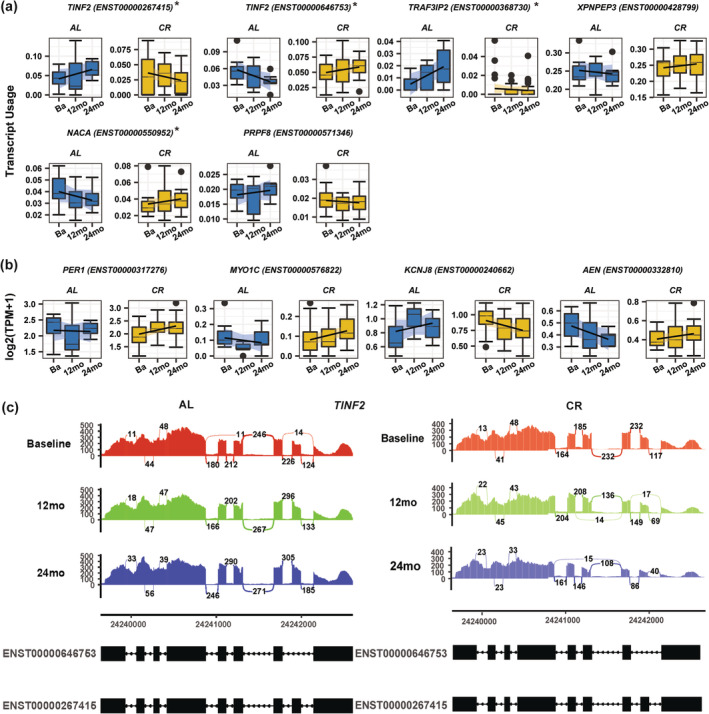
The lifespan extension induced by 40% caloric restriction (CR) in rodents is accompanied by postponement of disease, preservation of function, and increased stress resistance. Whether CR elicits the same physiological and molecular responses in humans remains mostly unexplored. In the CALERIE study, 12% CR for 2 years in healthy humans induced minor losses of muscle mass (leg lean mass) without changes of muscle strength, but mechanisms for muscle quality preservation remained unclear. We performed high-depth RNA-Seq (387-618 million paired reads) on human vastus lateralis muscle biopsies collected from the CALERIE participants at baseline, 12- and 24-month follow-up from the 90 CALERIE participants randomized to CR and "ad libitum" control. Using linear mixed effect model, we identified protein-coding genes and splicing variants whose expression was significantly changed in the CR group compared to controls, including genes related to proteostasis, circadian rhythm regulation, DNA repair, mitochondrial biogenesis, mRNA processing/splicing, FOXO3 metabolism, apoptosis, and inflammation. Changes in some of these biological pathways mediated part of the positive effect of CR on muscle quality. Differentially expressed splicing variants were associated with change in pathways shown to be affected by CR in model organisms. Two years of sustained CR in humans positively affected skeletal muscle quality, and impacted gene expression and splicing profiles of biological pathways affected by CR in model organisms, suggesting that attainable levels of CR in a lifestyle intervention can benefit muscle health in humans.

Keywords: FOXO; calorie restriction; heat shock response; inflammation; mitochondrial biogenesis; skeletal muscle; splicing.


Conflict of interest statement

None declared.

Figures

FIGURE 1
FIGURE 1
Flowchart for CALERIE participants who underwent muscle biopsies and percentage change of calorie intake and change of muscle mass, weight, and muscle strength in CR and AL. (a) The flow‐chart shows the 90 CALERIE participants randomly assigned to a CR and AL who underwent at least one muscle biopsy (baseline, 12‐month [12 mo], 24‐month [24 mo]). Of note, two individuals in the CR group underwent a muscle biopsy starting at the 12‐month follow‐up only. (b) Box plot showing percentage calorie intake reduction between baseline and 12‐month (n = 24 for CR group, n = 13 for AL group) as well as baseline and 24‐month (n = 17 for CR group, n = 7 for AL group) in CALERIE participants. (c) Boxplot showing weight at baseline (Ba), 12‐month follow‐up, and 24‐month follow‐up. Data presented are for participants who participated in muscle biopsy program at baseline and both follow‐up visit (n = 19 for CR group and n = 7 for AL group). Change of muscle mass (leg lean mass) (d) and weight (e) between baseline and 12‐month/24‐month for participants with muscle biopsy samples at baseline and at least one follow‐up visits at 12‐ or 24‐month (n = 27 for CR group and n = 15 for AL group). Analysis showed significant changes of muscle mass and weight in the CR group only (paired t‐test). (f) Changes of muscle mass and weight were significantly different between CR ad AL (unpaired, Wilcoxon test). (g) Comparison of muscle strength variables for knee extension (absolute average power and peak torque) in isokinetic dynamometry at 60 and 180°s−1 between baseline and 12‐month/24‐month (paired t‐test). There was no significant change in strength either in the CR and AL group.
FIGURE 2
FIGURE 2
Overview of analysis workflow and quantification of differentially expressed protein‐coding RNAs produced by linear mixed‐effects modeling (LMM) with linear time dependency. (a) A flow‐chart diagram depicting sample preparation and analysis workflow. (b) A Volcano plots depicting results of differential changes of gene expression between CR and AL using LMM and linear time. Red dot (positive beta: β+) represents genes whose differential expression is significantly increase in CR compared to AL over time; blue dot (for negative beta: β−) represents genes whose expression is significantly decreased in CR compared to AL over time. Some of the genes in each group (β+ and β−) were labeled. (c) Linear smooth trajectory (unadjusted) drawn with 95% confidence interval for the 20 top differentially expressed genes that became significantly overexpressed (left) and underexpressed genes (right) with time in CR compared to AL; in differentially trajectories, light blue colors are for CR and light red color are for AL; x‐axis represents three timepoints: baseline (Ba), 12‐month (12 mo), and 24‐month(24 mo), and y‐axis represents RNA expression (log2(CPM)). (d) Forest plot of top 40 transcripts showing range of beta coefficient (β) (20 with β+ and 20 with β−) and standard errors.
FIGURE 3
FIGURE 3
Selected significantly enriched pathways (p‐adj <0.05) obtained by ranked based gene set enrichment analysis. Genes were ranked by p‐value for the effect of CR compared to AL on differential expression change over time. The left column shows enriched pathways from four databases (H: Hallmark, R: Reactome, K: KEGG, and W: WikiPathways) followed by functional pathways domain. The middle column shows normalized enrichment score (NES) for each pathway (red upregulated pathways in CR and green downregulated pathways in CR). The last column reports up to 10 top significant genes (based on p‐value) in each domain, with red font indicating p < 0.01 and black font indicating 0.01 < p < 0.5. Star (*) symbol indicate that short name of the pathway was used for illustration purpose, full name can be seen in Table S4.
FIGURE 4
FIGURE 4
Pathways enriched for genes that differentially change expression over the follow‐up in CR compared to controls mediate the preservation of muscle quality. (a) Regression models analysis showing percent mediation (x‐axis, change in the beta coefficient for CR compared to AL) in models predicting changes in muscle quality. Only results for combination of pathways with mediation of 20% or more are shown from all combination of models with 1, 2, 3, and 4 pathways scores included, separately for each of the strength variables (colored). (b) A line with dot plot showing maximum percent mediation (%) as observed for specific number of pathways set selection k (1–4) in for regression model analyses. (c) Dot point represent specific set of pathways (for different k) that yield highest mediation considering pathway set from different pathways category for each of the strength variables. Star (*) symbol indicate that short name of the pathway was used for illustration purpose, full name can be seen in Table S4.
FIGURE 5
FIGURE 5
Significant selected pathways (p < 0.05) obtained through ingenuity pathway analysis (IPA) utilizing 328 genes for which at least one splicing variant was found to change significantly in CR compared to AL by differentially transcript expression and/or differentially transcript usage analysis. The left panel of the plot showing name of the significant pathways which were colored according to functional biological category (Aging, Calorie restriction and Muscle physiology). A list of leading genes in the right panel of each pathway (bar plot) were reported and supported mRNA splicing variants for each gene can be seen in Table S10.
FIGURE 6
FIGURE 6
Differentially transcript expression change and/or differentially transcript usage changes of twelve mRNA splicing variants over time between CR and AL. Examples of splicing variants identified as showing significant differential expression changes/usage at p < 0.01 between CR and AL over time (baseline (Ba), 12‐month [12 mo], and 24‐month [24 mo]) in both Kallisto and RSEM analyses. Figure showed differentially expressed change supported transcripts in (a) and differentially usage change supported transcripts in (b) for completer group. Star (*) symbol in differentially usage supported transcripts was also supported in differentially expression analysis. Both differentially transcript expression (in log2(TPM + 1)) and differentially transcript usage (normalized by log2(TPM + 1) per RNA in 0–1 scale) changes were shown for Kallisto quantification approach and. (c) Sashimi plot (shown for one sample) representing junction count for two alternate splice variants of TINF2 separately for AL and CR group. Important junction is where the exon‐skipping event is occurring. For CR group, junction count value decreases over time at 12 and 24 months compared to baseline whereas as for AL group, value almost unchanged or little increasing in 12 and 24 months compared to baseline.

References

    1. Acosta‐Rodríguez, V. , Rijo‐Ferreira, F. , Izumo, M. , Xu, P. , Wight‐Carter, M. , Green, C. B. , & Takahashi, J. S. (2022). Circadian alignment of early onset caloric restriction promotes longevity in male C57BL/6J mice. Science, 376(6598), 1192–1202. - PMC - PubMed
    1. Altieri, P. , Spallarossa, P. , Barisione, C. , Garibaldi, S. , Garuti, A. , Fabbi, P. , Ghigliotti, G. , & Brunelli, C. (2012). Inhibition of doxorubicin‐induced senescence by PPARδ activation agonists in cardiac muscle cells: Cooperation between PPARδ and Bcl6. PLoS One, 7(9), e46126. - PMC - PubMed
    1. Anderson, R. M. , Le Couteur, D. G. , & de Cabo, R. (2018). Caloric restriction research: New perspectives on the biology of aging. The Journals of Gerontology: Series A, 73(1), 1–3. - PMC - PubMed
    1. Ando, K. , Tong, L. , Peng, D. , Vázquez‐Liébanas, E. , Chiyoda, H. , He, L. , Liu, J. , Kawakami, K. , Mochizuki, N. , Fukuhara, S. , Grutzendler, J. , & Betsholtz, C. (2022). KCNJ8/ABCC9‐containing K‐ATP channel modulates brain vascular smooth muscle development and neurovascular coupling. Developmental Cell, 57(11), 1383–1399. e1387. - PubMed
    1. Astafev, A. A. , Patel, S. A. , & Kondratov, R. V. (2017). Calorie restriction effects on circadian rhythms in gene expression are sex dependent. Scientific Reports, 7(1), 1–9. - PMC - PubMed

Publication types