. 2023 Oct 12:12:RP88084.
doi: 10.7554/eLife.88084.

Structural rather than catalytic role for mitochondrial respiratory chain supercomplexes

Affiliations

Structural rather than catalytic role for mitochondrial respiratory chain supercomplexes

Michele Brischigliaro et al. Elife. .

Abstract

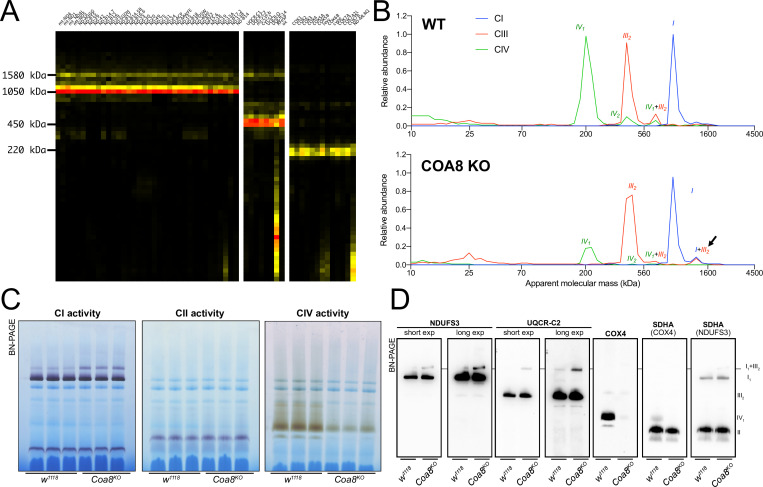
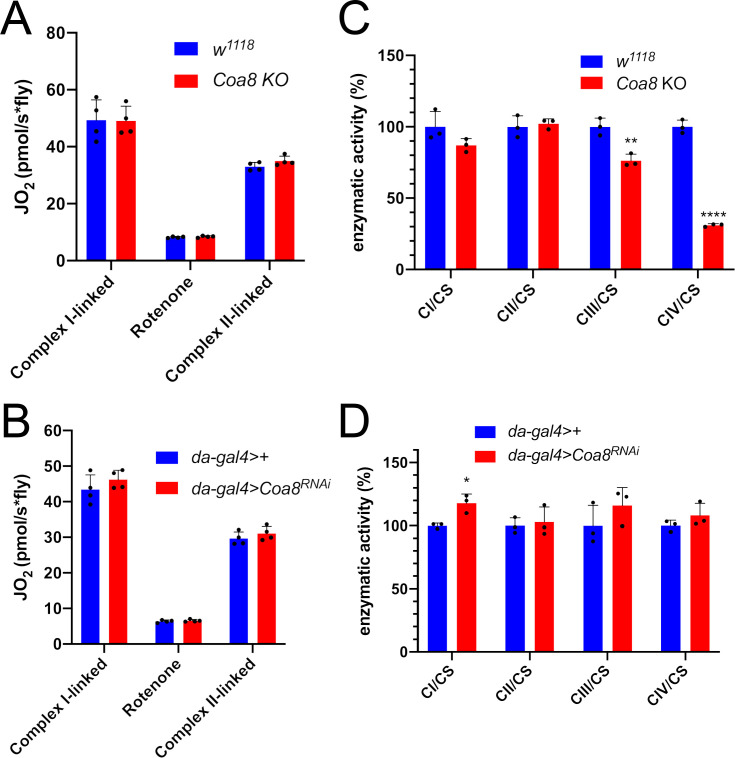
Mammalian mitochondrial respiratory chain (MRC) complexes are able to associate into quaternary structures named supercomplexes (SCs), which normally coexist with non-bound individual complexes. The functional significance of SCs has not been fully clarified and the debate has been centered on whether or not they confer catalytic advantages compared with the non-bound individual complexes. Mitochondrial respiratory chain organization does not seem to be conserved in all organisms. In fact, and differently from mammalian species, mitochondria from Drosophila melanogaster tissues are characterized by low amounts of SCs, despite the high metabolic demands and MRC activity shown by these mitochondria. Here, we show that attenuating the biogenesis of individual respiratory chain complexes was accompanied by increased formation of stable SCs, which are missing in Drosophila melanogaster in physiological conditions. This phenomenon was not accompanied by an increase in mitochondrial respiratory activity. Therefore, we conclude that SC formation is necessary to stabilize the complexes in suboptimal biogenesis conditions, but not for the enhancement of respiratory chain catalysis.

Keywords: D. melanogaster; Drosophila; Mitochondria; OXPHOS; biochemistry; chemical biology; supercomplexes.


Conflict of interest statement

MB, AC, SA, CV, MZ, EF No competing interests declared

Figures

Figure 1.
Figure 1.. D. melanogaster mitochondrial respiratory chain does not rely on SC formation under physiological conditions.
(A) Complexome profiling of wild-type D. melanogaster mitochondria. Heatmaps show relative abundance of MRC subunits belonging to complex I (CI), complex II (CII), complex III2 (CIII), and complex IV (CIV). Color scale of normalized peptide intensities are 0 (black), 96th percentile (yellow) and 1 (red). (B) BN-PAGE separation of mitochondria from wild-type D. melanogaster solubilized with digitonin. Native gels were either stained with Coomassie R250 or analyzed by in-gel activity (IGA) for complex I (CI) and complex IV (CIV). (C) BN-PAGE separation of mitochondria from wild-type D. melanogaster solubilized with dodecylmaltoside (DDM). Native gels were either stained with Coomassie R250 or analyzed by in-gel activity assay (IGA) for complex I (CI) and complex IV (CIV).
Figure 2.
Figure 2.. Severely perturbed CIV assembly results in increased formation of SC I1III2.
(A) Complexome profiling of Coa8 KO D. melanogaster mitochondria. Heatmaps show relative abundance of MRC subunits belonging to complex I (CI), complex II (CII), complex III2 (CIII) and complex IV (CIV). Color scale of normalized peptide intensities are 0 (black), 96° percentile (yellow) and 1 (red). (B) Average MS profiles depicted as relative abundance of MRC enzymes in natively separated complexes from wild-type (top) and Coa8 KO (bottom) fly mitochondria. Profiles of complexes I, III2 and V (CI, CIII and CV) are plotted as average peptide intensity of the specific subunits identified by MS for each complex vs. apparent molecular weight. The increase in the relative abundance of SC I1III2 in Coa8 KO mitochondria is indicated by a black arrow. (C) In gel-activity assays for MRC complex I (CI), complex II (CII), and complex IV (CIV) in DDM-solubilized mitochondria from wild-type (w1118) and Coa8 KO (Coa8KO) flies. (D) BN-PAGE, western blot immunodetection of MRC complexes from a pool of three control wild-type (w1118) and three Coa8 KO (Coa8KO) fly mitochondria preparations, using antibodies against specific subunits: anti-UQCRC2 (complex III), anti-NDUFS3 (complex I), anti-COX4 (complex IV), and anti-SDHA (complex II).
Figure 2—figure supplement 1.
Figure 2—figure supplement 1.. Quantification of complex and supercomplex bands in Coa8KO fly mitochondria.
(A) The signal intensity of the bands from CI- and CII-in gel activity assays (IGA) in mitochondria from the Coa8KO strain, and its corresponding control, were quantified using the Gel analyzer 19.1 software. The graphs show the relative signal intensity of each CI-reactive band normalized to the intensity of the CII-reactive band from the same sample (n=3 biological replicates for each genotype, pairwise comparisons by unpaired Student’s t test ****p ≤ 0.0001). The total relative intensity of all the CI-containing bands in the control samples was set to 1. Green bars = data corresponding to free complex I; red bars and stars = data corresponding to supercomplex containing CI and CIII2. (B) Western blot signal intensity profiles obtained with Fiji (ImageJ) applying the same ROI (region of interest) in the BNGE lanes of Coa8KO in comparison with the corresponding control. Relative intensity (R.I.) of the bands along the lane length (in inches) was plotted. High molecular weights are on the left and low molecular weights are on the right.
Figure 3.
Figure 3.. Mildly perturbed CIV assembly results in increased formation of SC I1III2.
(A) Relative quantification (RQ) of Coa8 mRNA expression in control (da-gal4>+) and Coa8 KD (da-gal4 >Coa8 RNAi) flies measured by qPCR. Data are plotted as mean  ± SD (n = 3 biological replicates, Student’s t test *p ≤ 0.05). (B) In gel-activity assays for MRC complex I (CI), complex II (CII) and complex IV (CIV) in DDM-solubilized mitochondria from control (da-gal4>+) and Coa8 KD (da-gal4 >Coa8 RNAi) flies. (C) BN-PAGE, western blot immunodetection of MRC complexes from a pool of three control (da-gal4>+) and three Coa8 KD (da-gal4 >Coa8 RNAi) fly mitochondria samples, using antibodies against specific subunits: anti-UQCRC2 (complex III), anti-NDUFS3 (complex I), anti-COX4 (complex IV), and anti-SDHA (complex II).
Figure 3—figure supplement 1.
Figure 3—figure supplement 1.. Quantification of complex and supercomplex bands in Coa8 KD fly mitochondria.
(A) The signal intensity of the bands from CI- and CII-in gel activity assays (IGA) in mitochondria from the mild Coa8RNAi strain, and its corresponding control, were quantified using the Gel analyzer 19.1 software. The graphs show the relative signal intensity of each CI-reactive band normalized to the intensity of the CII-reactive band from the same sample (n=3 biological replicates for each genotype, pairwise comparisons by unpaired Student’s t test ***P ≤ 0.001). The total relative intensity of all the CI-containing bands in the control samples was set to 1. Green bars = data corresponding to free complex I; red bars and stars = data corresponding to supercomplex containing CI and CIII2. (B) Western Blot signal intensity profiles obtained with Fiji (ImageJ) applying the same ROI (region of interest) in the BNGE lanes of Coa8RNAi in comparison with the corresponding control. Relative intensity (R.I.) of the bands along the lane length (in inches) was plotted. High molecular weights are on the left and low molecular weights are on the right.
Figure 4.
Figure 4.. Enhanced formation of SC I1III2 does not result in increased respiration.
(A–B) High-resolution respirometry (HRR) analyses of whole-fly homogenates. Respiration is represented by oxygen flux (JO2) measured by oxygen consumption rates (OCR – pmol/s*fly). OCR have been measured via substrate-driven respiration under saturating concentrations of substrates inducing either complex I (CI) or complex II (CII) -linked respiration. Rotenone was used to block CI-linked respiration before measuring CII-linked respiration. HRR was performed on (A) Coa8 KO and (B) Coa8 KD fly homogenates compared to relative controls. Data are plotted as mean  ± SD (n = 4 biological replicates). (C–D) Kinetic enzyme activity of individual MRC complexes in (C) Coa8 KO and (D) Coa8 KD compared with the relative control individuals, normalized by citrate synthase (CS) activity. Data are plotted as mean  ± SD (n = 3 biological replicates, pairwise comparisons by unpaired Student’s t test *p ≤ 0.05, **p ≤ 0.01, ****p ≤ 0.0001).
Figure 5.
Figure 5.. Mild perturbation of CIII2 biogenesis enhances SC formation in D. melanogaster.
(A) Relative quantification (RQ) of Bcs1 mRNA expression in control (act5c-gal4>+) and Bcs1 KD (act5c-gal4>Bcs1 RNAi) larvae measured by qPCR. Data are plotted as mean  ± SD (n = 3 biological replicates, Student’s t test ***p ≤ 0.001). (B) In gel-activity assays for MRC complex I (CI), complex II (CII) and complex IV (CIV) in DDM-solubilized mitochondria from control (act5c-gal4>+) and Bcs1 KD (act5c-gal4>Bcs1 RNAi) larvae. (C) BN-PAGE, western blot immunodetection of MRC complexes from a pool of three control (act5c-gal4>+) and three Bcs1 KD (act5c-gal4>Bcs1 RNAi) larvae mitochondria samples, using antibodies against specific subunits: anti-UQCRC2 (complex III), anti-NDUFS3 (complex I), anti-COX4 (complex IV) and anti-SDHA (complex II). (D) Kinetic enzyme activity of individual MRC complexes in control (act5c-gal4>+) and Bcs1 KD (act5c-gal4>Bcs1 RNAi) larvae mitochondria normalized by citrate synthase (CS) activity. Data are plotted as mean  ± SD (n = 3 biological replicates, pairwise comparisons by unpaired Student’s t test, *p ≤ 0.05, ****p ≤ 0.0001). (E) High-resolution respirometry (HRR) analyses of whole-fly homogenates. Respiration is represented by oxygen flux (JO2) measured by oxygen consumption rates (OCR – pmol/s*fly). OCR have been measured via substrate-driven respiration under saturating concentrations of substrates inducing either complex I (CI) or complex II (CII) -linked respiration. Rotenone was used to block CI-linked respiration before measuring CII-linked respiration. HRR was performed on control (act5c-gal4>+) and Bcs1 KD (act5c-gal4>Bcs1 RNAi) homogenates compared to relative controls. Data are plotted as mean  ± SD (n = 3 biological replicates, two-way ANOVA with Sidak’s multiple comparisons, ****p ≤ 0.0001). (F) Relative quantification (RQ) of Bcs1 mRNA expression in control (da-gal4>+) and Bcs1 KD (da-gal4 >Bcs1 RNAi) larvae measured by qPCR. Data are plotted as mean  ± SD (n = 3 biological replicates, Student’s t test ***p ≤ 0.001). (G) In gel-activity assays for MRC complex I (CI), complex II (CII) and complex IV (CIV) in DDM-solubilized mitochondria from control (da-gal4>+) and Bcs1 KD (da-gal4 >Bcs1 RNAi) larvae. (H) BN-PAGE, western blot immunodetection of MRC complexes from a pool of three control (da-gal4>+) and three Bcs1 KD (da-gal4 >Bcs1 RNAi) larvae mitochondria samples using antibodies against specific subunits: anti-UQCRC2 (complex III), anti-NDUFS3 (complex I), anti-COX4 (complex IV), and anti-SDHA (complex II). HWM-SC: high molecular weight supercomplex. (I) Kinetic enzyme activity of individual MRC complexes in control (da-gal4>+) and Bcs1 KD (da-gal4 >Bcs1 RNAi) larvae mitochondria normalized by citrate synthase (CS) activity. Data are plotted as mean  ± SD (n = 3 biological replicates, pairwise comparisons by unpaired Student’s t test, *p ≤ 0.05). (J) High-resolution respirometric (HRR) analyses of whole-fly homogenates. Respiration is represented by oxygen flux (JO2) measured by oxygen consumption rates (OCR - pmol/s*fly). OCR have been measured via substrate-driven respiration under saturating concentrations of substrates inducing either complex I (CI) or complex II (CII) -linked respiration. Rotenone was used to block CI-linked respiration before measuring CII-linked respiration. HRR was performed on control (act5c-gal4>+) and Bcs1 KD (act5c-gal4>Bcs1 RNAi) homogenates compared to relative controls. Data are plotted as mean  ± SD (n = 3 biological replicates, two-way ANOVA with Sidak’s multiple comparisons, ****p ≤ 0.0001).
Figure 5—figure supplement 1.
Figure 5—figure supplement 1.. Quantification of complex and supercomplex bands in Bcs1 KD fly mitochondria.
The signal intensity of the bands from CI- and CII-in gel activity assays (IGA) of the mutated fly strains: (A) strong Bcs1RNAi and (B) mild Bcs1RNAi and their corresponding controls were quantified using the Gel analyzer 19.1 software. The graphs show the relative signal intensity of each CI-reactive band normalized to the intensity of the CII-reactive band from the same sample (n=3 biological replicates for each genotype, pairwise comparisons by unpaired Student’s t test **p≤0.01). The total relative intensity of all the CI-containing bands in the control samples was set to 1. Green bars = data corresponding to free complex I; red bars and stars = data corresponding to supercomplex containing CI and CIII2 (and CIV in the case of the mild Bcs1 KD); blue bars and stars = data corresponding to supercomplex containing CI, CIII2 and CIV. HMW-SC: high molecular weight supercomplex of unknown stoichiometry containing CI, CIII2, and CIV. (C) and (D) Western Blot signal intensity profiles obtained with Fiji (ImageJ) applying the same ROI (region of interest) in the BNGE lanes of strong Bcs1RNAi and mild Bcs1RNAi, respectively, in comparison with their corresponding controls. Relative intensity (R.I.) of the bands along the lane length (in inches) was plotted. High molecular weights are on the left and low molecular weights are on the right.
Figure 6.
Figure 6.. Mild perturbation of CI biogenesis enhances SC formation in D. melanogaster.
(A) Relative quantification (RQ) of Ndufs4 mRNA expression in control (act5c-gal4>+) and Ndufs4 KD (act5c-gal4>Ndufs4 RNAi) larvae measured by qPCR. Data are plotted as mean  ± SD (n = 3 biological replicates, Student’s t test **p ≤ 0.01). (B) In gel-activity assays for MRC complex I (CI), complex II (CII) and complex IV (CIV) in DDM-solubilized mitochondria from control (act5c-gal4>+) and Ndufs4 KD (act5c-gal4>Ndufs4 RNAi) larvae. (C) BN-PAGE, western blot immunodetection of MRC complexes from a pool of three control (act5c-gal4>+) and three Ndufs4 KD (act5c-gal4>Ndufs4 RNAi) larvae mitochondria samples, using antibodies against specific subunits: anti-UQCRC2 (complex III), anti-NDUFS3 (complex I), anti-COX4 (complex IV) and anti-SDHA (complex II). (D) Kinetic enzyme activity of individual MRC complexes in control (act5c-gal4>+) and Ndufs4 KD (act5c-gal4>RNAi) larvae mitochondria normalized by citrate synthase (CS) activity. Data are plotted as mean  ± SD (n = 3 biological replicates, pairwise comparisons by unpaired Student’s t test, **p ≤ 0.01). (E) High-resolution respirometry (HRR) analyses of whole-fly homogenates. Respiration is represented by oxygen flux (JO2) measured by oxygen consumption rates (OCR – pmol/s*fly). OCR have been measured via substrate-driven respiration under saturating concentrations of substrates inducing either complex I (CI) or complex II (CII) -linked respiration. Rotenone was used to block CI-linked respiration before measuring CII-linked respiration. HRR was performed on control (act5c-gal4>+) and Ndufs4 KD (act5c-gal4>Ndufs4 RNAi) homogenates compared to relative controls. Data are plotted as mean  ± SD (n = 3 biological replicates, two-way ANOVA with Sidak’s multiple comparisons, ****p ≤ 0.0001). (F) Relative quantification (RQ) of Ndufs4 mRNA expression in control (da-gal4>+) and Ndufs4 KD (da-gal4 >Ndufs4 RNAi) larvae measured by qPCR. Data are plotted as mean  ± SD (n = 3 biological replicates, Student’s t test ***p ≤ 0.001). (G) In gel-activity assays for MRC complex I (CI), complex II (CII) and complex IV (CIV) in DDM-solubilized mitochondria from control (da-gal4>+) and Ndufs4 KD (da-gal4 >Ndufs4 RNAi) larvae. (H) BN-PAGE, western blot immunodetection of MRC complexes from a pool of three control (da-gal4>+) and three Ndufs4 KD (da-gal4 >Ndufs4 RNAi) larvae mitochondria samples, using antibodies against specific subunits: anti-UQCRC2 (complex III), anti-NDUFS3 (complex I), anti-COX4 (complex IV) and anti-SDHA (complex II). (I) Kinetic enzyme activity of individual MRC complexes in control (da-gal4>+) and Ndufs4 KD (da-gal4 >Ndufs4 RNAi) larvae mitochondria normalized by citrate synthase (CS) activity. Data are plotted as mean  ± SD (n = 3 biological replicates, pairwise comparisons by unpaired Student’s t test, *p ≤ 0.05). (J) High-resolution respirometry (HRR) analyses of whole-fly homogenates. Respiration is represented by oxygen flux (JO2) measured by oxygen consumption rates (OCR - pmol/s*fly). OCR have been measured via substrate-driven respiration under saturating concentrations of substrates inducing either complex I (CI) or complex II (CII) -linked respiration. Rotenone was used to block CI-linked respiration before measuring CII-linked respiration. HRR was performed on control (act5c-gal4>+) and Ndufs4 KD (act5c-gal4>RNAi) homogenates compared to relative controls. Data are plotted as mean  ± SD (n = 4 biological replicates, two-way ANOVA with Sidak’s multiple comparisons).
Figure 6—figure supplement 1.
Figure 6—figure supplement 1.. Quantification of complex and supercomplex bands in Ndufs4 KD fly mitochondria.
The signal intensity of the bands from CI- and CII-in gel activity assays (IGA) of the mutated fly strains: (A) strong Ndufs4RNAi and (B) mild Ndufs4RNAi and their corresponding controls were quantified using the Gel analyzer 19.1 software. The graphs show the relative signal intensity of each CI-reactive band normalized to the intensity of the CII-reactive band from the same sample (n=3 biological replicates for each genotype, pairwise comparisons by unpaired Student’s t test **p≤0.01, ***p≤0.001). The total relative intensity of all the CI-containing bands in the control samples was set to 1. Green bars and stars = data corresponding to free complex I; red bars and stars = data corresponding to supercomplex containing CI and CIII2. (C) and (D) Western Blot signal intensity profiles obtained with Fiji (ImageJ) applying the same ROI (region of interest) in the BNGE lanes of strong Ndufs4RNAi and mild Ndufs4RNAi, respectively, in comparison with their corresponding controls. Relative intensity (R.I.) of the bands along the lane length (in inches) was plotted. High molecular weights are on the left and low molecular weights are on the right.

Update of

  • doi: 10.1101/2023.04.19.537447
  • doi: 10.7554/eLife.88084.1
  • doi: 10.7554/eLife.88084.2

References

    1. Acín-Pérez R, Bayona-Bafaluy MP, Fernández-Silva P, Moreno-Loshuertos R, Pérez-Martos A, Bruno C, Moraes CT, Enríquez JA. Respiratory complex III is required to maintain complex I in mammalian mitochondria. Molecular Cell. 2004;13:805–815. doi: 10.1016/s1097-2765(04)00124-8. - DOI - PMC - PubMed
    1. Acín-Pérez R, Fernández-Silva P, Peleato ML, Pérez-Martos A, Enriquez JA. Respiratory active mitochondrial supercomplexes. Molecular Cell. 2008;32:529–539. doi: 10.1016/j.molcel.2008.10.021. - DOI - PubMed
    1. Agip A-NA, Chung I, Sanchez-Martinez A, Whitworth AJ, Hirst J. Cryo-EM structures of mitochondrial respiratory complex I from Drosophila melanogaster. eLife. 2023;12:e84424. doi: 10.7554/eLife.84424. - DOI - PMC - PubMed
    1. Assouline Z, Jambou M, Rio M, Bole-Feysot C, de Lonlay P, Barnerias C, Desguerre I, Bonnemains C, Guillermet C, Steffann J, Munnich A, Bonnefont JP, Rötig A, Lebre AS. A constant and similar assembly defect of mitochondrial respiratory chain complex I allows rapid identification of NDUFS4 mutations in patients with Leigh syndrome. Biochimica et Biophysica Acta. 2012;1822:1062–1069. doi: 10.1016/j.bbadis.2012.01.013. - DOI - PubMed
    1. Berndtsson J, Kohler A, Rathore S, Marin‐Buera L, Dawitz H, Diessl J, Kohler V, Barrientos A, Büttner S, Fontanesi F, Ott M. Respiratory supercomplexes enhance electron transport by decreasing cytochrome c diffusion distance. EMBO Reports. 2020;21:e51015. doi: 10.15252/embr.202051015. - DOI - PMC - PubMed

Publication types

LinkOut - more resources