. 2023 Dec 15;133(24):e173160.
doi: 10.1172/JCI173160.

Endothelial lipid droplets suppress eNOS to link high fat consumption to blood pressure elevation

Affiliations

Endothelial lipid droplets suppress eNOS to link high fat consumption to blood pressure elevation

Boa Kim et al. J Clin Invest. .

Abstract

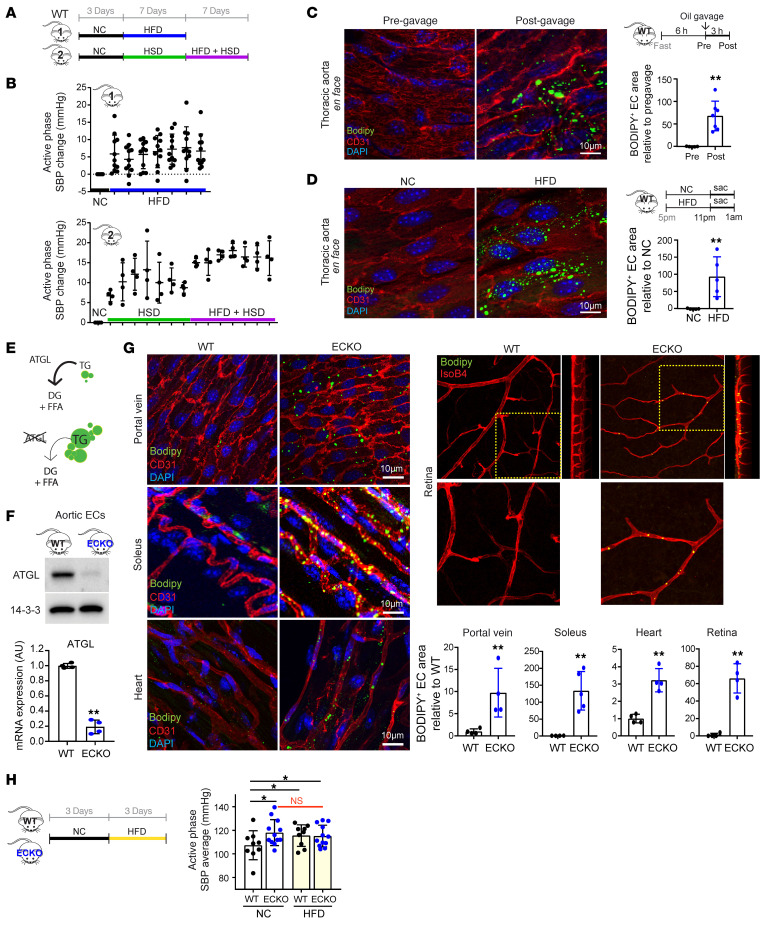
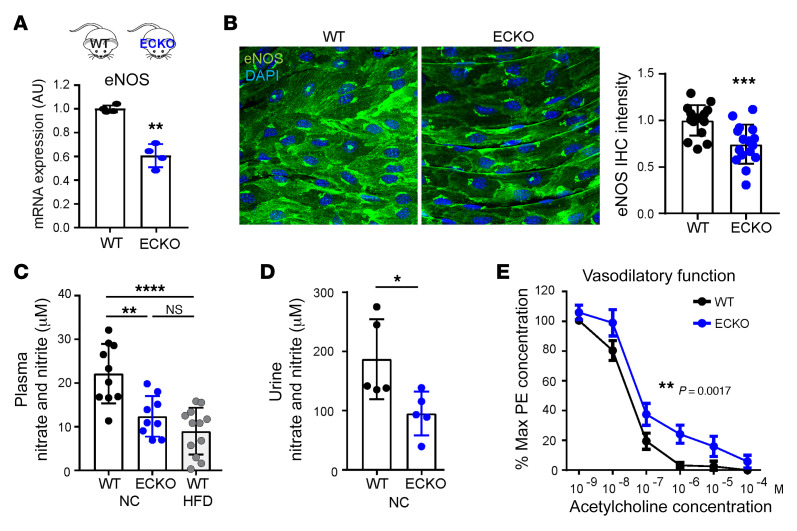
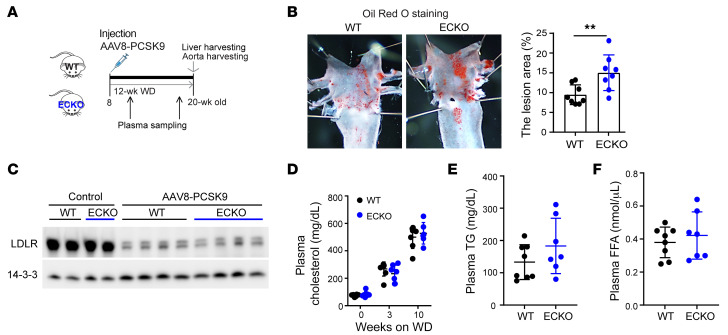
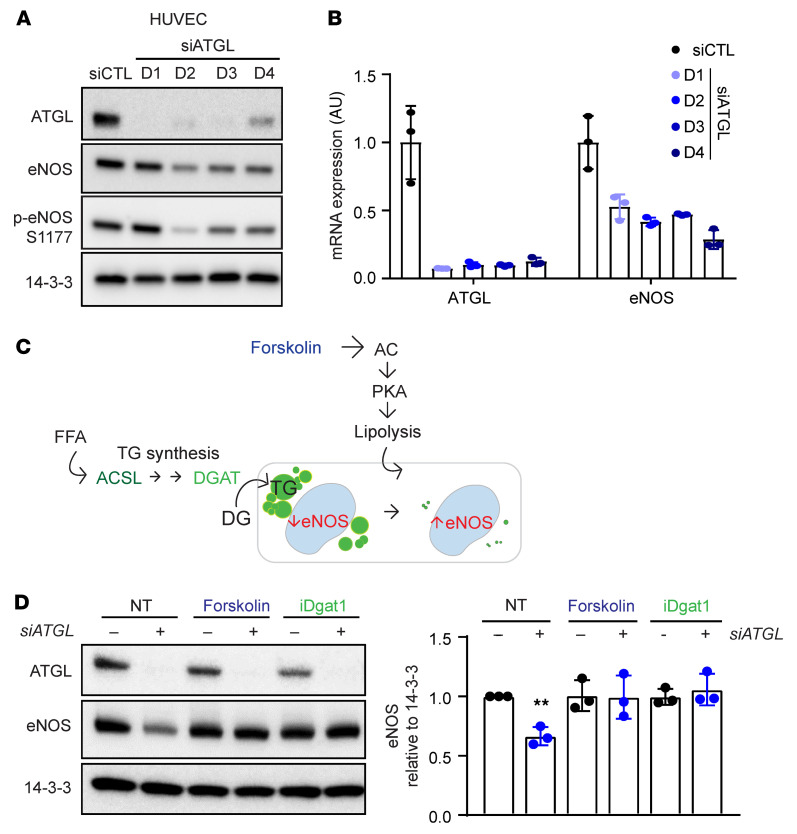
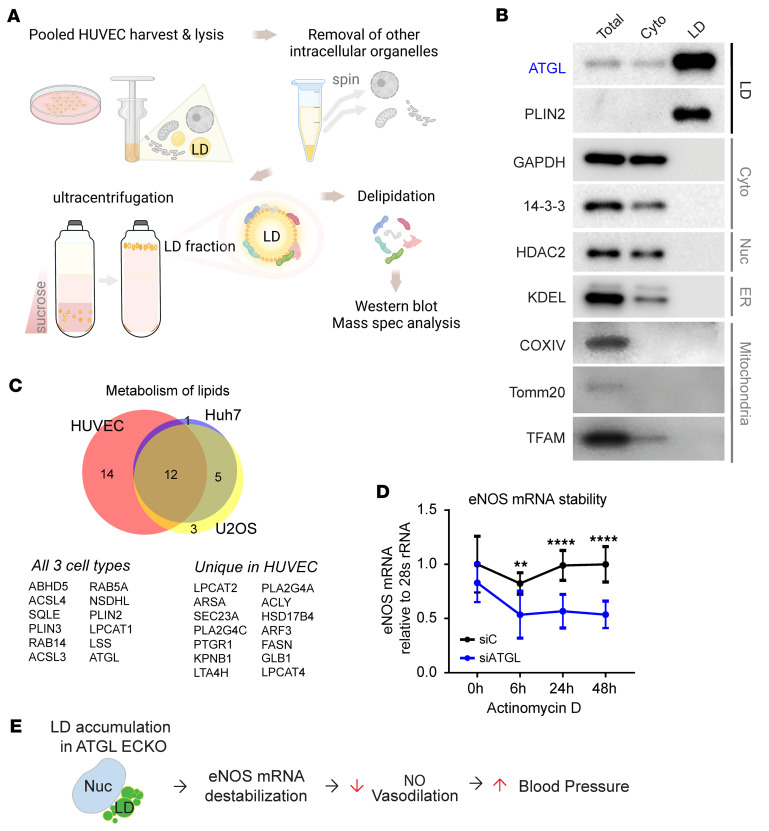
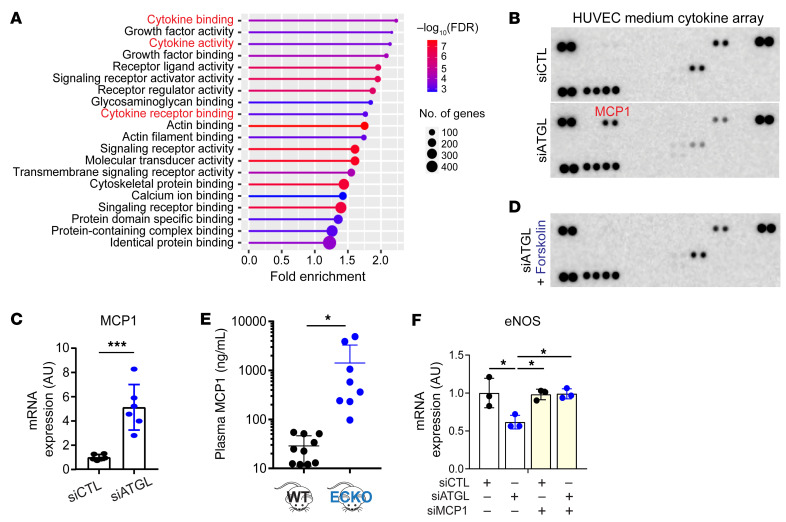
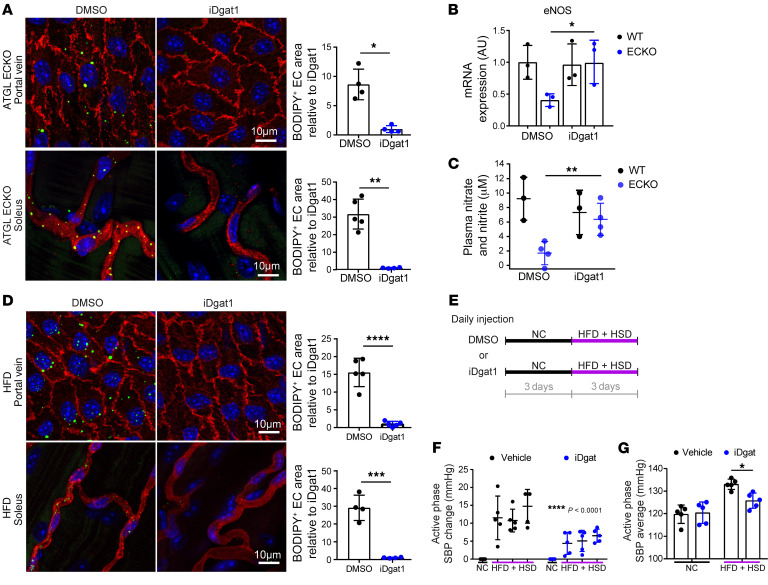
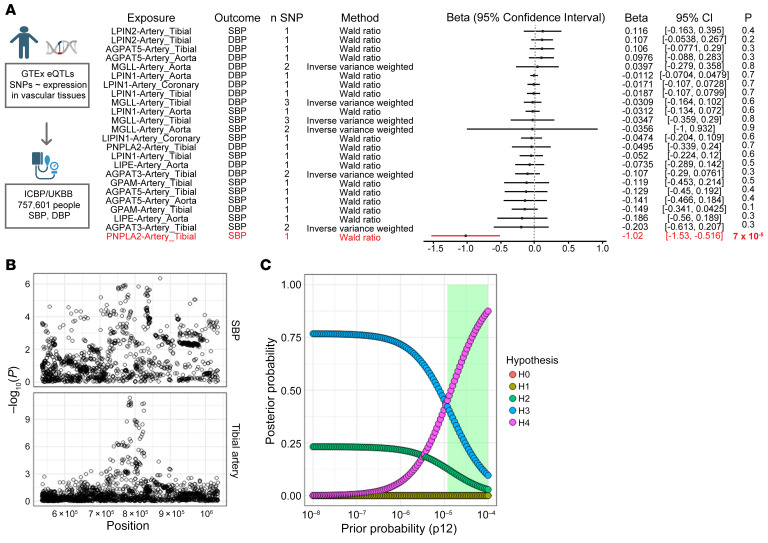
Metabolic syndrome, today affecting more than 20% of the US population, is a group of 5 conditions that often coexist and that strongly predispose to cardiovascular disease. How these conditions are linked mechanistically remains unclear, especially two of these: obesity and elevated blood pressure. Here, we show that high fat consumption in mice leads to the accumulation of lipid droplets in endothelial cells throughout the organism and that lipid droplet accumulation in endothelium suppresses endothelial nitric oxide synthase (eNOS), reduces NO production, elevates blood pressure, and accelerates atherosclerosis. Mechanistically, the accumulation of lipid droplets destabilizes eNOS mRNA and activates an endothelial inflammatory signaling cascade that suppresses eNOS and NO production. Pharmacological prevention of lipid droplet formation reverses the suppression of NO production in cell culture and in vivo and blunts blood pressure elevation in response to a high-fat diet. These results highlight lipid droplets as a critical and unappreciated component of endothelial cell biology, explain how lipids increase blood pressure acutely, and provide a mechanistic account for the epidemiological link between obesity and elevated blood pressure.

Keywords: Cardiology; Endothelial cells.


Conflict of interest statement

Conflict of interest: The authors have declared that no conflict of interest exists.

Figures

Figure 1
Figure 1. Endothelial deletion of Atgl phenocopies fat intake–induced accumulation of LDs and rise in BP.
(A) Experimental setup for administration of NC, HFD, HSD, or HFD+HSD in WT C57BL/6J mice, while monitoring BP by noninvasive telemetry. (B) Elevation of SBP during active phase (7 pm to 7 am) under indicated diet for 7 days. n = 11 (group 1); n = 4 (group 2). One-way ANOVA. (C and D) En face staining of thoracic aorta before and after olive oil gavage (10 mL/kg body weight) (C) or 5 hours of either NC or HFD ad libitum feeding (D) in WT C57BL/6J mice. BODIPY staining (green) indicates neutral lipids, and CD31 (red) marks the endothelium. BODIPY-positive area in the endothelium is quantified (right panel). n = 4–7 (C); n = 5 (D). **P < 0.01, t test. (E) Schematic of the role of ATGL in TG hydrolysis, yielding diacylglycerols (DG) and FFA. Deletion of ATGL leads to LD accumulation. (F) WB (upper panel) and qPCR (lower panel) of isolated aortic ECs from WT versus Atgl ECKO mice. n = 4. **P < 0.01, t test. (G) Whole-mount staining of portal vein, soleus, heart, and retina from fasted WT versus Atgl ECKO mice, imaged with BODIPY (green), anti-CD31 immunohistochemistry or IsoB4 lectin (red), and DAPI (blue). For the retina staining, side views of Z-stacked images are shown on the right, and zoomed-in images are shown below. BODIPY-positive area in the endothelium is quantified (right panel). n = 4–5. **P < 0.01, t test. (H) Left panel: experimental setup for administration of NC or HFD in WT versus Atgl ECKO mice. Right panel: average active-phase SBP in each genotype while provided with the indicated diet. n = 9 (WT); n = 12 (Atgl ECKO). *P < 0.05, 1-way ANOVA.
Figure 2
Figure 2. Endothelial deletion of ATGL suppresses eNOS and vasodilation.
(A) qPCR quantification of eNOS mRNA in ECs isolated from the lung of WT versus Atgl ECKO mice. n = 4. **P < 0.01, t test. (B) En face staining of eNOS protein in thoracic aorta from WT versus Atgl ECKO mice. Quantification of eNOS (green) fluorescence intensity (right panel). n = 16. ***P < 0.001, t test. Images were captured using a ×40 lens with a ×2 digital zoom. (C) Nitrate and nitrite levels measured in plasma from WT versus Atgl ECKO mice receiving NC and WT mice receiving HFD for 6 weeks. n = 9–12. **P < 0.01; ****P < 0.0001, 1-way ANOVA. n = 9–12 mice/group. (D) Nitrate and nitrite levels measured in urine from WT versus Atgl ECKO mice. *P < 0.05, t test. n = 5 mice/group. (E) Quantification by pressure myography of the vasodilatory response to ACh by carotid arteries explanted from WT versus Atgl ECKO mice. **P < 0.01, paired t test. n = 6 mice/group.
Figure 3
Figure 3. Endothelial deletion of ATGL accelerates atherosclerosis in the PCSK9 overexpression model.
(A) Schematic of experimental setup for AAV8-PCSK9 injection–induced atherosclerosis model. WD, Western diet. (B) Oil Red O staining of aortic arch in WT versus Atgl ECKO mice and quantification of Oil Red O–positive lesion area. **P < 0.01, t test. n = 8 mice/group. (C) LDLR protein levels in the liver of WT versus Atgl ECKO mice with or without AAV8-PCSK9 injection. (DF) Plasma cholesterol, TG, and FFA measurements in WT versus Atgl ECKO mice at the indicated time points following AAV8-PCSK9 injection. n = 7–8.
Figure 4
Figure 4. Endothelial knockdown of ATGL suppresses eNOS via the accumulation of LDs.
(A and B) WB of the indicated proteins (A) and quantification by qPCR of the indicated mRNAs (B) days 1–4 (D1–D4) after knockdown of ATGL by siRNA transfection in HUVECs. n = 3. (C) Schematic indicating the 2 approaches taken to reducing LD burden: enhancing lipolysis (with forskolin) or blocking TG synthesis (with siACSL or siDGAT1, see Supplemental Figure 10; or with DGAT inhibition). (D) WB of ATGL and eNOS in HUVECs treated for 2 days with siATGL, forskolin, or iDGAT1, as indicated. Quantification of eNOS protein levels relative to 14-3-3 is shown in right panel. n = 3. **P < 0.01, 1-way ANOVA.
Figure 5
Figure 5. Endothelial LD accumulation leads to eNOS mRNA destabilization.
(A) Schematic of LD purification experiment in HUVECs. Spec, spectrometry. (B) WB of indicated intracellular organellar marker proteins in total, cytosolic, and LD fraction. (C) Venn diagram comparing the LD proteomics data sets of HUVECs and Huh7 and U2OS cells involved in lipid metabolism. List of overlapping in all 3 cell types and unique LD proteins in HUVECs. (D) eNOS mRNA stability measurements in siCTL versus siATGL HUVECs in response to actinomycin D treatment (5 nM). eNOS mRNA levels at indicated time points following actinomycin D were normalized to 28s rRNA. n = 8. **P < 0.01; ****P < 0.0001, 2-way ANOVA. (E) Model showing LD accumulation suppresses eNOS mRNA stability, NO production, and vasodilatory capacity, leading to BP elevation.
Figure 6
Figure 6. Endothelial LDs induce MCP1 production.
(A) Molecular function GO analysis of differentially expressed genes in HUVECs treated with siCTL versus siATGL. (B) Cytokine array assay with media conditioned by HUVECs treated with siCTL versus siATGL. (C) Quantification of MCP1 mRNA by qPCR in HUVECs treated with siATGL. n = 6. ***P < 0.001, t test. (D) As in B, simultaneously treated with forskolin. (E) Luminex analysis of MCP1 levels in plasma from WT versus Atgl ECKO mice. *P < 0.05, t test. n = 8–10 mice. (F) Quantification of eNOS mRNA by qPCR in HUVECs treated with the indicated siRNAs. n = 3. *P < 0.05, 1-way ANOVA.
Figure 7
Figure 7. Suppression of LD formation rescues the induction of BP by endothelial ATGL deletion or by HFD.
(A) En face staining of portal vein (upper panel) and whole-mount staining of capillary vessels in the soleus (lower panel) after DMSO versus iDGAT1 injection in Atgl ECKO mice. iDGAT1 was given at 3 mg/kg via i.p. injection. BODIPY staining (green) indicates neutral lipids, and CD31 (red) marks the endothelium. BODIPY-positive area in the endothelium is quantified. *P < 0.05; **P < 0.01, t test. n = 4–5 mice/group. (B) eNOS mRNA levels measured in isolated ECs from lung of WT versus Atgl ECKO mice after a week of DMSO versus iDGAT1 injection. n = 3. *P < 0.05, 1-way ANOVA. (C) Nitrate and nitrite levels measured in the plasma of WT versus Atgl ECKO mice after a week of DMSO or iDGAT1 injection (3 mg/kg i.p.). **P < 0.01, 1-way ANOVA. n = 3–4 mice/group. (D) En face staining of portal vein (upper panel) and whole-mount staining of capillary vessels in the soleus (lower panel) after DMSO versus iDGAT1 injection (3 mg/kg i.p.) in C57BL/6J WT mice maintained on a 3-day HFD. BODIPY staining (green) indicates neutral lipids, and CD31 (red) marks the endothelium. BODIPY-positive area in the endothelium is quantified on the right. n = 4–5. ***P < 0.001; ****P < 0.0001, t test. (E) Experimental setup of daily administration of DMSO or iDGAT1 in C57BL/6J WT mice while providing NC or HFD+HSD. (F) Elevation of SBP during the active phase while provided with the indicated diet. ****P < 0.0001, 2-way ANOVA. n = 5 mice/group. (G) Average active phase SBP while provided with the indicated diet. *P < 0.05, 1-way ANOVA. n = 5 mice/group.
Figure 8
Figure 8. Association of vascular ATGL expression with BP in humans.
(A) Results of 2-sample inverse variance weighted Mendelian randomization, testing the effects of expression of LD-associated genes in vascular tissues (aorta, coronary artery, tibial artery) on SBP and DBP. (B) Regional association plots highlighting ± 250 kb surrounding the PNPLA2 locus for SBP (top) and tibial artery (bottom) on chromosome 11. (C) Results of Bayesian enumeration colocalization sensitivity analysis. Each hypothesis corresponds to a different causal configuration, and the posterior probability of each hypothesis is plotted across a range of prior probabilities (default P12 = 1 × 10⁻⁵). H0, neither trait has a genetic association in the region; H1, only SBP has a genetic association in the region; H2, only PNPLA2 expression in tibial artery has a genetic association in the region; H3, both traits have genetic associations, but different causal variants; and H4, both traits have genetic associations and share a single causal variant. From the default (default P12 = 1 × 10⁻⁵) to more optimistic (P12 = 1 × 10⁻⁴) priors (corresponding to approximately 1.3% and 13% probabilities of a shared causal variant), there is intermediate (41.2%) to strong (87.5%) posterior probability for a shared causal variant at the PNPLA2 locus surrounding the lead eQTL. The shaded green region denotes the range of prior probabilities which lead to H4 > H3.

References

    1. Hall JE, et al. Obesity-induced hypertension: interaction of neurohumoral and renal mechanisms. Circ Res. 2015;116(6):991–1006. doi: 10.1161/CIRCRESAHA.116.305697. - DOI - PMC - PubMed
    1. Gosmanov AR, et al. Effects of oral and intravenous fat load on blood pressure, endothelial function, sympathetic activity, and oxidative stress in obese healthy subjects. Am J Physiol Endocrinol Metab. 2010;299(6):E953–E958. doi: 10.1152/ajpendo.00469.2010. - DOI - PMC - PubMed
    1. Grekin RJ, et al. Mechanisms in the pressor effects of hepatic portal venous fatty acid infusion. Am J Physiol. 1997;273(1 pt 2):R324–R330. - PubMed
    1. Stojiljkovic MP, et al. Hemodynamic effects of lipids in humans. Am J Physiol Regul Integr Comp Physiol. 2001;280(6):R1674–R1679. doi: 10.1152/ajpregu.2001.280.6.R1674. - DOI - PubMed
    1. Umpierrez GE, et al. Intravenous intralipid-induced blood pressure elevation and endothelial dysfunction in obese African-Americans with type 2 diabetes. J Clin Endocrinol Metab. 2009;94(2):609–614. doi: 10.1210/jc.2008-1590. - DOI - PMC - PubMed

Publication types

Substances