. 2023 Dec 1;133(23):e168277.
doi: 10.1172/JCI168277.

Improving radiotherapy in immunosuppressive microenvironments by targeting complement receptor C5aR1

Affiliations

Improving radiotherapy in immunosuppressive microenvironments by targeting complement receptor C5aR1

Callum Beach et al. J Clin Invest. .

Abstract

An immunosuppressive microenvironment causes poor tumor T cell infiltration and is associated with reduced patient overall survival in colorectal cancer. How to improve treatment responses in these tumors is still a challenge. Using an integrated screening approach to identify cancer-specific vulnerabilities, we identified complement receptor C5aR1 as a druggable target, which when inhibited improved radiotherapy, even in tumors displaying immunosuppressive features and poor CD8+ T cell infiltration. While C5aR1 is well-known for its role in the immune compartment, we found that C5aR1 is also robustly expressed on malignant epithelial cells, highlighting potential tumor cell-specific functions. C5aR1 targeting resulted in increased NF-κB-dependent apoptosis specifically in tumors and not normal tissues, indicating that, in malignant cells, C5aR1 primarily regulated cell fate. Collectively, these data revealed that increased complement gene expression is part of the stress response mounted by irradiated tumors and that targeting C5aR1 could improve radiotherapy, even in tumors displaying immunosuppressive features.

Keywords: Cancer; Cell Biology; Complement; Oncology; Radiation therapy.


Figures
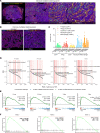
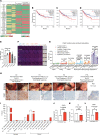
Figure 1
Figure 1. Identification of radiation-responsive targets in immunosuppressive tumors.
(A) Representative images of villinCreER; Apcfl/fl; KrasG12D/+; Trp53fl/fl TgfbrIfl/fl (AKPT) colorectal tumor organoids grown subcutaneously. Multiplex staining of epithelial and stromal cells is shown in whole tumor (left; scale bar: 1 mm) and zoomed in regions (scale bar: 1 mm, 500 μm, and 100 μm [left to right]). (B) Representative images of AKPT colorectal tumor organoids grown subcutaneously and treated with either 0 Gy (left) or 15 Gy (right) (scale bar: 100 μm). Multiplex staining of epithelial and immune cells is shown. (C) Machine learning–based quantification of immune cell infiltration in AKPT tumors following multiplex staining at different time points following RT. n = 5 per group. (D) Ranked normalized enrichment scores (NES) are shown below the network graphs for the significant positively enriched pathways. The complement pathways appear among the top most enriched pathways at each time point after 15 Gy radiation treatment. The top enriched pathway for each plot is also shown for comparison. Ranks of pathways annotated as immune system pathways in Reactome are denoted by the vertical lines in red. n = 5 (control, n = 9). (E) Pairwise gene set enrichment analysis comparing irradiated AKPT tumors at 4 hours, 24 hours, 3 days, or 7 days after 15 Gy compared with unirradiated controls. P values, enrichment scores (ES), and NES scores are also provided. Complement gene signatures (described in ref. 17) are shown. n = 5 (control, n = 9). (F) Pairwise gene set enrichment analysis comparing baseline samples to samples collected 2 weeks, 6 weeks, or 12 weeks after starting RT in longitudinal biopsies from patients with rectal adenocarcinoma. P values, ES, and NES scores are also provided. Complement gene signatures (described in ref. 17) are shown.
Figure 2
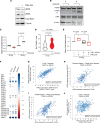
Figure 2. C5aR1 is a radiation-responsive druggable target.
(A) Essential genes are shown in red. Nonessential genes are shown in green. Yellow/Orange indicates intermediate dependence or essentiality. For target tractability, green corresponds with druggable structure = Yes and druggable by ligand-based assessment = Yes. Red corresponds to druggable structure = No and druggable by ligand-based assessment = No. (B) Kaplan-Meier (KM) curve for disease-free survival (dfs) of TCGA patients with CRC with high (red) or low (blue) C4BPA mRNA expression. For all KM curves, group cutoff = median (http://gepia.cancer-pku.cn). (C) KM curve for dfs of TCGA patients with CRC with high (red) or low (blue) C5 mRNA expression. (D) KM curve for dfs of TCGA CRC with high (red) or low (blue) C5AR1 mRNA expression. (E) Quantification of C5aR1 immunohistochemistry staining in AKPT tumors. *P < 0.05, ordinary 1-way ANOVA, Dunnett’s multiple comparisons. All other comparisons relative to untreated were not significant. n = 5. (F) Representative images of multiplex and C5aR1 IHC staining in AKPT tumors (original magnification, ×40) Scale bar: 500 µm. (G) Proximity-based machine learning quantification of the percentage of C5aR1 staining in the epithelium and stroma of AKPT tumors. *P < 0.05, **P < 0.01, ****P < 0.0001, ordinary 1-way ANOVA with Tukey’s multiple comparisons. All other comparisons relative to untreated were not significant. n = 5. (H) Endoscopy images and representative examples of C5aR1 staining at baseline (W0) compared with W2 in longitudinal biopsies from patients with rectal adenocarcinoma. W2, week 2 after treatment. Numbers refer to patient number, week after treatment, or TNM stage. Scale bar: 100 mm. (I) H-Scores of C5aR1 staining in epithelial and stromal areas of cancerous tissue from rectal adenocarcinoma longitudinal biopsies taken at W0 compared with W2. (J) mRNA expression of C5AR1/housekeeping in HCT116 cells treated with either 0 or 9 Gy. n = 3. **P < 0.01, 2-tailed t test. (K) mRNA expression of C5/housekeeping in HCT116 cells treated as in J. n = 3. Two-tailed t test. (L) C5aR1 median fluorescence intensity in HCT116 cells treated with either 0 or 9 Gy. n = 3. *P < 0.05, 2-tailed t test.
Figure 3
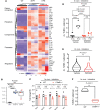
Figure 3. C5aR1 regulates tumor cell survival under stress.
(A) HCT116 cells were treated with either vehicle or PMX205 (10 mg/mL) for 48 hours. Western blotting was carried with the antibodies indicated. (B) HCT116 cells were treated with 0 or 9 Gy and either vehicle or PMX205 for 1 hour before RT. Cells were harvested 48 hours after RT. Western blotting was carried with the antibodies indicated. (C) The ratio of dead (apoptotic) cells/nonapoptotic cells as a percentage of the whole population relative to vehicle-treated cells. n = 3. *P < 0.05, 2-tailed t test. (D) TUNEL+ cells per field of view of sections from HCT116 subcutaneous tumors. Mice were treated with 9 Gy and either vehicle or PMX205 (10 mg/kg) for 3 doses flanking RT. *P < 0.05, 2-tailed t test. (E) The number of dead(apoptotic)/nonapoptotic cells as a percentage of the whole population for HCT116 cells transfected with either Scr or IκBα siRNA and treated with either vehicle or PMX205 for 1 hour before RT. Cells were harvested 48 hours after RT. Independent fields of view from a representative experiment are shown, n = 3. *P < 0.05, 2-tailed t test. (F) Pearson’s correlation of mRNA expression of pro- and antiapoptotic genes with C5aR1 in TCGA samples from patients with CRC and rectal cancer biopsies from Grampian and Aristotle. *P < 0.05, ***P < 0.001, ****P < 0.0001. All TCGA data were accessed through cBioPortal (http://www.cbioportal.org/). All Grampian and Aristotle data were accessed through SCORT (stratification in colorectal cancer, http://www.cbioportal.org/). (G) Correlation of BCL2A1 and C5AR1 mRNA expression in TCGA CRC samples. (H) Correlation of BCL2A1 and C5AR1 mRNA expression in Grampian rectal cancer biopsies. (I) Correlation of BCL2A1 and C5AR1 mRNA expression in Aristotle rectal cancer biopsies. (J) Correlation of BCL2 and C5AR1 mRNA expression in TCGA CRC samples.
Figure 4
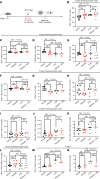
Figure 4. C5aR1 deficiency does not result in increased apoptosis in healthy intestinal epithelium.
(A) Heatmap of complement genes differentially expressed by RNA-Seq in WT, AKPT, or KPN organoids grown in vitro. Upregulation is shown in red, as per Z-score indicated below. Data for 3 independent samples is shown from data deposited at the ArrayExpress database under accession number E-MTAB-11769 (46). (B) C5aR1 expression (CPM) assessed by RNA-Seq in WT, AKPT, or KPN organoids grown in vitro as in A. ***P < 0.001, empirical Bayes moderated t-statistic test. (C) mRNA expression of Bcl2, Bcl2l1, Bcl2l2, Ier3, and Xiap in WT or C5aR1–/– mice treated with 9 Gy. Points indicate individual mice per group. n = 3. *P = 0.0468, unpaired 2-tailed t test. (D) The average TUNEL+ cells/crypt of BALBc/J mice treated with either 0 or 9 Gy and either vehicle or PMX205. Intestines were harvested 72 hours after RT. n = 4/5 mice per group. ****P < 0.0001, by ordinary 1-way ANOVA with Tukey’s multiple comparisons. (E) The average TUNEL+ cells/crypt of C57BL/6 mice treated with 9 Gy and either vehicle or PMX205. Intestines were harvested 72 hours after RT. n = 3 mice per group. **P < 0.01, 2-tailed t test. (F) The average number of TUNEL+ cells of WT or C5aR1–/– mice treated with 9 Gy. Intestines were harvested 48 hours after RT. n = 3 mice per group. *P < 0.05, 2-tailed t test.
Figure 5
Figure 5. C5aR1 inhibition improves tumor radiation response.
(A) Schematic representation of the treatment schemes followed. Created with BioRender.com. (B) Relative tumor growth curves are shown for MC38 subcutaneous tumors treated with either vehicle or PMX205 treatment for 3 doses (on day 0, 1, and 2). P = 0.6183 by repeated measures 2-way ANOVA (with Geisser-Greanhouse correction). n = 7 for PMX205; n = 6 for vehicle. (C) Relative tumor growth curves are shown for MC38 subcutaneous tumors treated with 3 × 4.45 Gy and either vehicle or PMX205 treatment for 3 doses flanking RT. Individual points represent individual mice per group. ****P < 0.0001 by repeated measures 2-way ANOVA (with Geisser-Greanhouse correction); P = 0.0073 for day 3; P = 0.0048 for day 6; P = <0.0001 for day 8 and 11 with Šídák’s multiple comparison test. n = 7 for both groups. (D) Relative tumor growth curves are shown for MC38 subcutaneous tumors treated with single-dose 9 Gy and either vehicle or PMX205 treatment for 3 doses flanking RT. Individual points represent individual mice per group. P = 0.0211 by repeated measures 2-way ANOVA (with Geisser-Greanhouse correction); P = 0.0001 for day 11 with Šídák’s multiple comparison test. n = 7 for PMX205; n = 8 for vehicle.
Figure 6
Figure 6. Targeting C5aR1 does not increase the percentage of CD8+ T cells in the tumor following RT.
(A) Schematic representation of the experimental design for BN. Created with BioRender.com. (B) CD3+ T cells in tumor draining lymph nodes following the dosing scheme shown in A. Tumors were harvested 7 days after RT. Ordinary 1-way ANOVA with Tukey’s multiple comparisons test. n = 5. (C) CD4+ T cells in tumor draining lymph nodes following the dosing scheme, harvesting schedule, and statistical analysis shown in B. n = 5. (D) Total B cells in tumor draining lymph nodes following the dosing scheme, harvesting schedule, and statistical analysis shown in B. n = 5. (E) Total NK cells in tumor draining lymph nodes following the dosing scheme, harvesting schedule, and statistical analysis shown in B. n = 5. (F) CD8+ T cells in tumor draining lymph nodes following the dosing scheme, harvesting schedule, and statistical analysis shown in B. n = 5. (G) Tregs in tumor draining lymph nodes following the dosing scheme, harvesting schedule, and statistical analysis shown in B. n = 5. (H) IFN-γ+ CD8 T cells in tumor draining lymph nodes following the dosing scheme, harvesting schedule, and statistical analysis shown in B. n = 5. (I) GrzB+CD8 T cells in tumor draining lymph nodes following the dosing scheme, harvesting schedule, and statistical analysis shown in B. n = 5. (J) GrzB+IFN-γ+ CD8 T cells in tumor draining lymph nodes following the dosing scheme, harvesting schedule, and statistical analysis shown in B. n = 5. (K) TNF-α+ IFN-γ+ CD8 T cells in tumor draining lymph nodes following the dosing scheme, harvesting schedule, and statistical analysis shown in B. n = 5. (L) TNF-α+ CD8 T cells in tumor draining lymph nodes following the dosing scheme, harvesting schedule, and statistical analysis shown in B. n = 5. (M) CD3+ T cells in tumors following the dosing scheme, harvesting schedule, and statistical analysis shown in B. n = 5. (N) CD8+ T cells in tumors following the dosing scheme, harvesting schedule, and statistical analysis shown in B. n = 5.
Figure 7
Figure 7. C5aR1 inhibition can improve radiotherapy in tumors with an immunosuppressive microenvironment.
(A) Curves show counted viable AKPT organoids vs. RT dose following treatment with vehicle or PMX205. **P < 0.01, Welch’s t test. Data are shown as the mean. Error bars represent standard deviation. (B) Schematic representation of experimental design for CF. Created with BioRender.com. (C) Tumor growth curves for AKPT organoids grown subcutaneously and treated with 0 Gy and vehicle or PMX205. Comparisons were not significant (P = >0.05) by repeated measures 2-way ANOVA (with Geisser-Greanhouse correction). n = 7 mice/group. (D) Tumor growth curves for AKPT organoids grown subcutaneously and treated with 9 Gy and vehicle or PMX205 flanking RT. ****P < 0.0001 by repeated measures 2-way ANOVA (with Geisser-Greanhouse correction); P < 0.05 for day 10, 14, and 17 with Šídák’s comparison test. n = 7 mice/group. (E) Probability of survival for tumor-bearing mice from C and D. ****P < 0.0001, log-rank. n = 7 mice/group. (F) The percentage of apoptotic (TUNEL+) area/hematoxylin+ area in mice from C and D. **P < 0.01, ordinary 1-way ANOVA with Dunnett’s multiple comparisons test. n = 4–8 mice/group. (G) Tumor growth curves for AKPT organoids grown subcutaneously in athymic nude mice and treated with 0 Gy and vehicle or PMX205. Comparisons were not significant (P > 0.05) by repeated measures 2-way ANOVA (with Geisser-Greanhouse correction). n = 7 mice/group. (H) Tumor growth curves for AKPT organoids grown subcutaneously in athymic nude mice and treated with 9 Gy and vehicle or PMX205 flanking RT. ***P < 0.001, repeated measures 2-way ANOVA (with Geisser-Greanhouse correction); ***P < 0.001 for day 24, Šídák’s comparison test. n = 7 mice/group. (I) Probability of survival for mice from G and H. ****P < 0.0001, log-rank. n = 7/group (n = 6 for 0 Gy vehicle). (J) Working model: C5aR1 attenuates RT-induced tumor cell death via increased prosurvival signaling (including NF-κB). Upon C5aR1 blockade, tumor cells undergo increased RT-induced cell death, which is not observed in the intestinal epithelium. Created with BioRender.com.

References

    1. Llosa NJ, et al. The vigorous immune microenvironment of microsatellite instable colon cancer is balanced by multiple counter-inhibitory checkpoints. Cancer Discov. 2015;5(1):43–51. doi: 10.1158/2159-8290.CD-14-0863. - DOI - PMC - PubMed
    1. Bindea G, et al. Spatiotemporal dynamics of intratumoral immune cells reveal the immune landscape in human cancer. Immunity. 2013;39(4):782–795. doi: 10.1016/j.immuni.2013.10.003. - DOI - PubMed
    1. Tauriello DVF, et al. TGFβ drives immune evasion in genetically reconstituted colon cancer metastasis. Nature. 2018;554(7693):538–543. doi: 10.1038/nature25492. - DOI - PubMed
    1. Guinney J, et al. The consensus molecular subtypes of colorectal cancer. Nat Med. 2015;21(11):1350–1356. doi: 10.1038/nm.3967. - DOI - PMC - PubMed
    1. Galon J, et al. Type, density, and location of immune cells within human colorectal tumors predict clinical outcome. Science. 2006;313(5795):1960–1964. doi: 10.1126/science.1129139. - DOI - PubMed

Publication types