. 2023 Nov 22;8(22):e164380.
doi: 10.1172/jci.insight.164380.

Functional Pdgfra fibroblast heterogeneity in normal and fibrotic mouse lung

Affiliations

Functional Pdgfra fibroblast heterogeneity in normal and fibrotic mouse lung

Carol S Trempus et al. JCI Insight. .

Abstract

Aberrant fibroblast function plays a key role in the pathogenesis of idiopathic pulmonary fibrosis, a devastating disease of unrelenting extracellular matrix deposition in response to lung injury. Platelet-derived growth factor α-positive (Pdgfra+) lipofibroblasts (LipoFBs) are essential for lung injury response and maintenance of a functional alveolar stem cell niche. Little is known about the effects of lung injury on LipoFB function. Here, we used single-cell RNA-Seq (scRNA-Seq) technology and PdgfraGFP lineage tracing to generate a transcriptomic profile of Pdgfra+ fibroblasts in normal and injured mouse lungs 14 days after bleomycin exposure, generating 11 unique transcriptomic clusters that segregated according to treatment. While normal and injured LipoFBs shared a common gene signature, injured LipoFBs acquired fibrogenic pathway activity with an attenuation of lipogenic pathways. In a 3D organoid model, injured Pdgfra+ fibroblast-supported organoids were morphologically distinct from those cultured with normal fibroblasts, and scRNA-Seq analysis suggested distinct transcriptomic changes in alveolar epithelia supported by injured Pdgfra+ fibroblasts. In summary, while LipoFBs in injured lung have not migrated from their niche and retain their lipogenic identity, they acquire a potentially reversible fibrogenic profile, which may alter the kinetics of epithelial regeneration and potentially contribute to dysregulated repair, leading to fibrosis.

Keywords: Fibrosis; Pulmonology.


Conflict of interest statement

Conflict of interest: The authors have declared that no conflict of interest exists.

Figures

Figure 1
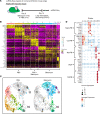
Figure 1. Pdgfra+ populations in normal and fibrotic mouse lung.
(A) Diagram of experimental workflow. Data were generated from 3 PBS- and 3 bleomycin-treated mice, pooled for isolation of GFP+ cells. (B) Integrated heatmap of PBS- and bleomycin-derived scRNA-Seq analysis depicting 11 unique clusters based on individual cluster markers. (C) Uniform manifold approximation and projection (UMAP) representation of cluster distribution across treatment groups. (D) Dot plot representation of individual clusters to establish identification of cluster subtypes: matrix fibroblasts (MatrixFB), lipofibroblasts (LipoFB), myofibroblasts (MyoFB), proliferating mesenchymal progenitors (PMP), and mesothelial fibroblasts (MEFB).
Figure 2
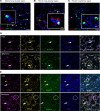
Figure 2. Characterization of gene markers in normal and fibrotic PdgfraGFP mouse lung.
(AC) Localization of PLIN2 expression by immunofluorescent staining in normal (A) and fibrotic (B and C) lung. Yellow arrowheads show GFP+ cells with adjacent PLIN2 expression. (D) Localization of GFP, PLIN2, BODIPY+ lipid droplets, and DAPI in normal (PBS) and fibrotic (bleomycin) lung. Arrows indicate area of colocalization of all markers. (E) Localization of GFP, SMA22, BODIPY+ lipid droplets, and DAPI in normal (PBS) and fibrotic (bleomycin) lung. Arrows indicate a region of high SMA22 expression and low lipid droplet accumulation; the dotted circle highlights an area of low SMA22 expression and high lipid droplet accumulation. Yellow arrowheads show SMA22+ smooth muscle cells. Scale bars: 50 μm (AC), 10 μm (AC, insets), and 20 μm (D and E).
Figure 3
Figure 3. A unique shared transcriptomic signature supports LipoFB identity in normal and fibrotic lung.
(A) Heatmap representation of up- and downregulated genes across all clusters showing conserved expression between normal (cluster 0, boxed) and fibrotic (cluster 6, boxed) Pdgfra+ LipoFBs. (B) Bar chart of 22 upregulated shared genes between clusters 0 and 6 indicating functional categories and signature genes in each category.
Figure 4
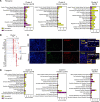
Figure 4. Pdgfra+ LipoFBs acquire a fibrotic phenotype following injury, with attenuation of lipogenic pathways.
(A) Canonical pathway profiling of fibrogenic pathways between normal LipoFBs (cluster 0), fibrotic LipoFBs (cluster 6), and activated MyoFBs (cluster 9). Yellow indicates upregulated, purple downregulated. (B) Dot plot of stress fiber– and ECM-related genes. * = cluster 0, normal LipoFB; ** = cluster 6, injured LipoFB; # = cluster 9, MyoFB. (C) Localization of EFEMP2 and GFP in normal and injured lung; insets show alveolar regions. Yellow arrowheads point to regions of colocalization and white arrowheads show GFP with no EFEMP2 coexpression. Scale bars: 200 μm and 50 μm (insets). (D) Canonical pathway profiling of lipogenic pathways between normal LipoFBs (cluster 0), fibrotic LipoFBs (cluster 6), and activated MyoFBs (cluster 9).
Figure 5
Figure 5. LipoFBs undergo regenerative or pathologic trajectories following bleomycin-induced fibrosis.
(A) Pseudotime analysis using normal LipoFBs (cluster 0) as the origin, with a loop trajectory through fibrotic LipoFBs (cluster 6) back to normal LipoFBs. (B) Heatmap of fibrogenic and lipogenic gene transition in the loop regenerative trajectory. (C) Pseudotime analysis using normal LipoFBs (cluster 0) as the origin, with a linear trajectory progression through cluster 7 and terminating at MyoFBs (cluster 9). (D) Heatmap of fibrogenic and lipogenic gene transition in the linear pathologic trajectory.
Figure 6
Figure 6. Fibroblast subpopulations in normal and fibrotic lungs of humans and mice revealed by scRNA-Seq analyses.
(A) Fibroblast populations in 4 bleomycin-induced and 4 saline control lung tissues on day 11 from GEO GSE129605. (B) Fibroblast populations on day 14: scRNA-Seq fibrosis and wild-type control data from 2 Col1a1GFP reporter mice treated with bleomycin (GEO GSE132771). (C) Fibroblast populations in human lung tissue: scRNA-Seq data from 8 normal lung transplant donors and 4 IPF patients (GEO GSE122960). (D) Fibroblast populations in human scRNA-Seq lung data from 3 normal individuals and 3 IPF patients (GEO GSE132771). For panels AD, the dot plots display the expression patterns of fibroblast subtypes using top markers from Figure 1D. (EH) The same data sets (AD, respectively) queried with the shared LipoFB gene from Figure 3. IPF, idiopathic pulmonary fibrosis; MatrixFB, matrix fibroblast; LipoFB, lipofibroblast; MyoFB, myofibroblast; PMP, proliferating mesenchymal progenitors; ME, mesothelial cell.
Figure 7
Figure 7. Proteomic and transcriptomic multiomics analyses reveal directional lipogenic and fibrogenic expression patterns in normal and injured Pdgfra+ fibroblasts.
High confidence identifications (≥100 sum posterior error probability [PEP] score). (A) Scatterplot of log(bleomycin/PBS ratio) of protein vs. RNA data. (B) Heatmap of log(bleomycin/PBS ratio) of protein vs. RNA data. (C) Heatmap of protein samples (PBS 1–4 and bleomycin 1–4) and RNA clusters (clusters 0–11) from normal and fibrogenic Pdgfra+ fibroblasts. Protein columns are centered log2-transformed data. RNA columns are log2(fold change) [log2(FC)] data. All columns are labeled with normal fold change values. Columns have been ordered to emphasize correlations. * = cluster 0, normal LipoFB; ** = cluster 6, injured LipoFB; # = cluster 9, MyoFB.
Figure 8
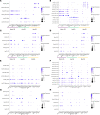
Figure 8. Correlation of normal and fibrogenic fibroblast marker genes with pulmonary fibrosis and disease progression.
(A) Normalized TPM expression of normal lipofibroblast (cluster 0), injured lipofibroblast (cluster 6), and myofibroblast (cluster 9) markers in bleomycin-induced pulmonary fibrosis bulk lung transcriptomic data from the Mouse Lung Fibrosis Atlas. (B) Normal lipofibroblast and myofibroblast marker genes in the gene coexpression network from the Mouse Lung Fibrosis Atlas.
Figure 9
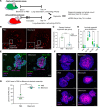
Figure 9. Alveolosphere culture reveals morphological differences in organoids derived from fibrogenic Pdgfra+ fibroblasts versus normal fibroblasts.
(A) Diagram of experimental workflow. (B) Representative epifluorescence images of alveolospheres on day 14 of culture (PBS on the left and bleomycin on the right). Scale bars: 500 μm. Insets show luminal organoid (PBS) and solid organoid (bleomycin) morphology. Scale bars: 250 μm. (C) Measurement of percentage luminal organoids per treatment group. (D) Luminal organoid size distribution per treatment group. Organoid morphology and size distribution were measured from a total of 9 individual cultures per treatment. Data shown here are representative of 2 independent experiments. (E) Whole-mount staining and confocal imaging showing localization of SFTPC (marks AEC2s) and HOPX (marks AEC1s) in alveolospheres derived from PBS-derived (left panel) and bleomycin-derived (right panel) Pdgfra+ fibroblasts. Scale bar: 50 μm. (F) Representative luminal (PBS) and condensed (bleomycin) organoids stained for HOPX and with DAPI used for determination of percentage HOPX area between cluster morphologies (total of 3 organoids measured per group). Scale bars: 50 μm. (G) Percentage HOPX+ area between PBS-treated (normal) and bleomycin-treated (fibrogenic) fibroblast–supported alveolospheres. *P < 0.05; **P < 0.001; ****P < 0.0001 by 2-tailed Student’s t test (C and G) or 2-way ANOVA with Šidák’s correction for multiple comparisons (D).
Figure 10
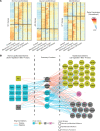
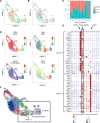
Figure 10. Transcriptomic analysis of epithelial cells in alveolosphere cultures grown from normal and fibrogenic Pdgfra+ fibroblasts revealed a fibrogenesis-specific AEC2 transitional population.
(A) UMAP of 12 individual clusters of organoid-derived epithelial cells. (B) UMAP showing split distribution between PBS (normal) and bleomycin (fibrogenic) cultures. (C) Cell proportions between treatment groups. (D) Scatter plots showing cluster localization of AEC2 (Sftpc), AEC1 (Hopx), proliferating alveolar epithelial cells (Top2a), and PATS (pre-alveolar type 1 transitional state; Krt19). (E) Dot plot of PATS and AEC1 marker genes. Open box highlights bleomycin-specific cluster 10 with shared PATS and AEC2 markers (“Fibro-PATS”). (F) RNA velocity plot: open box highlights clusters 8 (AEC1), 10 (Fibro-PATS), and 3 (PATS).
Figure 11
Figure 11. Graphical illustration of the effect of normal and fibrogenic Pdgfra+ fibroblasts on AEC2 self-renewal and differentiation.
Top: AEC2s combined with control Pdgfra+ fibroblasts result in normal AEC2 self-renewal and AEC1 differentiation. Normal PATS (Hopx) are positioned early in the PATS transitional pathway, and luminal organoids develop. Bottom: AEC2s combined with fibrogenic Pdgfra+ fibroblasts undergo perturbed self-renewal. Fibro-PATS occur in later stages of the transitional PATS pathway, resulting in a combination of mature AEC1 (Hopx+) and hybrid PATS-AEC1 (Hopx+) that form in the densely compacted organoid interior.

References

    1. Wuyts WA, et al. The pathogenesis of pulmonary fibrosis: a moving target. Eur Respir J. 2013;41(5):1207–1218. doi: 10.1183/09031936.00073012. - DOI - PubMed
    1. Barkauskas CE, Noble PW. Cellular mechanisms of tissue fibrosis. 7. New insights into the cellular mechanisms of pulmonary fibrosis. Am J Physiol Cell Physiol. 2014;306(11):C987–C996. doi: 10.1152/ajpcell.00321.2013. - DOI - PMC - PubMed
    1. Noble PW, et al. Pulmonary fibrosis: patterns and perpetrators. J Clin Invest. 2012;122(8):2756–2762. doi: 10.1172/JCI60323. - DOI - PMC - PubMed
    1. Herrera J, et al. Extracellular matrix as a driver of progressive fibrosis. J Clin Invest. 2018;128(1):45–53. doi: 10.1172/JCI93557. - DOI - PMC - PubMed
    1. Kendall RT, Feghali-Bostwick CA. Fibroblasts in fibrosis: novel roles and mediators. Front Pharmacol. 2014;5:123. doi: 10.3389/fphar.2014.00123. - DOI - PMC - PubMed

Publication types

MeSH terms

Substances