. 2023 Nov;10(32):e2301977.
doi: 10.1002/advs.202301977. Epub 2023 Oct 12.

Loss of ATOH1 in Pit Cell Drives Stemness and Progression of Gastric Adenocarcinoma by Activating AKT/mTOR Signaling through GAS1

Affiliations

Loss of ATOH1 in Pit Cell Drives Stemness and Progression of Gastric Adenocarcinoma by Activating AKT/mTOR Signaling through GAS1

Qing Zhong et al. Adv Sci (Weinh). 2023 Nov.

Abstract

Gastric cancer stem cells (GCSCs) are self-renewing tumor cells that govern chemoresistance in gastric adenocarcinoma (GAC), whereas their regulatory mechanisms remain elusive. Here, the study aims to elucidate the role of ATOH1 in the maintenance of GCSCs. The preclinical model and GAC sample analysis indicate that ATOH1 deficiency is correlated with poor GAC prognosis and chemoresistance. ScRNA-seq reveals that ATOH1 is downregulated in the pit cells of GAC compared with those in paracarcinoma samples. Lineage tracing reveals that Atoh1 deletion strongly confers pit cell stemness. ATOH1 depletion significantly accelerates cancer stemness and chemoresistance in Tff1-CreERT2; Rosa26Tdtomato and Tff1-CreERT2; Apcfl/fl ; p53fl/fl (TcPP) mouse models and organoids. ATOH1 deficiency downregulates growth arrest-specific protein 1 (GAS1) by suppressing GAS1 promoter transcription. GAS1 forms a complex with RET, which inhibits Tyr1062 phosphorylation, and consequently activates the RET/AKT/mTOR signaling pathway by ATOH1 deficiency. Combining chemotherapy with drugs targeting AKT/mTOR signaling can overcome ATOH1 deficiency-induced chemoresistance. Moreover, it is confirmed that abnormal DNA hypermethylation induces ATOH1 deficiency. Taken together, the results demonstrate that ATOH1 loss promotes cancer stemness through the ATOH1/GAS1/RET/AKT/mTOR signaling pathway in GAC, thus providing a potential therapeutic strategy for AKT/mTOR inhibitors in GAC patients with ATOH1 deficiency.

Keywords: ATOH1; GAS1; gastric adenocarcinoma; mouse model; stemness.


Conflict of interest statement

The authors declare no conflict of interest.

Figures
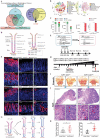
Figure 1
Figure 1
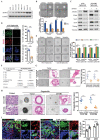
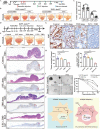
ATOH1 loss increases spontaneous tumorigenesis in a mouse model. A) Flowchart showing a screening of candidate genes orchestrating human GAC stemness. Venn diagram (left) showing overlap of downregulated genes in human GAC compared with corresponding adjacent non‐tumor tissues from FJMUUH, QHPH, and FHUSTC cohorts. Venn diagram (right) showing overlap of downregulated genes in GAC versus adjacent non‐tumor tissues and chemoresistant versus chemosensitive tumors. B) scRNA‐seq analysis of integrated cells isolated from eight GAC samples and eleven paracarcinoma samples based on notable cell type markers (Carcinoma cohort: n = 8, Paracarcinoma cohort: n = 11). C) Histogram indicating ATOH1 downregulation in TFF1 + pit cells isolated from GAC samples compared to paracarcinoma samples. D) Schematic diagram of Tff1 and Atoh1 expression in mouse stomach. E) Schematic diagram of Tff1‐CreERT2; Atoh1fl/fl; Rosa26Tdtomato mouse generation. F) Representative images of Tff1‐CreERT2; Atoh1fl/fl; Rosa26Tdtomato , and Tff1‐CreERT2; Rosa26Tdtomato mouse lineage tracing at 7, 30, and 120 dpi (scale bars = 100 µm). G) Working model for roles of Atoh1 in gastric epithelium maintenance. H) Experimental design for tamoxifen administration and analysis. I) Representative macroscopic views of stomachs of Tff1‐CreERT2; Apcfl/fl; p53fl/fl; Atoh1fl/+ (TcPP; Atoh1fl/+ ) and Tff1‐CreERT2; Apcfl/fl; p53fl/fl; Atoh1fl/fl (TcPP; Atoh1fl/fl ) mice collected 90 days after tamoxifen administration. Tumors are indicated by red arrows (scale bars = 1 cm). J) Representative H&E staining of stomachs of TcPP; Atoh1fl/+ and TcPP; Atoh1fl/fl mice collected 90 days after tamoxifen administration (scale bars = 100 µm). K) Total numbers (left) and areas (right) of mouse tumors harvested from TcPP; Atoh1fl/+ and TcPP; Atoh1fl/fl mice (n = 10 per cohort) at 90 days after tamoxifen administration. Data are represented as the mean ± SD and analyzed by Student's t‐test. *P <0.05, ***P <0.001 for groups connected by horizontal lines. Data with p‐value < 0.05 were considered statistically significant.
Figure 2
Figure 2
ATOH1 expression is correlated with CSC phenotype in GAC cells. A) Western blot of ATOH1 in immortalized gastric epithelial cells and GAC cell panel. B) Spheroid formation by AGS and NCI‐N87 cells transfected with ATOH1 or vector (scale bars = 50 µm, n = 5). C) Western blot of CSC and self‐renewal markers in AGS and NCI‐N87 spheroids transfected with ATOH1 or vector. D) Quantification and immunofluorescence images of CD44 and SOX2 in AGS spheroids transfected with ATOH1 or vector (scale bars = 50 µm). E) Spheroid formation transfected with shATOH1 or shNC (scale bars = 50 µm, n = 5). F) AGS cells with or without ATOH1 overexpression were serially diluted and subcutaneously xenografted into BALB/c nude mice. Number of cells injected and tumor formation frequency on day 28 are shown. G) Effects of ATOH1 overexpression on MNU mouse‐derived tumor organoid growth. Organoids were quantified and their sizes were determined by H&E staining (scale bars = 100 µm, n = 10). H) Effects of ATOH1 overexpression on patient‐derived GAC organoid growth. Organoids were quantified and their sizes were determined by H&E staining (scale bars = 100 µm, n = 10). I) Representative immunofluorescence images and quantification of CD44 + and SOX2 + cells among gastric epithelial cells of indicated mice at 90 days after tamoxifen administration (scale bars = 100 µm, n = 5). Data are represented as the mean ± SD and analyzed by Student's t‐test. **P<0.01, ***P <0.001 for groups connected by horizontal lines. P‐values < 0.05 were considered statistically significant.
Figure 3
Figure 3
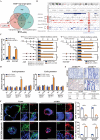
ATOH1 upregulates GAS1 in GAC. A) Venn diagram showing DEG overlap between RNA‐Seq and ChIP‐Seq. B) Peak signals from ChIP‐Seq indicate that ATOH1 directly binds the GAS1 promoter region. C) ATOH1 transactivates the GAS1 promoter. GAS1 promoter construct was co‐transfected into cells via pCMV‐ATOH1. Relative luciferase activity was detected by luciferase reporter assay. Serial deletion and selective mutation analyses identified ATOH1‐responsive regions in GAS1 promoter and relative luciferase activity were determined (n = 3). D) ChIP assay demonstrating direct binding of ATOH1 to GAS1 promoter in GAC cells (n = 3). E) IHC staining of ATOH1 and GAS1 in 379 GAC samples using tissue microarray (TMA) from FJMUUH. Correlations were analyzed by Chi‐square test (scale bars = 50 µm). F) Effects of ATOH1 overexpression on GAS1 and CD44 expression in H‐GC096 and H‐GC108 patient‐derived GAC organoids. CD44 + and GAS1 + cells were quantified as means ± SD of five independent fields (scale bars = 100 µm). Data are represented as the mean ± SD and analyzed by Student's t‐test. **P <0.01, ***P <0.001 for groups connected by horizontal lines. p‐values < 0.05 were considered statistically significant.
Figure 4
Figure 4
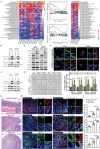
ATOH1 regulates RET/AKT/mTOR signaling in human GAC cells. A) Gene set enrichment analysis (GSEA) was performed by comparing high and low ATOH1 expression groups in TCGA, GEO, and FJMUUH human and GEO mouse GAC cohorts. Hallmark gene sets were downloaded from https://www.gsea‐msigdb.org/. B) Co‐immunoprecipitation (Co‐IP) of GAS1 with anti‐Flag in AGS and NCI‐N87 cells identified RET as GAS1 binding partner. C) Reciprocal Co‐IP confirmed protein interaction between GAS1 and RET in AGS and NCI‐N87 cells. D) Western blot of ATOH1, GAS1, and RET/AKT/mTOR pathway members was performed on AGS and NCI‐N87 spheroids transfected with ATOH1. E) Representative immunofluorescence images of GAS1, p‐RET, p‐AKT, and p‐mTOR staining in patient‐derived tumor organoids (scale bars = 100 µm). F) Spheroid formation was detected in SNU‐5 and Kato‐III cells transfected with shATOH1 subjected to AKT/mTOR inhibitor thioridazine hydrochloride (THO; 10 µm) (scale bars = 50 µm, n = 5). G) Representative H&E staining of stomachs of Apcfl/fl; p53fl/fl; Atoh1fl/fl , TcPP; Atoh1fl/+ , and TcPP; Atoh1 fl/fl mice at 90 days after tamoxifen administration (scale bars = 100 µm). H) ATOH1, p‐RET, p‐AKT, and p‐mTOR expression in stomachs of Apcfl/fl; p53fl/fl; Atoh1fl/fl , TcPP; Atoh1 fl/+ , and TcPP; Atoh1 fl/fl mice at 90 days after tamoxifen administration (scale bars = 100 µm). I) Quantification of p‐RET +, p‐AKT +, and p‐mTOR + cells in (H), n = 5. Data are represented as the mean ± SD and analyzed by Student's t‐test. **P <0.01, ***P <0.001 for groups connected by horizontal lines. p‐values < 0.05 were considered statistically significant.
Figure 5
Figure 5
ATOH1 promoter is hypermethylated in GAC. A) Schematic representation of CpG islands and bisulfite sequencing region in ATOH1 promoter. Magenta font: CG sites for bisulfite sequencing; bold magenta font: most significantly altered CG site in ATOH1; red region: input sequence; blue region: CpG islands; black curve: trend of GAC base % content; BSP F1 and R1: bisulfite forward and reverse primer, respectively. B) Bisulfite sequencing analysis of ATOH1 promoter region (−1,407 to −1,256 bp) and average methylation levels in adjacent non‐tumor (n = 6) and GAC (n = 6) tissues. C) Methylation levels of ATOH1 promoter region in GES cells and GAC cell panel. D) AGS and NCI‐N87 cells were treated with 5‐AzaC at indicated concentrations for 48 h and ATOH1 expression was measured by western blot. E) AGS and NCI‐N87 cells were treated with 1uM of 5‐AzaC for 48 h and ATOH1 expression was measured by qRT‐PCR (n = 3). F) AGS and NCI‐N87 cells were transfected with DNMT siRNA for 48 h and ATOH1 mRNA expression was measured by qRT‐PCR (n = 3). G) AGS and NCI‐N87 cells were transfected with DNMT1 siRNA for 48 h and ATOH1 expression was measured by western blot. H) GAC cells were transfected with pCMV‐DNMT1 and ATOH1 mRNA expression was measured by qRT‐PCR. I) AGS and NCI‐N87 cells were transfected with pCMV‐DNMT1 and ATOH1 expression was measured by western blot (n = 3). J) DNMT1 expression vector and ATOH1 wild‐type promoter constructs or promoter constructs containing site‐specific CpG mutations were co‐transfected into SNU‐5 and Kato‐III cells. Activity levels of ATOH1 promoter constructs containing different mutations were measured by luciferase assay. Point mutations (CG to TG) were created at CpG sites located at −1,362 and −1,341 bp (n = 3). K) ATOH1, GAS1, and RET/AKT/mTOR expression were measured by western blot in AGS and NCI‐N87 cells treated with 1 µm of 5‐AzaC. L) Spheroid formation was detected in SNU‐5 and Kato‐III cells transfected with shATOH1 subjected to 1 µm of 5‐AzaC (scale bars = 50 µm). Data are represented as the mean ± SD and analyzed by Student's t‐test. **P <0.01, ***P <0.001 for groups connected by horizontal lines. p‐values < 0.05 were considered statistically significant.
Figure 6
Figure 6
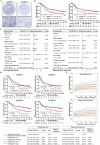
ATOH1 expression in tumors is correlated with GAC patient prognosis. A) ATOH1 expression in 379 paraffin‐embedded specimens of TMA from the FJMUUH cohort was determined by TMA‐based IHC staining (scale bars = 100 µm). B) Overall survival and disease‐free survival curves of GAC patients with low versus high ATOH1 expression (n = 379, ATOH1 Low = 179, ATOH1 High = 200). C) Multivariable Cox analysis of prognostic factors for GAC patients (n = 379). D) Subgroup analyses of OS and DFS among GAC patients with low versus high ATOH1 expression who received adjuvant chemotherapy or not. E) Time‐dependent receiver operating characteristic (ROC) curves comparing prognostic accuracy of ATOH1 with pathological prognostic factors for GAC patients. Harrell's concordance index (C‐index) and Akaike information criteria (AIC) for prognostic factors were calculated and compared against those for the combination of ATOH1 and pathological risk factors. The probability of differences in OS and DFS was ascertained by the Kaplan–Meier method with the log‐rank test.
Figure 7
Figure 7
ATOH1 controls chemoresistance in the GAC model. A) Injection timeline for tamoxifen‐induced TcPP; Atoh1fl/+ and TcPP; Atoh1fl/fl mice. B) Macroscopic view of stomachs of control and 5‐FU treated mice (n = 10 per group) collected 90 days after tamoxifen administration. Tumors are marked by solid lines (scale bars = 1 cm). C) Total area (m2) of mouse tumors harvested from untreated and 5‐FU treated mice (n = 10 per group). D) Timelines for 5‐FU#, THO##, and 5‐FU+THO### injections in tamoxifen‐induced TcPP; Atoh1 fl/fl mice. #50 mg k−1g BW 5‐FU weekly for 4 weeks. ##10 mg k−1g BW THO twice weekly for 4 weeks. ###5‐FU 50 mg k−1g BW 5‐FU weekly for 4 weeks plus 10 mg k−1g BW THO twice weekly for 4 weeks. E) Macroscopic views of stomachs of control (PBS), 5‐FU‐, THO‐, and 5‐FU+THO‐treated mice (n = 5 per group). Tumors are marked by solid lines (scale bars = 1 cm). F) H&E (top) and Ki67 (bottom) expression in control, 5‐FU‐, THO‐, and 5‐FU+THO‐treated mice (scale bars = 500 µm). G) Representative images of Ki67 expression in control, 5‐FU‐, THO‐, and 5‐FU+THO‐treated mice (scale bars = 50 µm). H) Quantification of tumor volume reduction and enumeration of proliferating cells (Ki67+) after 5‐FU, THO, or 5‐FU+THO treatment. I) Sensitivity of H‐GC096 and H‐GC108 patient‐derived organoids to 5‐FU after ATOH1 overexpression (scale bars = 100 µm). J) Proposed molecular mechanism of ATOH1 in GAC. Data are represented as the mean ± SD and analyzed by Student's t‐test. NS, no significance, *P <0.05, **P <0.01, ***P <0.001 for groups connected by horizontal lines. p‐values < 0.05 were considered statistically significant.

References

    1. Sung H., Ferlay J., Siegel R. L., Laversanne M., Soerjomataram I., Jemal A., Bray F., Ca‐Cancer J. Clin. 2021, 71, 209. - PubMed
    1. Joshi S. S., Badgwell B. D., CA: Cancer J. Clin. 2021, 71, 264. - PMC - PubMed
    1. Tan S. H., Swathi Y., Tan S., Goh J., Seishima R., Murakami K., Oshima M., Tsuji T., Phuah P., Tan L. T., Wong E., Fatehullah A., Sheng T., Ho S. W. T., Grabsch H. I., Srivastava S., Teh M., Denil S. L. I. J., Mustafah S., Tan P., Shabbir A., So J., Yeoh K. G., Barker N., Nature 2020, 578, 437. - PubMed
    1. a) Bayik D., Lathia J. D., Nat. Rev. Cancer 2021, 21, 526; - PMC - PubMed
    2. b) Batlle E., Clevers H., Nat. Med. 2017, 23, 1124; - PubMed
    3. c) Nassar D., Blanpain C., Annu. Rev. Pathol. 2016, 11, 47. - PubMed
    4. d) Najafi M., Mortezaee K., Majidpoor J., Life Sci. 2019, 234, 116781. - PubMed
    1. Cho Y. H., Ro E. J., Yoon J. S., Mizutani T., Kang D. W., Park J. C., Il Kim T., Clevers H., Choi K. Y., Nat. Commun. 2020, 11, 5321. - PMC - PubMed

Publication types

MeSH terms