. 2023 Oct 31;42(10):113232.
doi: 10.1016/j.celrep.2023.113232. Epub 2023 Oct 11.

Essential role of Mg2+ in mouse preimplantation embryo development revealed by TRPM7 chanzyme-deficient gametes

Affiliations

Essential role of Mg2+ in mouse preimplantation embryo development revealed by TRPM7 chanzyme-deficient gametes

Neha Gupta et al. Cell Rep. .

Abstract

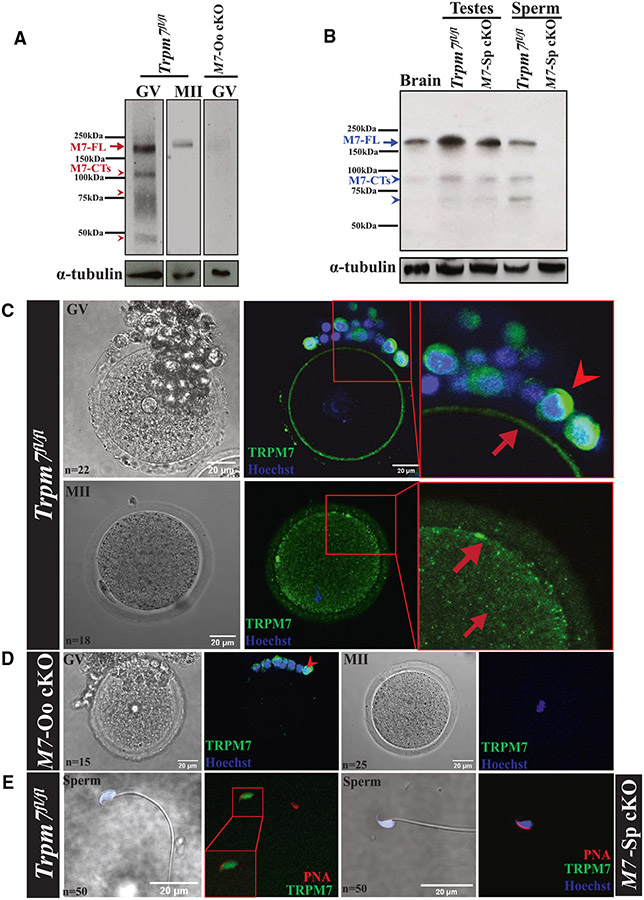
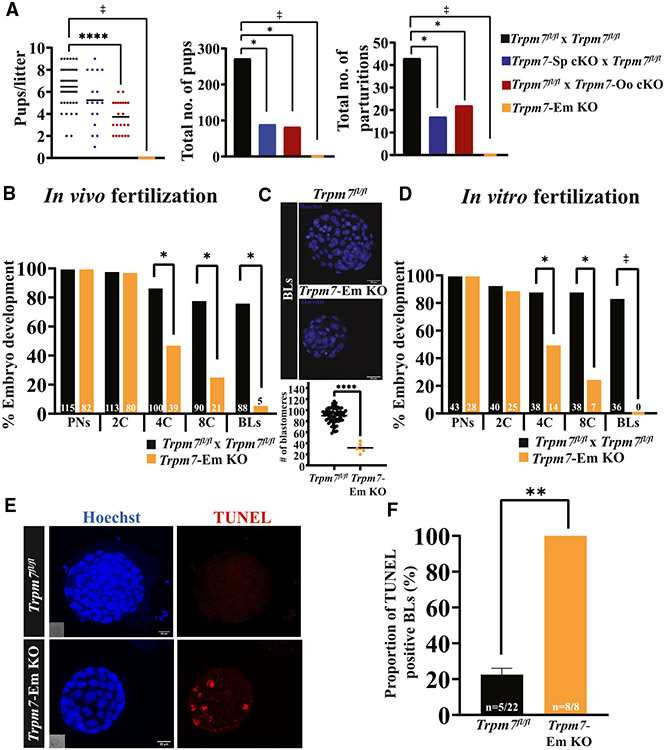
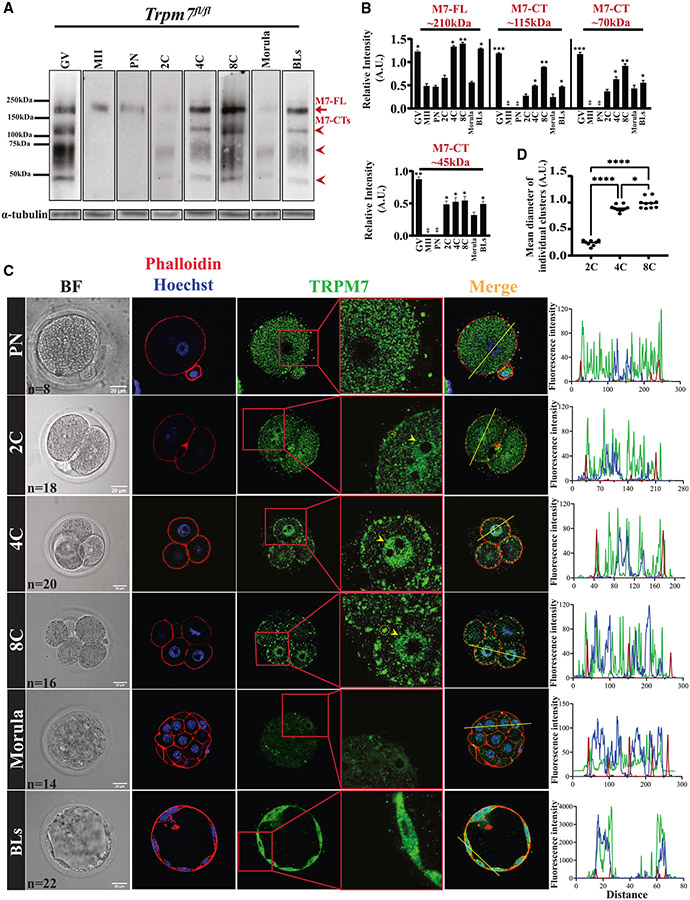
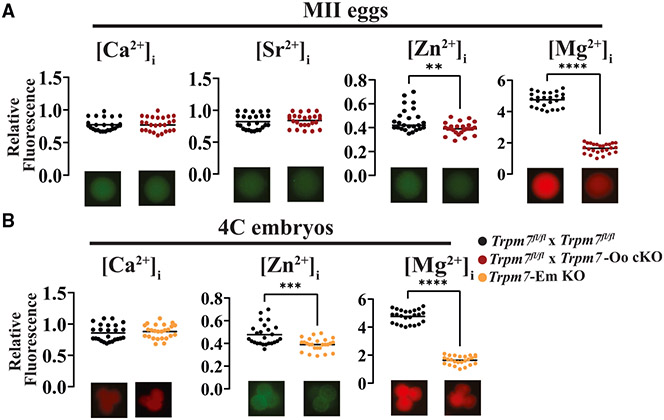
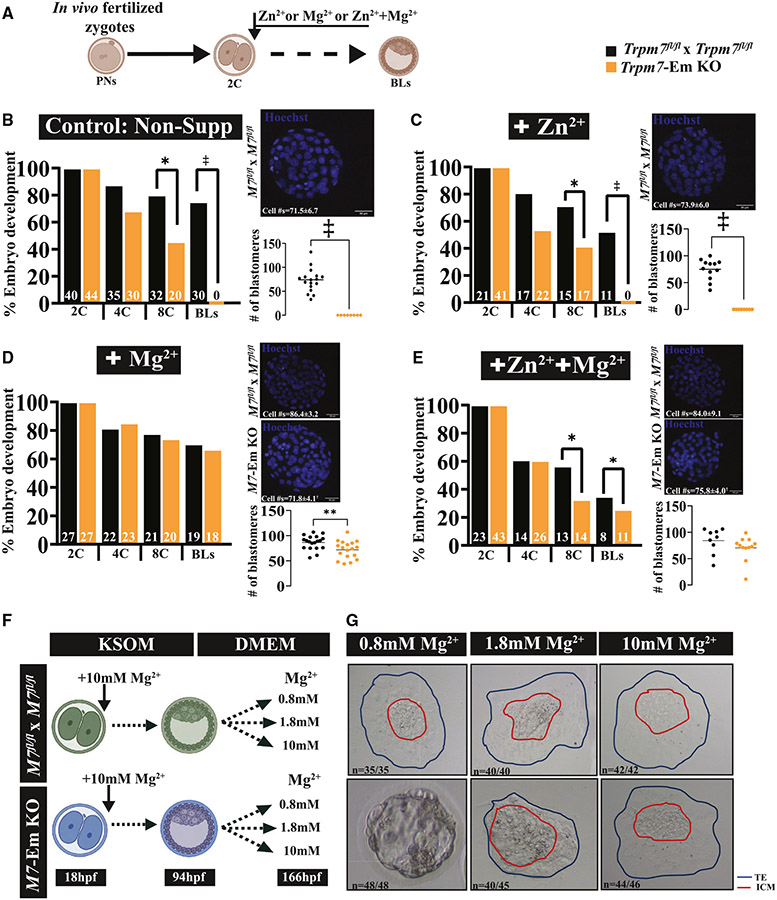
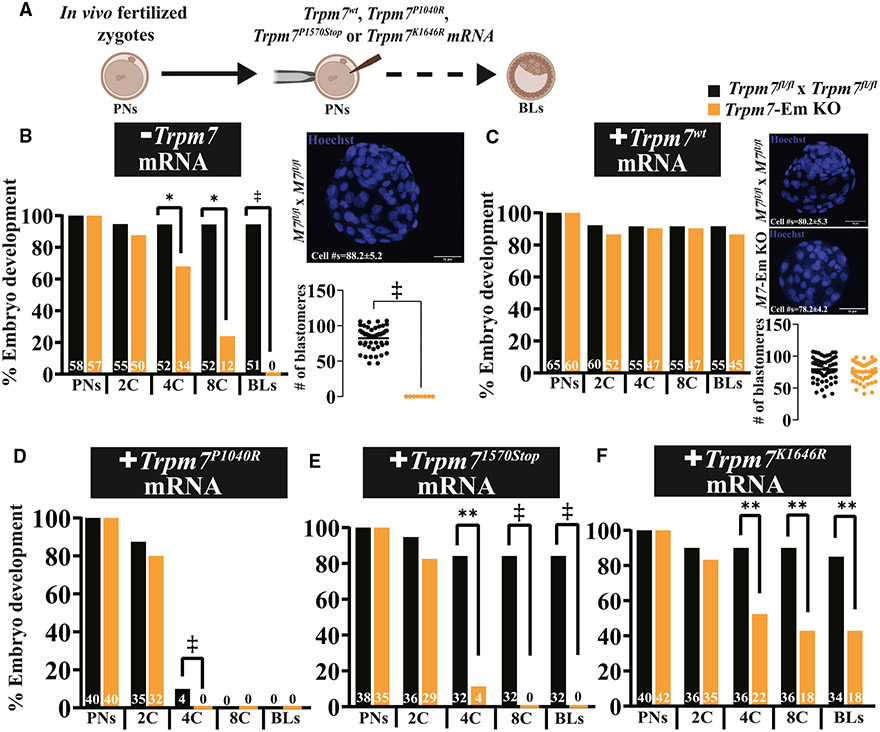
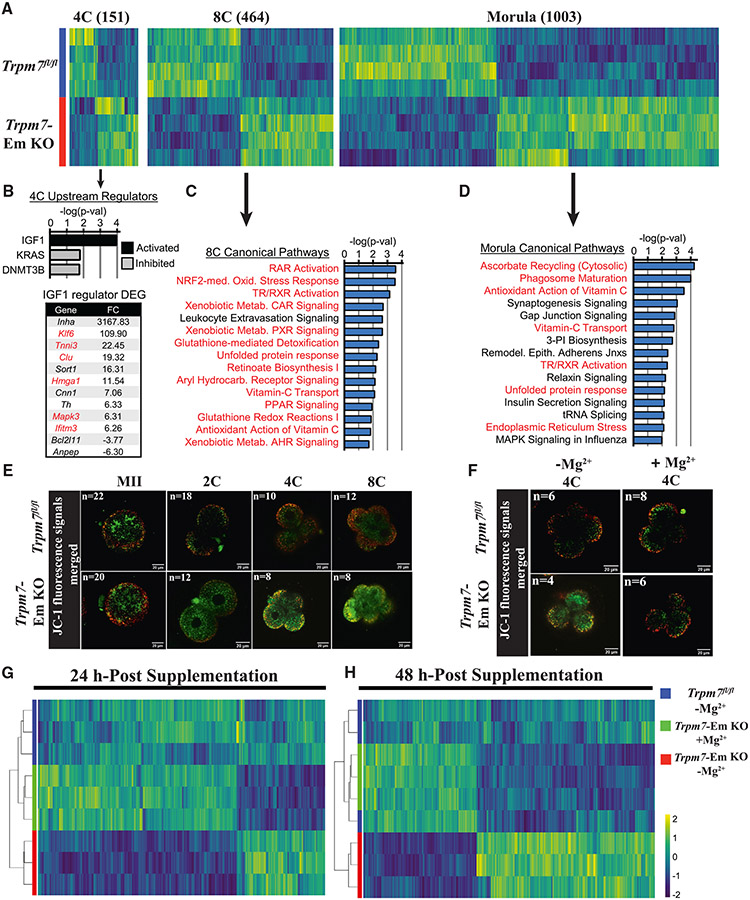
TRPM7 (transient receptor potential cation channel subfamily M member 7) is a chanzyme with channel and kinase domains essential for embryo development. Using gamete-specific Trpm7-null lines, we report that TRPM7-mediated Mg2+ influx is indispensable for reaching the blastocyst stage. TRPM7 is expressed dynamically from gametes to blastocysts; displays stage-specific localization on the plasma membrane, cytoplasm, and nucleus; and undergoes cleavage that produces C-terminal kinase fragments. TRPM7 underpins Mg2+ homeostasis, and excess Mg2+ but not Zn2+ or Ca2+ overcomes the arrest of Trpm7-null embryos; expressing Trpm7 mRNA restores development, but mutant versions fail or are partially rescued. Transcriptomic analyses of Trpm7-null embryos reveal an abundance of oxidative stress-pathway genes, confirmed by mitochondrial dysfunction, and a reduction in transcription factor networks essential for proliferation; Mg2+ supplementation corrects these defects. Hence, TRPM7 underpins Mg2+ homeostasis in preimplantation embryos, prevents oxidative stress, and promotes gene expression patterns necessary for developmental progression and cell-lineage specification.

Keywords: ART; CP: Cell biology; CP: Developmental biology; Ca(2+) oscillations; Zn(2+); eggs; fertilization; mammals; nuclear localization; oocytes; oxidative stress; sperm.


Conflict of interest statement

Declaration of interests The authors declare no competing interests.

Figures

Figure 1.
Figure 1.. Mouse gametes express TRPM7, and Trpm7 conditional deletion prevents it
(A) Images of western blots (WBs) of GVs and MIIs denoting expression of full-length TRPM7, M7-FL (red arrow), in Trpm7fl/fl oocytes and eggs and lack of it in the adjacent lane in GVs of Trpm7-Oo cKO (M7-Oo cKO) females. M7-CTs (red arrowheads) below correspond to C-terminal fragments of the chanzyme. The images below the TRPM7 blots correspond to α-tubulin and were used to normalize TRPM7 expression here and elsewhere. (B) WB of brain tissue, testes, and sperm extracts from Trpm7fl/fl and Trpm7-Sp cKO (M7-Sp cKO) lines showing TRPM7-FL reactivity (blue arrow) and lack of it in the cKO sperm line (rightmost lane). Tissues and sperm also contain M7-CTs (blue arrowheads). (C–E) Bright-field (left column) and immunofluorescence (IF) images of TRPM7 in oocytes and eggs of Trpm7fl/fl and M7-Oo cKO lines (C and D, respectively) and sperm (E) from Trpm7fl/fl and M7-Sp cKO lines (two left and right images, respectively). TRPM7 reactivity is in green, DNA in blue, and PNA in red, marking the acrosome. Square red insets in the upper two rows, center, are enlarged on the right; red arrows denote the TRPM7 position in oocytes/eggs and arrowheads in granulosa cells. (D) and (E) show the absence of TRPM7 reactivity in M7-Oo cKO oocytes and eggs and M7-Sp cKO sperm, respectively. The white scale bars represent distance in micrometers here and for the rest of the study; n represents the number of observations here and elsewhere.
Figure 2.
Figure 2.. Trpm7 is a requisite for fertility and preimplantation embryo development
(A) A dot plot and bar graphs depicting the mating outcomes between crosses of Trpm7fl/fl mice and breeder lines expressing gamete-specific Cres. Six pairs per group were observed for 6 months, and the numbers of litters, pups, and pups/litter were recorded and statistically compared. Differences between groups were assessed by ANOVA followed by Tukey’s post hoc test. Asterisks (*) above columns indicate significance between columns/groups here and elsewhere (*p < 0.05; ****p < 0.0001). (B–D) Rates of preimplantation development of Trpm7fl/fl and Trpm7-Em KO zygotes collected after in vivo mating (B) or in vitro fertilization (D) and cultured in vitro. Bar graphs illustrate the embryo stages examined during culture. Data are percentage of embryos reaching each successive stage from PN to BL and the precise numbers noted in the columns. The number of zygotes was the reference (100%). (C) BLs were stained with Hoechst, and nuclei were counted to estimate the number of blastomeres per BL (*p < 0.05). (E) The TUNEL assay was used to determine the presence of apoptotic cells in BLs from Trpm7fl/fl and Trpm7-Em KO zygotes (red internal fluorescence, right lower image). (F) Bar graph depicts the proportion of apoptotic BLs in Trpm7fl/fl vs. Trpm7-Em KO zygotes. Student’s t test was applied for comparisons (**p < 0.01). The ‡ symbol denotes crosses that did not produce offspring or BLs here and elsewhere in the article.
Figure 3.
Figure 3.. TRPM7 displays stage-specific expression and distinct distributions in preimplantation embryos
(A) WB of TRPM7 reactivity in oocytes, eggs, and preimplantation embryos (n = 50). The red arrow denotes the full-length protein, M7-FL, and the arrowheads denote the three most abundant C-terminal fragments. α-tubulin reactivity is shown below each lane and was used to normalize TRPM7 quantifications. (B) The relative intensities of M7-FL and M7-CTs between oocytes, eggs, and embryos were quantified from three replicates, statistically compared, and represented by bar graphs. Columns without asterisks are stages with lower and statistically significant expression compared with those with asterisks (*p < 0.05, **p < 0.01, or ***p < 0.001), whereas for the bars with asterisks, a different number of asterisks indicates a difference between groups (*p < 0.05 or **p < 0.01). (C) Bright-field (left column) and IF images of PN, 2C, 4C, 8C, morula, and BL stage embryos (remaining columns) displaying actin distribution by phalloidin labeling (red) and nuclear DNA by Hoechst staining (blue) (second column) and TRPM7 distribution (green; three rightmost columns).A yellow trace in the Merge column denotes the line where the fluorescence was estimated for the three probes. On the right, the line plots display the intensity of the fluorescent signals across the embryos. The number (n) of cells and embryos examined per stage is indicated in the bright-field images, and the white bars represent distance in micrometers. (D) Comparison of the sizes of the TRPM7 PM clusters observed in the 2C, 4C, and 8C stage embryos (*p < 0.05, ****p < 0.0001). Comparisons were carried out using ANOVA followed by Tukey’s post hoc tests.
Figure 4.
Figure 4.. TRPM7 is essential for divalent cation homeostasis in eggs and early embryos
(A) Dot plots displaying normalized intracellular concentrations of the divalent cations Ca2+, Sr2+, Zn2+, and Mg2+ (left to right, respectively) in MII eggs from Trpm7fl/fl (black) and Trpm7-Oo cKO (red) lines (**p < 0.01; ****p < 0.0001). (B) Dot plots displaying normalized intracellular concentrations of divalent cations in 4C stage embryos; from left to right, Ca2+, Zn2+, and Mg2+ from Trpm7fl/fl and Trpm7-Em KO lines. Representative images are shown below the dot plots to depict differences in fluorescence intensities. Data were compared from at least three experiments using Student’s t test (***p < 0.001, ****p < 0.0001).
Figure 5.
Figure 5.. Mg2+ supplementation rescues Trpm7-Em KO preimplantation embryo development
(A) Schematic of Mg2+ supplementation strategy. The extra divalent cations were added at the 2C stage and remained throughout the culture period. (B–E) Bar graphs depicting rates of in vitro preimplantation development of zygotes from Trpm7fl/fl and Trpm7-Em KO mice in unsupplemented medium (B) or medium supplemented with Zn2+ (C), Mg2+ (D), or both ions (E). Representative images of BLs stained with Hoechst and BL cell number means in dot charts are displayed for each condition to the right of the graphs. (F) Schematic of outgrowth assay strategy. Trpm7fl/fl and Trpm7-Em KO embryos were cultured to the BL stage (94 h post-fertilization [hpf]) in KSOM supplemented with 10 mM Mg2+. After this time, BLs from both groups were transferred to DMEM containing 0.8, 1.8, or 10 mM Mg2+ and cultured until 166 hpf. (G) Representative images of expanded BLs with different concentrations of Mg2+ in control and M7-Em KOs. Statistical comparisons were performed using Student’s t test (p > 0.05 or *p < 0.05). The ‡ symbol denotes groups that did not produce BLs and were not statistically compared.
Figure 6.
Figure 6.. TRPM7wt mRNA rescues Trpm7-Em KO embryo development, but mutant versions are not as effective
(A) Schematic of the Trpm7 mRNA rescue strategy. mRNA injections were always performed into Trpm7-Em KO zygotes, after which they were cultured in medium not supplemented with Mg2+. (B–F) Bar graphs depicting rates of preimplantation embryo development of Trpm7fl/fl and Trpm7-Em KO uninjected embryos used as controls (*p < 0.05) (B) or embryos injected with Trpm7wt (C), Trpm7P1040R (D), Trpm7K1646R (E), and Trpm71570Stop mRNA (p > 0.05; **p < 0.01). Representative images of BLs stained with Hoechst and cell number quantification are shown to the right of each graph. Statistical comparisons were performed using Student’s t test (p > 0.05). The ‡ symbol denotes groups that did not produce BLs and were not statistically compared.
Figure 7.
Figure 7.. TRPM7 expression prevents oxidative stress in preimplantation embryos by promoting Mg2+influx
(A) Heatmap representation of the comparison of differentially expressed genes (DEGs) identified by RNA-seq in Trpm7fl/fl control embryos relative to Trpm7-Em KO embryos at the four-cell (4C), 8C, and morula stages. The number of DEGs at each stage is indicated in parentheses above each group. (B) Ingenuity pathway analysis (IPA) of upstream regulators predicted as activated or inhibited in 4C embryos; p < 0.05. DEGs present in the IGF1 upstream regulator dataset and fold change (FC) are shown; red font indicates a role in mitochondrial function, inflammation, or oxidative stress. (C and D) IPA of canonical pathways in 8C embryos (C) and morulae (D); the 15 most significant pathways relevant to the two embryo stages are shown. The red font indicates oxidative stress-related pathways. (E and F) Mitochondrial membrane potential as indicated by merged ratio images of JC-1 staining of MII eggs and embryos of the indicated genotypes and cellular stages. Representative images of all embryo stages examined are shown (E). Embryos of both strains were handled as before but supplemented or not with Mg2+ at the 2C stage and cultured to the 4C stage (F). (G and H) Unsupervised hierarchical clustering of DEGs identified by RNA-seq at the indicated time points in Trpm7fl/fl, Trpm7-Em KO, and Trpm7-Em KO embryos cultured with and without added Mg2+.

References

    1. Komiya Y, Mandrekar N, Sato A, Dawid IB, and Habas R (2014). Custos controls β-catenin to regulate head development during vertebrate embryogenesis. Proc. Natl. Acad. Sci. USA 111, 13099–13104. - PMC - PubMed
    1. Krauchunas AR, and Wolfner MF (2013). Molecular changes during egg activation. Curr. Top. Dev. Biol 102, 267–292. - PMC - PubMed
    1. Stein P, Savy V, Williams AM, and Williams CJ (2020). Modulators of calcium signalling at fertilization. Open Biol. 10, 200118. - PMC - PubMed
    1. Wozniak KL, and Carlson AE (2020). Ion channels and signaling pathways used in the fast polyspermy block. Mol. Reprod. Dev 87, 350–357. - PMC - PubMed
    1. Stricker SA (1999). Comparative biology of calcium signaling during fertilization and egg activation in animals. Dev. Biol 211, 157–176. - PubMed

Publication types