. 2023 Oct 12;19(10):e1010480.
doi: 10.1371/journal.pcbi.1010480. eCollection 2023 Oct.

Assessing the performance of methods for cell clustering from single-cell DNA sequencing data

Affiliations

Assessing the performance of methods for cell clustering from single-cell DNA sequencing data

Rituparna Khan et al. PLoS Comput Biol. .

Abstract

Background: Many cancer genomes have been known to contain more than one subclone inside one tumor, the phenomenon of which is called intra-tumor heterogeneity (ITH). Characterizing ITH is essential in designing treatment plans, prognosis as well as the study of cancer progression. Single-cell DNA sequencing (scDNAseq) has been proven effective in deciphering ITH. Cells corresponding to each subclone are supposed to carry a unique set of mutations such as single nucleotide variations (SNV). While there have been many studies on the cancer evolutionary tree reconstruction, not many have been proposed that simply characterize the subclonality without tree reconstruction. While tree reconstruction is important in the study of cancer evolutionary history, typically they are computationally expensive in terms of running time and memory consumption due to the huge search space of the tree structure. On the other hand, subclonality characterization of single cells can be converted into a cell clustering problem, the dimension of which is much smaller, and the turnaround time is much shorter. Despite the existence of a few state-of-the-art cell clustering computational tools for scDNAseq, there lacks a comprehensive and objective comparison under different settings.

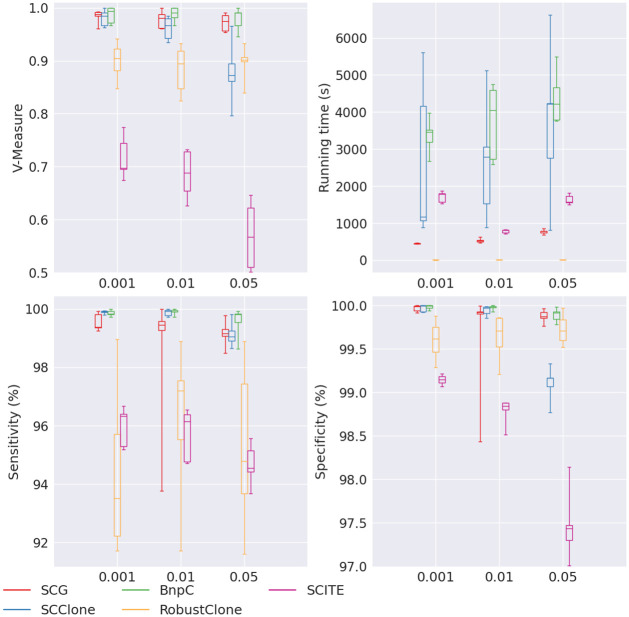
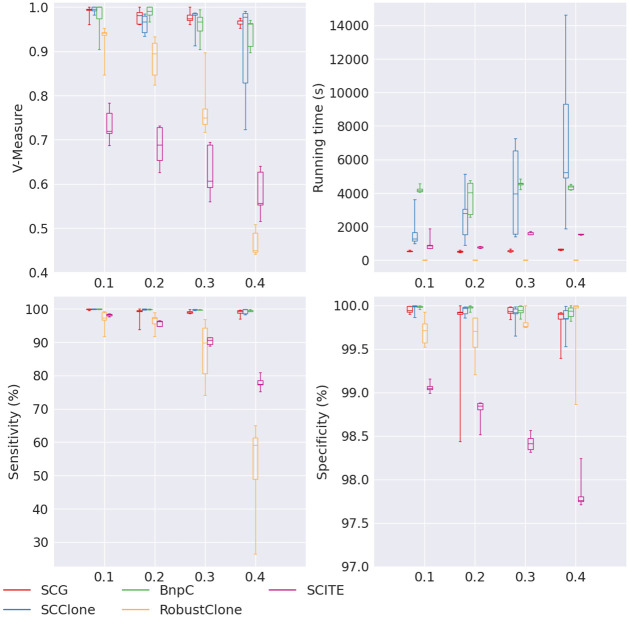
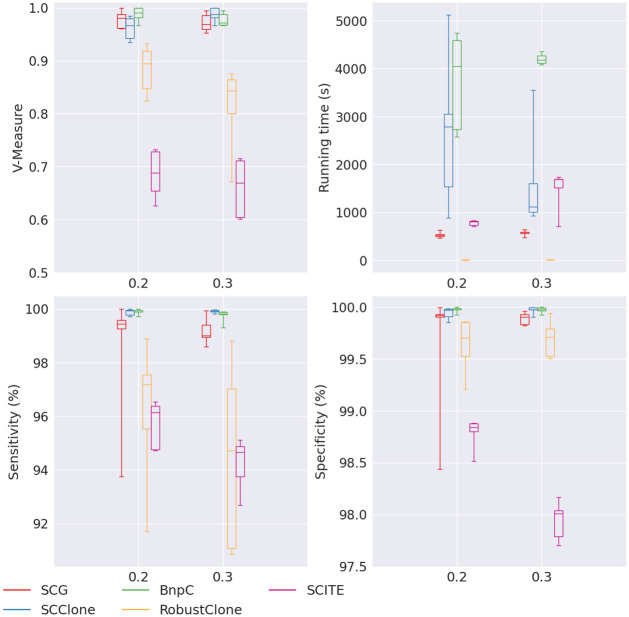
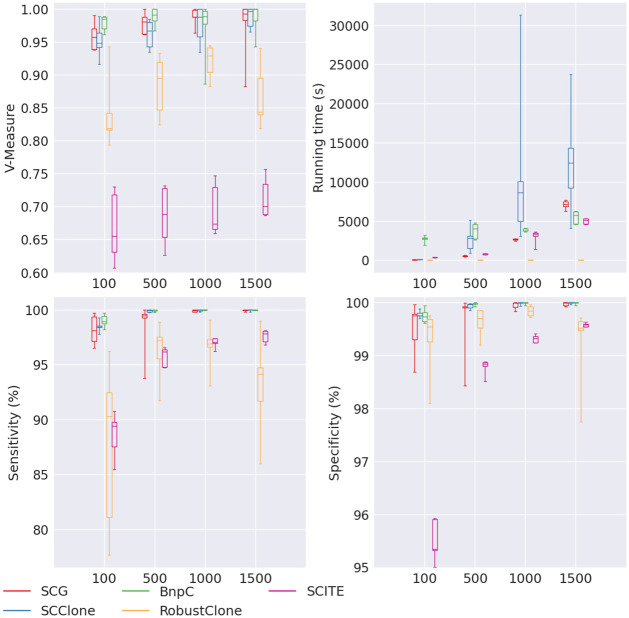
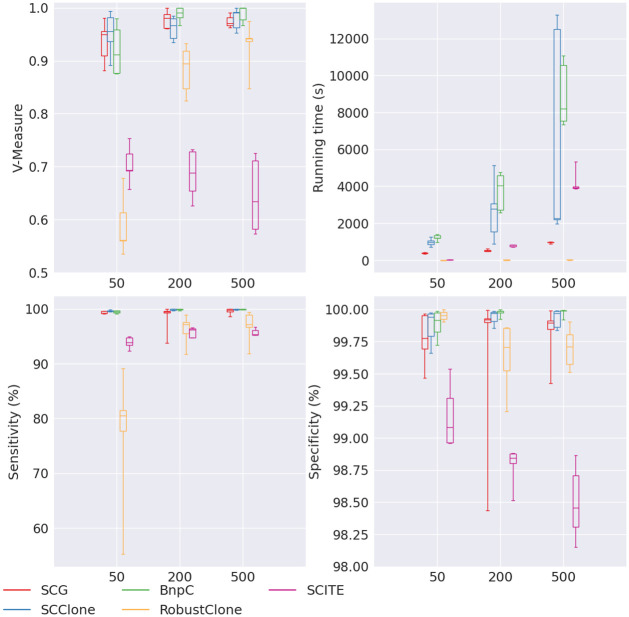
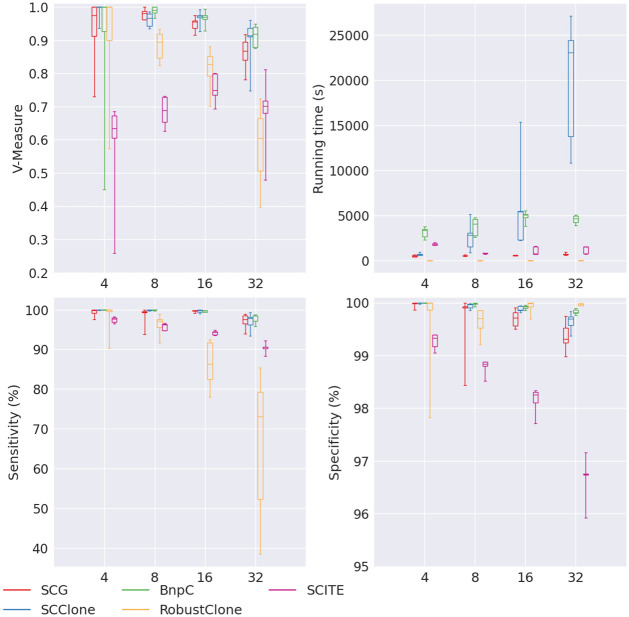
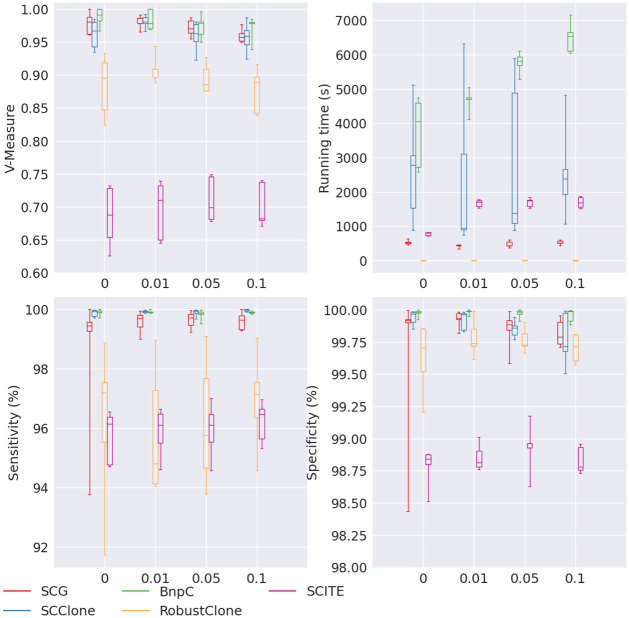
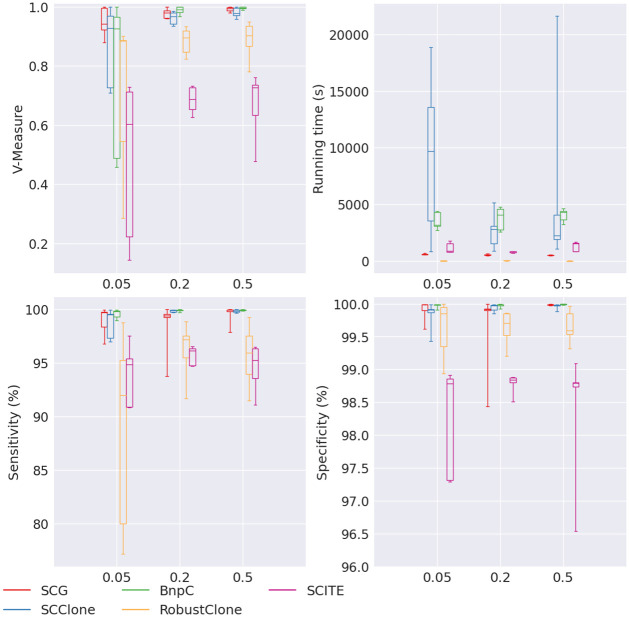
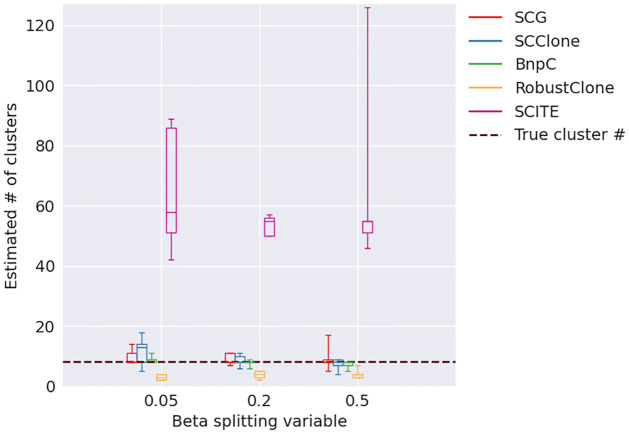
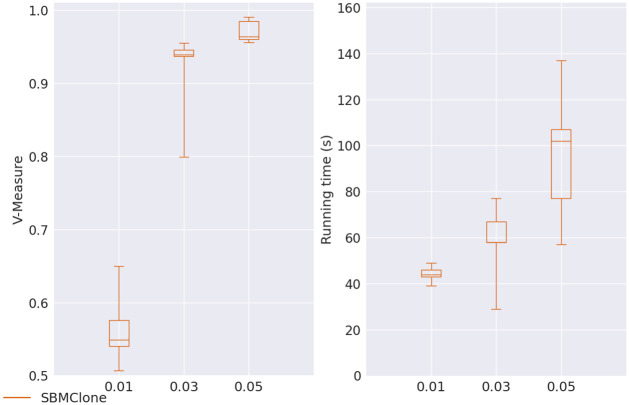
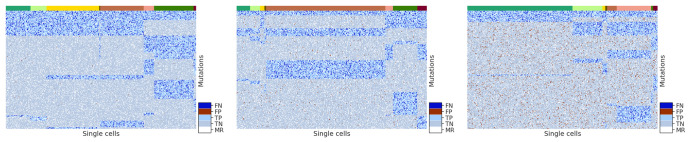
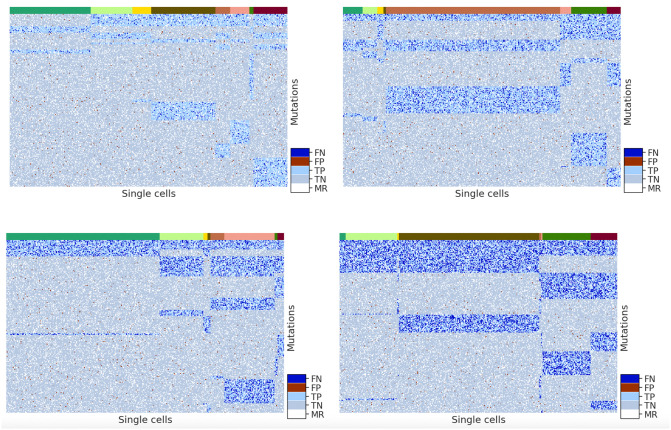
Results: In this paper, we evaluated six state-of-the-art cell clustering tools-SCG, BnpC, SCClone, RobustClone, SCITE and SBMClone-on simulated data sets given a variety of parameter settings and a real data set. We designed a simulator specifically for cell clustering, and compared these methods' performances in terms of their clustering accuracy, specificity and sensitivity and running time. For SBMClone, we specifically designed an ultra-low coverage large data set to evaluate its performance in the face of an extremely high missing rate.

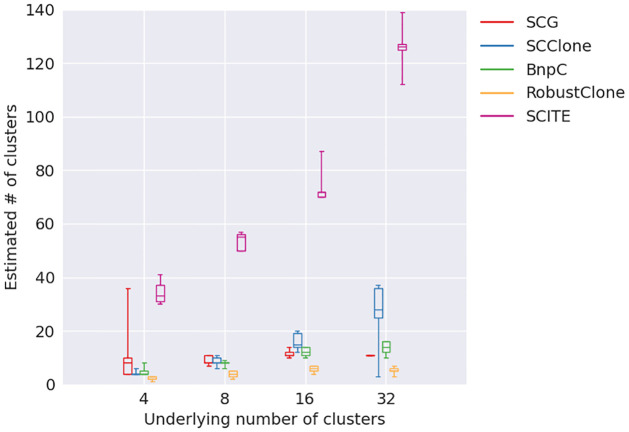
Conclusion: From the benchmark study, we conclude that BnpC and SCG's clustering accuracy are the highest and comparable to each other. However, BnpC is more advantageous in terms of running time when cell number is high (> 1500). It also has a higher clustering accuracy than SCG when cluster number is high (> 16). SCClone's accuracy in estimating the number of clusters is the highest. RobustClone and SCITE's clustering accuracy are the lowest for all experiments. SCITE tends to over-estimate the cluster number and has a low specificity, whereas RobustClone tends to under-estimate the cluster number and has a much lower sensitivity than other methods. SBMClone produced reasonably good clustering (V-measure > 0.9) when coverage is > = 0.03 and thus is highly recommended for ultra-low coverage large scDNAseq data sets.


Conflict of interest statement

The authors have declared that no competing interests exist.

Figures

Fig 1
Fig 1. Performance of SCG (red), SCClone (blue), BnpC (green), RobustClone (yellow), and SCITE (purple) for varying false positive rate, the values of which are shown on the x-axes.
The upper left, upper right, bottom left and bottom right panels are the V-measure, running time in seconds, genotyping sensitivity and genotyping specificity, respectively.
Fig 2
Fig 2. Performance of SCG (red), SCClone (blue), BnpC (green), RobustClone (yellow), and SCITE (purple) for varying false negative rates, the values of which are shown on the x-axes.
The upper left, upper right, bottom left and bottom right panels are the V-measure, running time in seconds, genotyping sensitivity and genotyping specificity, respectively.
Fig 3
Fig 3. Performance of SCG (red), SCClone (blue), BnpC (green), RobustClone (yellow), and SCITE (purple) for varying number of missing rates, the values of which are shown on the x-axes.
The upper left, upper right, bottom left and bottom right panels are the V-measure, running time in seconds, genotyping sensitivity and genotyping specificity, respectively.
Fig 4
Fig 4. Performance of SCG (red), SCClone (blue), BnpC (green), RobustClone (yellow), and SCITE (purple) for varying number of cells, the values of which are shown on the x-axes.
The upper left, upper right, bottom left and bottom right panels are the V-measure, running time in seconds, genotyping sensitivity and genotyping specificity, respectively.
Fig 5
Fig 5. Performance of SCG (red), SCClone (blue), BnpC (green), RobustClone (yellow), and SCITE (purple) for varying number of mutations, the values of which are shown on the x-axes.
The upper left, upper right, bottom left and bottom right panels are the V-measure, running time in seconds, genotyping sensitivity and genotyping specificity, respectively.
Fig 6
Fig 6. Performance of SCG (red), SCClone (blue), BnpC (green), RobustClone (yellow), and SCITE (purple) for varying number of clones, the values of which are shown on the x-axes.
The upper left, upper right, bottom left and bottom right panels are the V-measure, running time in seconds, genotyping sensitivity and genotyping specificity, respectively.
Fig 7
Fig 7. Estimated number of clusters (y-axis) for varying underlying number of clusters (x-axis).
Fig 8
Fig 8. Performance of SCG (red), SCClone (blue), BnpC (green), RobustClone (yellow), and SCITE (purple) for varying doublet rate, the values of which are shown on the x-axes.
The upper left, upper right, bottom left and bottom right panels are the V-measure, running time in seconds, genotyping sensitivity and genotyping specificity, respectively.
Fig 9
Fig 9. Performance of SCG (red), SCClone (blue), BnpC (green), RobustClone (yellow), and SCITE (purple) for varying Beta splitting variable, the values of which are shown on the x-axes.
The upper left, upper right, bottom left and bottom right panels are the V-measure, running time in seconds, genotyping sensitivity and genotyping specificity, respectively.
Fig 10
Fig 10. Estimated number of clusters for varying Beta splitting variable.
The underlying number of clusters was 8 for all Beta splitting variables.
Fig 11
Fig 11. V-measure and running time (in seconds) for SBMClone on coverage 0.01, 0.03 and 0.05.
Fig 12
Fig 12. Illustration of the clustering results from SCG (red background), SCClone (blue background), BnpC (green background), and RobustClone (orange background).
Fig 13
Fig 13. Heatmaps of a randomly sampled simulated D matrix whose false positive rate is 0.001 (leftmost), 0.01 (middle) and 0.05 (rightmost) whereas all other parameters are default.
For each heatmap, the rows represent mutations and the columns represent cells. The top color bar represents different subclones of cells. Cells corresponding to the same subclone are clustered together under the same color in the color bar. Inside the heatmap, there are five colors of the dots showing false negative (dark blue), false positive (dark red), true positive (light blue), true negative (grey), and missing (white) entries.
Fig 14
Fig 14. Heatmaps of a randomly sampled simulated D matrix whose false negative rate is 0.1 (upper left), 0.2 (upper right), 0.3 (bottom left) and 0.4 (bottom right) whereas all other parameters are default.
For each heatmap, the rows represent mutations and the columns represent cells. The top color bar represents different subclones of cells. Cells corresponding to the same subclone are clustered together under the same color in the color bar. Inside the heatmap, there are five colors of the dots showing false negative (dark blue), false positive (dark red), true positive (light blue), true negative (grey), and missing (white) entries.

Similar articles

References

    1. Feuk L, Carson AR, Scherer SW. Structural variation in the human genome. Nature Reviews Genetics. 2006;7(2):85. doi: 10.1038/nrg1767 - DOI - PubMed
    1. Sharp AJ, Cheng Z, Eichler EE. Structural variation of the human genome. Annu Rev Genomics Hum Genet. 2006;7:407–442. doi: 10.1146/annurev.genom.7.080505.115618 - DOI - PubMed
    1. Lupski JR. Structural variation in the human genome. New England Journal of Medicine. 2007;356(11):1169. doi: 10.1056/NEJMcibr067658 - DOI - PubMed
    1. Aparicio S, Mardis E. Tumor heterogeneity: next-generation sequencing enhances the view from the pathologist’s microscope; 2014. - PMC - PubMed
    1. El-Deiry WS, Taylor B, Neal JW. Tumor Evolution, Heterogeneity, and Therapy for Our Patients With Advanced Cancer: How Far Have We Come? American Society of Clinical Oncology Educational Book. 2017;37:e8–e15. doi: 10.1200/EDBK_175524 - DOI - PubMed

Publication types