. 2023 Oct 13;9(41):eadg3754.
doi: 10.1126/sciadv.adg3754. Epub 2023 Oct 12.

Multi-omic profiling of the developing human cerebral cortex at the single-cell level

Affiliations

Multi-omic profiling of the developing human cerebral cortex at the single-cell level

Kaiyi Zhu et al. Sci Adv. .

Abstract

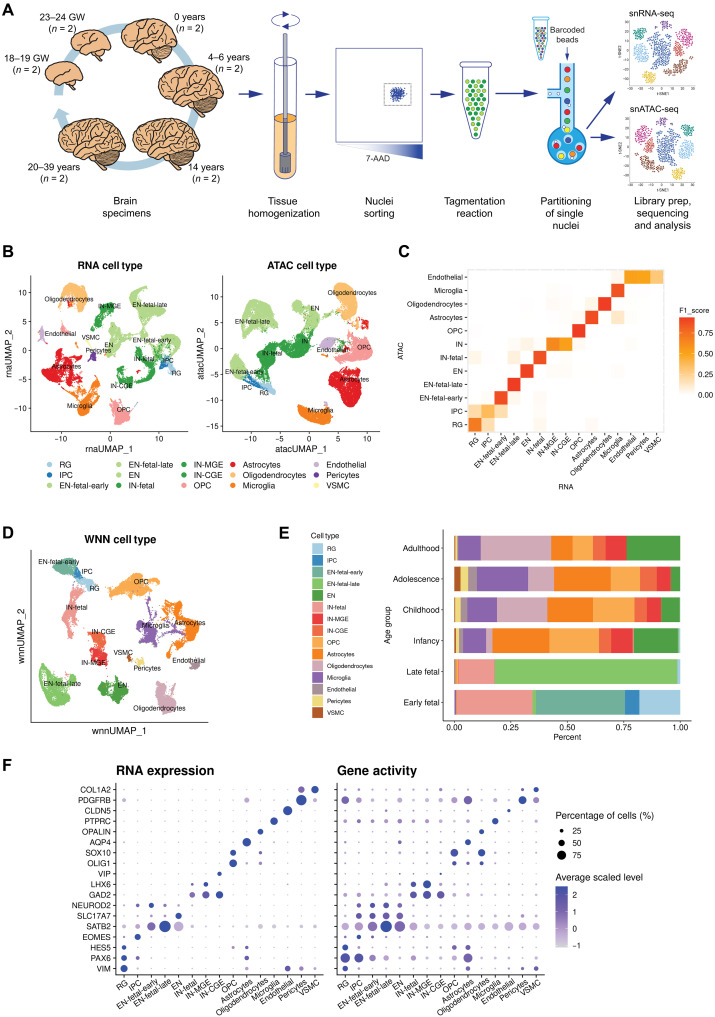
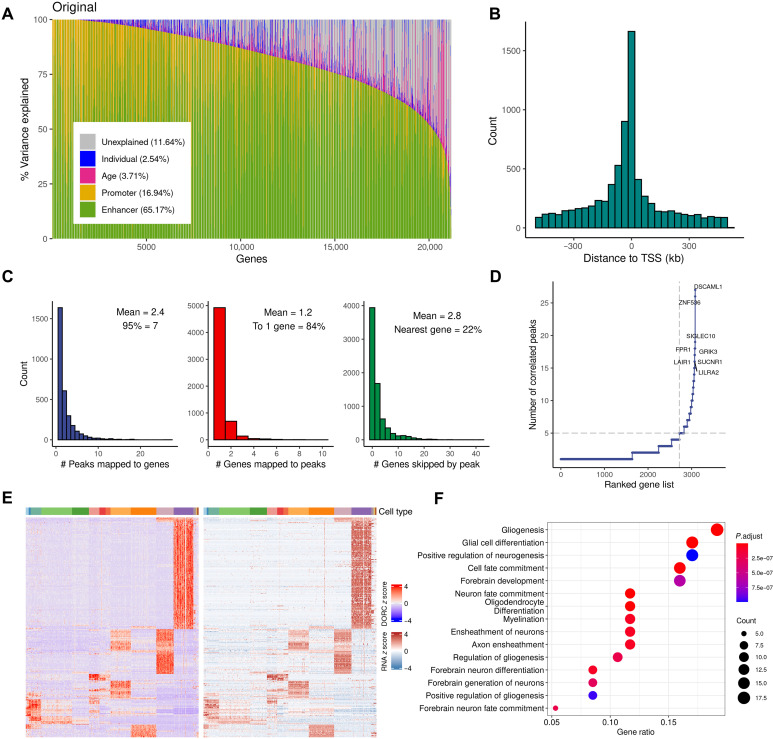
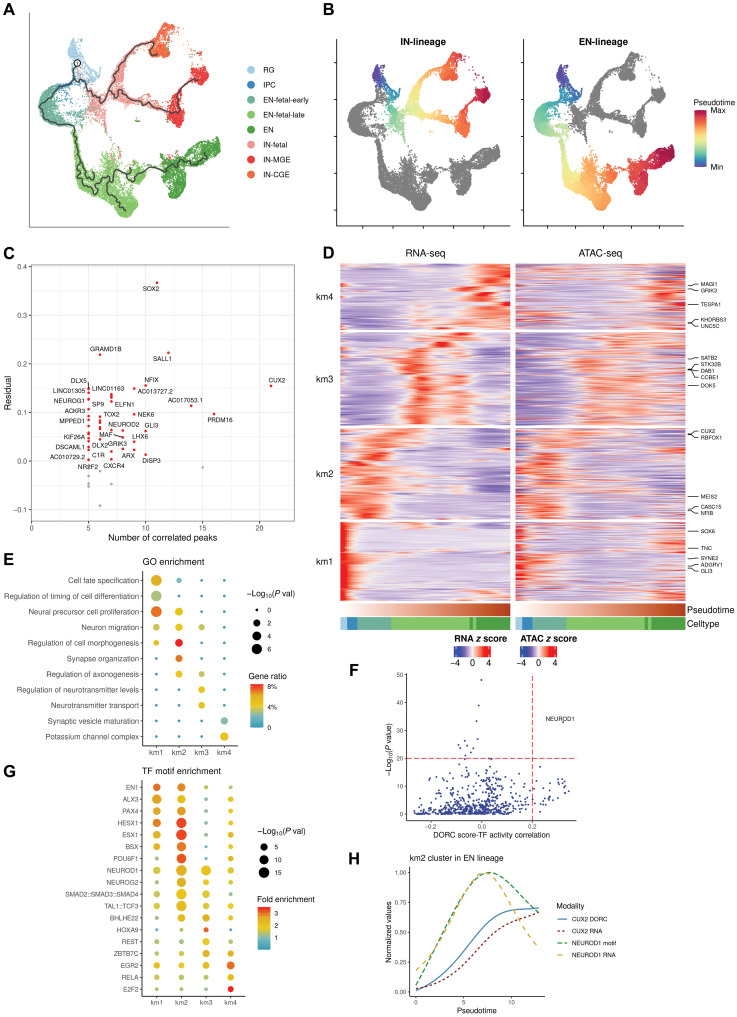
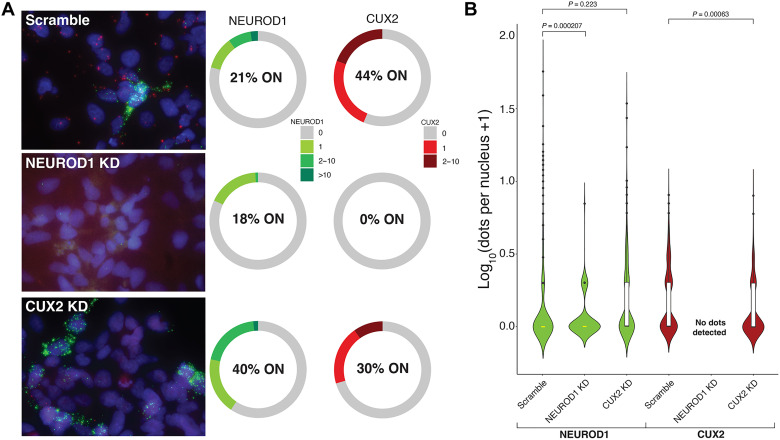
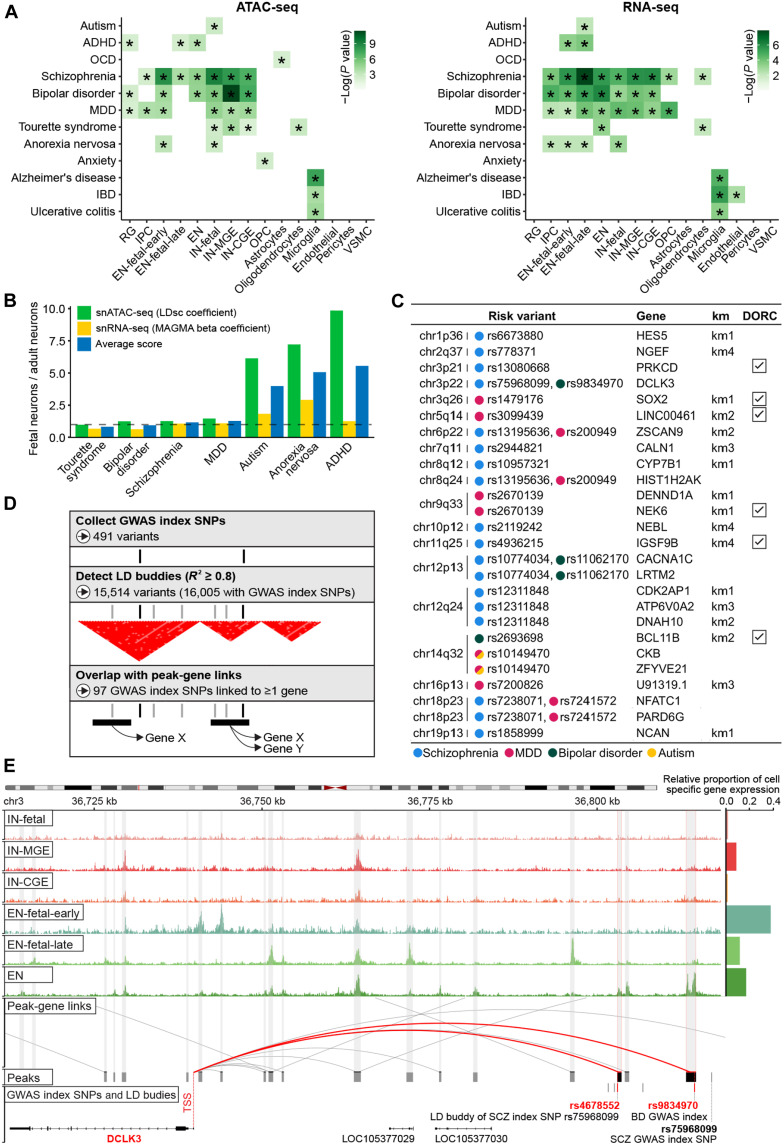
The cellular complexity of the human brain is established via dynamic changes in gene expression throughout development that is mediated, in part, by the spatiotemporal activity of cis-regulatory elements (CREs). We simultaneously profiled gene expression and chromatin accessibility in 45,549 cortical nuclei across six broad developmental time points from fetus to adult. We identified cell type-specific domains in which chromatin accessibility is highly correlated with gene expression. Differentiation pseudotime trajectory analysis indicates that chromatin accessibility at CREs precedes transcription and that dynamic changes in chromatin structure play a critical role in neuronal lineage commitment. In addition, we mapped cell type-specific and temporally specific genetic loci implicated in neuropsychiatric traits, including schizophrenia and bipolar disorder. Together, our results describe the complex regulation of cell composition at critical stages in lineage determination and shed light on the impact of spatiotemporal alterations in gene expression on neuropsychiatric disease.


Figures

Fig. 1.
Fig. 1.. Joint single-cell profiling of RNA expression and chromatin accessibility of human neocortex.
(A) Frozen human cortical brain specimens from six developmental time points were homogenized and purified by FANS before tagmentation and partitioning into single nuclei using the 10x Genomics platform. Libraries for snRNA-seq and snATAC-seq were prepared, sequenced, and analyzed independently. (B) UMAP visualizations of single cells defined by RNA-seq and ATAC-seq data, respectively. Cell type annotations are derived from either modality independently. (C) Heatmap showing the concordance of cell memberships between the two clustering results, measured in F1 score. (D) UMAP visualization of single cells defined by integrating two modalities using WNN analysis. Cell type annotations are determined on the basis of marker genes. (E) Proportions of cell types in each age group. (F) Dot plot showing selected marker gene expression and chromatin-derived gene activity across cell types.
Fig. 2.
Fig. 2.. Global and local characterization of cis regulation patterns.
(A) Variance component analysis showing chromatin accessibility explains variation in gene expression. Genes, in columns, are sorted by the decreasing proportion of variance explained by the epigenome (enhancers and promoters), with the mean-variance explained by each component shown in parenthesis. (B) Distribution of the distance from each peak to the TSS of the linked gene. (C) Histograms showing (from left to right) distribution of the number of peaks significantly linked per gene; distribution of the number genes significantly linked per peak; distribution of the number of genes “skipped” by a peak to reach its linked gene. (D) Number of significantly linked peaks for each gene, with genes sorted in increasing order. (E) Heatmap showing chromatin accessibility and gene expression of the linked peak-gene pairs (rows, left: aggregated peak accessibility, right: linked gene expression) in the DORCs across 500 pseudobulk samples (columns, sorted in terms of cell types); values are z score normalized. (F) Top 15 GO enrichment results for genes linked to DORCs.
Fig. 3.
Fig. 3.. Trajectories of gene regulation during neuronal development.
(A) Trajectories identified within the neuronal subpopulations, shown on the RNA gene expression coordinates (root node was annotated as “1”; cells were colored for annotated cell types). (B) Inferred pseudotime along the lineages for excitatory neurons (“EN-lineage”) and inhibitory neurons (“IN-lineage”), respectively. (C) Average residuals between chromatin accessibility and gene expression versus the number of significantly linked peaks for each gene involved in the DORCs identified within the neuronal populations. Positive and negative residuals are colored in red and gray, respectively. (D) Heatmap showing gene expression and DORC chromatin accessibility of the peak-gene links that significantly varied along the pseudotime for the EN lineage. Rows (genes) are clustered using k-means clustering (k = 4), and columns (cells) are ordered by pseudotime. The top five most differentially expressed genes in each cluster (km1/2/3/4) are annotated. (E) Respective GO enrichment of genes represented in the four peak-gene link clusters of the EN lineage. (F) P values of TF motif enrichment in km2 peaks plotted against Spearman correlation of TF motif activity with CUX2 DORC score. (G) TF motif enrichment of peaks represented in the peak-gene link clusters of the EN lineage. (H) Lineage dynamics of NEUROD1 motif activity and expression precede CUX2 DORC chromatin accessibility and gene expression in the EN lineage, from the beginning to the end of the km2 stage, using the min-max normalized, smoothed values over pseudotime.
Fig. 4.
Fig. 4.. Assessment of the relationship between NEUROD1 and CUX2 in differentiating NPCs.
(A) Maximum intensity projection images (from 200-nm z stacks obtained at ×63 magnification) of CUX2 (red) and NEUROD1 (green) expression in NPCs 2 weeks after differentiation treated with scrambled gRNA, a NEUROD1-specific gRNA, and a CUX2-specific gRNA. Charts show frequency distributions of RNAscope dots per nucleus for CUX2 and NEUROD1 in cells treated with scrambled gRNA (n = 444 cells), NEUROD1-specific gRNA (n = 111 cells), and CUX2-specific gRNA (n = 183 cells). % ON corresponds to % of nuclei with detectable RNAs. (B) Violin plots of nuclear RNA frequency distributions in all conditions. A two-sided Wilcoxon rank sum test with continuity correction was performed. The center line (yellow) indicates the median, the box shows the interquartile range, and whiskers indicate the highest/lowest values within 1.5× the interquartile range.
Fig. 5.
Fig. 5.. Mapping of risk variants associated with neuropsychiatric traits to causal genes using single cell–derived marker genes and peaks.
(A) Heritability enrichment of brain cell types in neuropsychiatric disorders and unrelated control traits. Heatmaps highlight significant colocalization of GWAS-derived common genetic variants with cell-specific open chromatin regions in snATAC-seq data (left) and cell marker genes in snRNA-seq data (right) (Materials and Methods). “*”: significant after correction across all tests (FDR < 0.05). (B) Comparison between fetal and adult neuronal signals in selected neuropsychiatric disorders (traits need to be enriched in either fetal or adult category; therefore, OCD and anxiety were not involved). Fetal and adult neurons are represented by peak sets/gene sets compiled from unions of the top 2500/500 most cell-specific peaks/genes from each fetal neuron (i.e., EN-fetal-early, EN-fetal-late, and IN-fetal) and adult neuron (i.e., EN, IN-CGE, and IN-MGE) category. To calculate the ratio “fetal neurons/adult neurons” (y axis), we used LDsc regression coefficients (snATAC-seq) and MAGMA beta coefficients (snRNA-seq); joint score is an average of snATAC-seq and snRNA-seq scores. (C) Subset of candidate causal genes for risk variants that either are prioritized in two disorders or show significantly altered expression along the developmental trajectory of the neuronal lineage (km1/2/3/4; full list of causal genes in table S12). (D) Schematic of the overall strategy to connect risk variants associated with neuropsychiatric disorders to their causal genes (Materials and Methods). (E) Normalized snATAC-seq–derived pseudobulk tracks demonstrating the complex cell-specific regulation of the DCLK3 gene that is predicted to be the causal gene for SCZ and BD GWAS risk variants (rs75968099 and rs75968099).

References

    1. Bae B.-i., Jayaraman D., Walsh C. A., Genetic changes shaping the human brain. Dev. Cell 32, 423–434 (2015). - PMC - PubMed
    1. Silbereis J. C., Pochareddy S., Zhu Y., Li M., Sestan N., The cellular and molecular landscapes of the developing human central nervous system. Neuron 89, 248–268 (2016). - PMC - PubMed
    1. Birnbaum R., Weinberger D. R., Genetic insights into the neurodevelopmental origins of schizophrenia. Nat. Rev. Neurosci. 18, 727–740 (2017). - PubMed
    1. Sestan N., State M. W., Lost in translation: Traversing the complex path from genomics to therapeutics in autism spectrum disorder. Neuron 100, 406–423 (2018). - PMC - PubMed
    1. Kang H. J., Kawasawa Y. I., Cheng F., Zhu Y., Xu X., Li M., Sousa A. M. M., Pletikos M., Meyer K. A., Sedmak G., Guennel T., Shin Y., Johnson M. B., Krsnik Ž., Mayer S., Fertuzinhos S., Umlauf S., Lisgo S. N., Vortmeyer A., Weinberger D. R., Mane S., Hyde T. M., Huttner A., Reimers M., Kleinman J. E., Šestan N., Spatio-temporal transcriptome of the human brain. Nature 478, 483–489 (2011). - PMC - PubMed