

A single-cell multi-omic atlas spanning the adult rhesus macaque brain
- PMID: 37824616
- PMCID: PMC10569716
- DOI: 10.1126/sciadv.adh1914
A single-cell multi-omic atlas spanning the adult rhesus macaque brain
Abstract
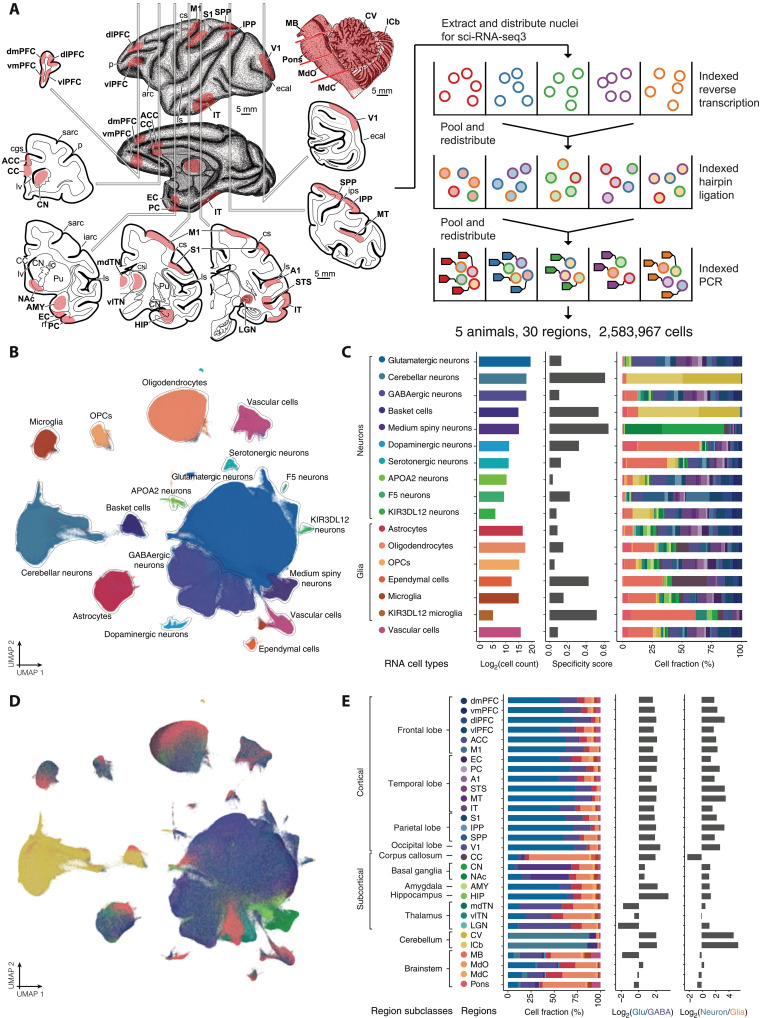
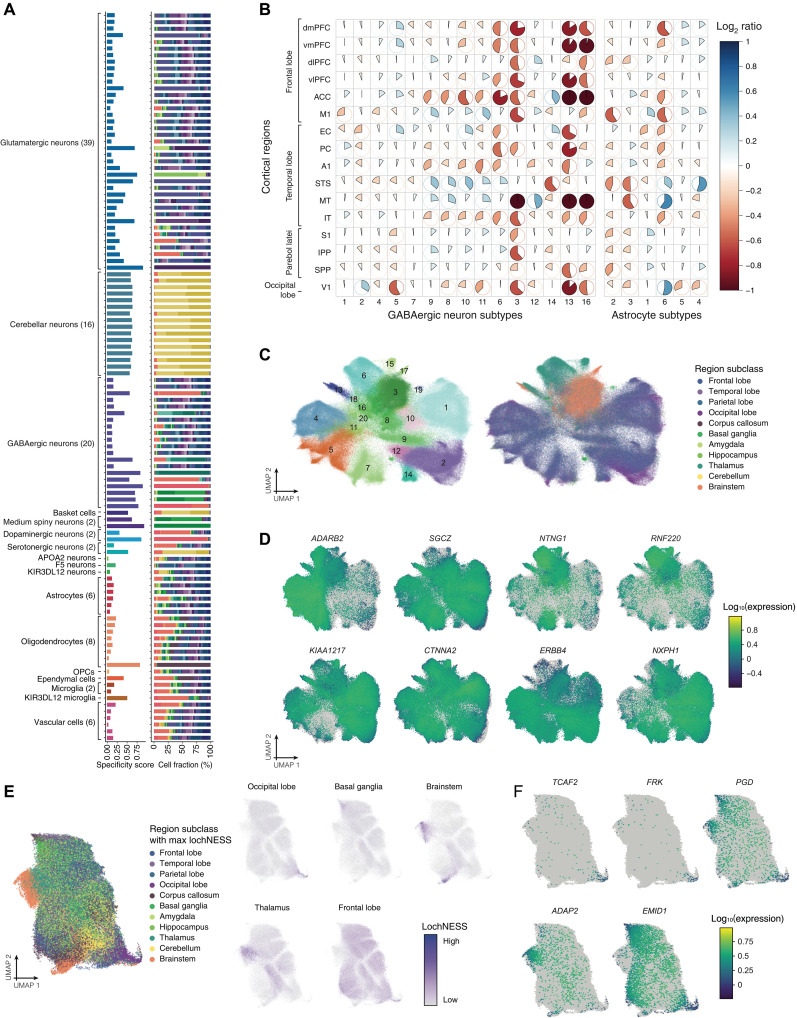
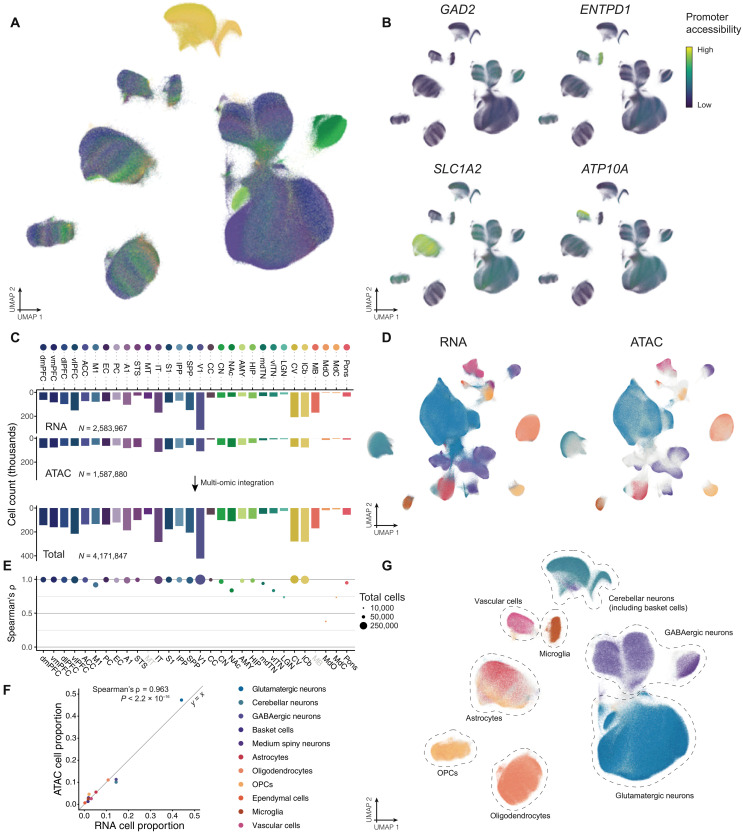
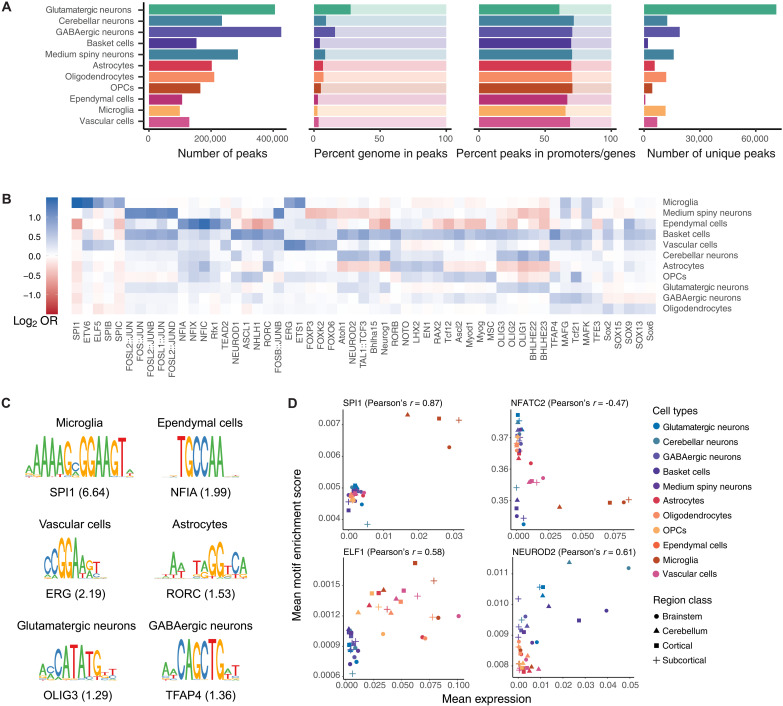
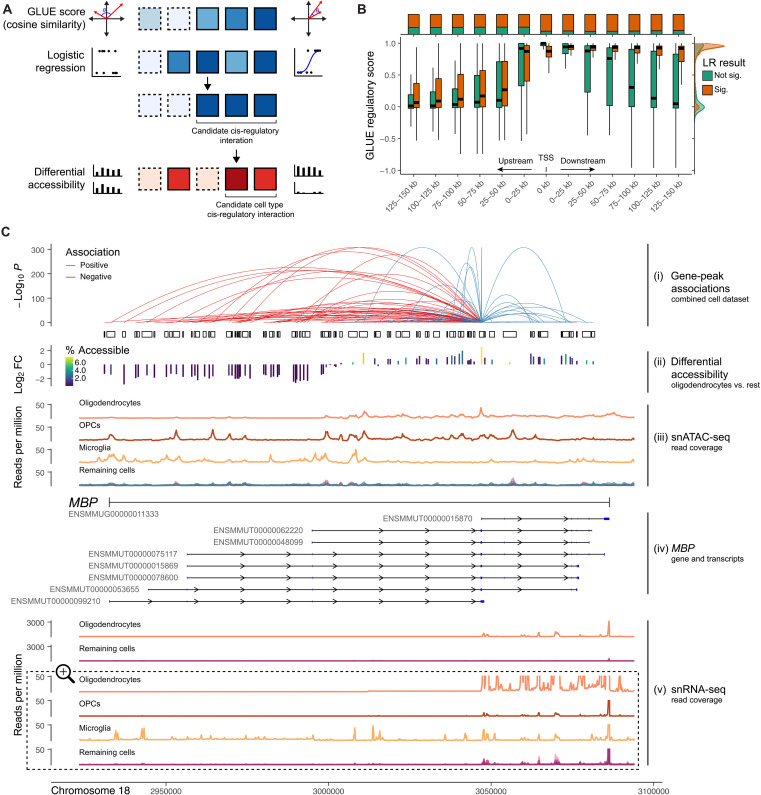
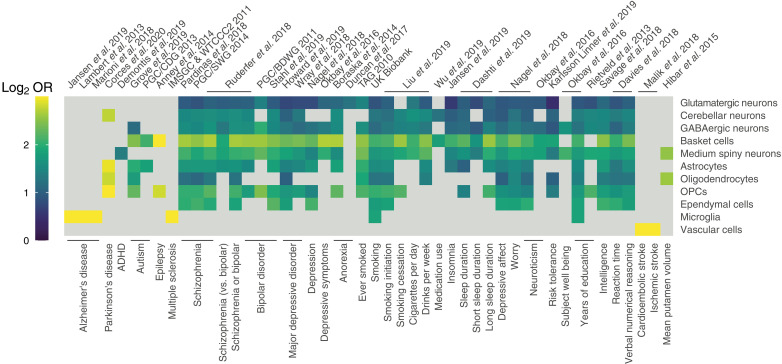
Cataloging the diverse cellular architecture of the primate brain is crucial for understanding cognition, behavior, and disease in humans. Here, we generated a brain-wide single-cell multimodal molecular atlas of the rhesus macaque brain. Together, we profiled 2.58 M transcriptomes and 1.59 M epigenomes from single nuclei sampled from 30 regions across the adult brain. Cell composition differed extensively across the brain, revealing cellular signatures of region-specific functions. We also identified 1.19 M candidate regulatory elements, many previously unidentified, allowing us to explore the landscape of cis-regulatory grammar and neurological disease risk in a cell type-specific manner. Altogether, this multi-omic atlas provides an open resource for investigating the evolution of the human brain and identifying novel targets for disease interventions.
Figures
References
-
- R. I. M. Dunbar, S. Shultz, Evolution in the social brain. Science 317, 1344–1347 (2007). - PubMed
-
- A. Navarrete, C. P. van Schaik, K. Isler, Energetics and the evolution of human brain size. Nature 480, 91–93 (2011). - PubMed
-
- C. Darwin, The Descent of Man, and Selection in Relation to Sex (John Murray, 1871).
-
- K. L. Grasby, N. Jahanshad, J. N. Painter, L. Colodro-Conde, J. Bralten, D. P. Hibar, P. A. Lind, F. Pizzagalli, C. R. K. Ching, M. A. B. McMahon, N. Shatokhina, L. C. P. Zsembik, S. I. Thomopoulos, A. H. Zhu, L. T. Strike, I. Agartz, S. Alhusaini, M. A. A. Almeida, D. Alnæs, I. K. Amlien, M. Andersson, T. Ard, N. J. Armstrong, A. Ashley-Koch, J. R. Atkins, M. Bernard, R. M. Brouwer, E. E. L. Buimer, R. Bülow, C. Bürger, D. M. Cannon, M. Chakravarty, Q. Chen, J. W. Cheung, B. Couvy-Duchesne, A. M. Dale, S. Dalvie, T. K. de Araujo, G. I. de Zubicaray, S. M. C. de Zwarte, A. den Braber, N. T. Doan, K. Dohm, S. Ehrlich, H.-R. Engelbrecht, S. Erk, C. C. Fan, I. O. Fedko, S. F. Foley, J. M. Ford, M. Fukunaga, M. E. Garrett, T. Ge, S. Giddaluru, A. L. Goldman, M. J. Green, N. A. Groenewold, D. Grotegerd, T. P. Gurholt, B. A. Gutman, N. K. Hansell, M. A. Harris, M. B. Harrison, C. C. Haswell, M. Hauser, S. Herms, D. J. Heslenfeld, N. F. Ho, D. Hoehn, P. Hoffmann, L. Holleran, M. Hoogman, J.-J. Hottenga, M. Ikeda, D. Janowitz, I. E. Jansen, T. Jia, C. Jockwitz, R. Kanai, S. Karama, D. Kasperaviciute, T. Kaufmann, S. Kelly, M. Kikuchi, M. Klein, M. Knapp, A. R. Knodt, B. Krämer, M. Lam, T. M. Lancaster, P. H. Lee, T. A. Lett, L. B. Lewis, I. Lopes-Cendes, M. Luciano, F. Macciardi, A. F. Marquand, S. R. Mathias, T. R. Melzer, Y. Milaneschi, N. Mirza-Schreiber, J. C. V. Moreira, T. W. Mühleisen, B. Müller-Myhsok, P. Najt, S. Nakahara, K. Nho, L. M. O. Loohuis, D. P. Orfanos, J. F. Pearson, T. L. Pitcher, B. Pütz, Y. Quidé, A. Ragothaman, F. M. Rashid, W. R. Reay, R. Redlich, C. S. Reinbold, J. Repple, G. Richard, B. C. Riedel, S. L. Risacher, C. S. Rocha, N. R. Mota, L. Salminen, A. Saremi, A. J. Saykin, F. Schlag, L. Schmaal, P. R. Schofield, R. Secolin, C. Y. Shapland, L. Shen, J. Shin, E. Shumskaya, I. E. Sønderby, E. Sprooten, K. E. Tansey, A. Teumer, A. Thalamuthu, D. Tordesillas-Gutiérrez, J. A. Turner, A. Uhlmann, C. L. Vallerga, D. van der Meer, M. M. J. van Donkelaar, L. van Eijk, T. G. M. van Erp, N. E. M. van Haren, D. van Rooij, M.-J. van Tol, J. H. Veldink, E. Verhoef, E. Walton, M. Wang, Y. Wang, J. M. Wardlaw, W. Wen, L. T. Westlye, C. D. Whelan, S. H. Witt, K. Wittfeld, C. Wolf, T. Wolfers, J. Q. Wu, C. L. Yasuda, D. Zaremba, Z. Zhang, M. P. Zwiers, E. Artiges, A. A. Assareh, R. Ayesa-Arriola, A. Belger, C. L. Brandt, G. G. Brown, S. Cichon, J. E. Curran, G. E. Davies, F. Degenhardt, M. F. Dennis, B. Dietsche, S. Djurovic, C. P. Doherty, R. Espiritu, D. Garijo, Y. Gil, P. A. Gowland, R. C. Green, A. N. Häusler, W. Heindel, B.-C. Ho, W. U. Hoffmann, F. Holsboer, G. Homuth, N. Hosten, C. R. Jack Jr, M. Jang, A. Jansen, N. A. Kimbrel, K. Kolskår, S. Koops, A. Krug, K. O. Lim, J. J. Luykx, D. H. Mathalon, K. A. Mather, V. S. Mattay, S. Matthews, J. M. Van Son, S. C. McEwen, I. Melle, D. W. Morris, B. A. Mueller, M. Nauck, J. E. Nordvik, M. M. Nöthen, D. S. O’Leary, N. Opel, M.-L. P. Martinot, G. B. Pike, A. Preda, E. B. Quinlan, P. E. Rasser, V. Ratnakar, S. Reppermund, V. M. Steen, P. A. Tooney, F. R. Torres, D. J. Veltman, J. T. Voyvodic, R. Whelan, T. White, H. Yamamori, H. H. H. Adams, J. C. Bis, S. Debette, C. Decarli, M. Fornage, V. Gudnason, E. Hofer, M. A. Ikram, L. Launer, W. T. Longstreth, O. L. Lopez, B. Mazoyer, T. H. Mosley, G. V. Roshchupkin, C. L. Satizabal, R. Schmidt, S. Seshadri, Q. Yang; Alzheimer’s Disease Neuroimaging Initiative; CHARGE Consortium; EPIGEN Consortium; IMAGEN Consortium; SYS Consortium; Parkinson’s Progression Markers Initiative, M. K. M. Alvim, D. Ames, T. J. Anderson, O. A. Andreassen, A. Arias-Vasquez, M. E. Bastin, B. T. Baune, J. C. Beckham, J. Blangero, D. I. Boomsma, H. Brodaty, H. G. Brunner, R. L. Buckner, J. K. Buitelaar, J. R. Bustillo, W. Cahn, M. J. Cairns, V. Calhoun, V. J. Carr, X. Caseras, S. Caspers, G. L. Cavalleri, F. Cendes, A. Corvin, B. Crespo-Facorro, J. C. Dalrymple-Alford, U. Dannlowski, E. J. C. de Geus, I. J. Deary, N. Delanty, C. Depondt, S. Desrivières, G. Donohoe, T. Espeseth, G. Fernández, S. E. Fisher, H. Flor, A. J. Forstner, C. Francks, B. Franke, D. C. Glahn, R. L. Gollub, H. J. Grabe, O. Gruber, A. K. Håberg, A. R. Hariri, C. A. Hartman, R. Hashimoto, A. Heinz, F. A. Henskens, M. H. J. Hillegers, P. J. Hoekstra, A. J. Holmes, L. E. Hong, W. D. Hopkins, H. E. Hulshoff Pol, T. L. Jernigan, E. G. Jönsson, R. S. Kahn, M. A. Kennedy, T. T. J. Kircher, P. Kochunov, J. B. J. Kwok, S. Le Hellard, C. M. Loughland, N. G. Martin, J.-L. Martinot, C. McDonald, K. L. McMahon, A. Meyer-Lindenberg, P. T. Michie, R. A. Morey, B. Mowry, L. Nyberg, J. Oosterlaan, R. A. Ophoff, C. Pantelis, T. Paus, Z. Pausova, B. W. J. H. Penninx, T. J. C. Polderman, D. Posthuma, M. Rietschel, J. L. Roffman, L. M. Rowland, P. S. Sachdev, P. G. Sämann, U. Schall, G. Schumann, R. J. Scott, K. Sim, S. M. Sisodiya, J. W. Smoller, I. E. Sommer, B. St. Pourcain, D. J. Stein, A. W. Toga, J. N. Trollor, N. J. A. Van der Wee, D. van ‘t Ent, H. Völzke, H. Walter, B. Weber, D. R. Weinberger, M. J. Wright, J. Zhou, J. L. Stein, P. M. Thompson, S. E. Medland; Enhancing NeuroImaging Genetics through Meta-Analysis Consortium (ENIGMA)—Genetics working group , The genetic architecture of the human cerebral cortex. Science 367, eaay6690 (2020).
MeSH terms
Grants and funding
- R01 MH089484/MH/NIMH NIH HHS/United States
- R01 AG084706/AG/NIA NIH HHS/United States
- R00 AG051764/AG/NIA NIH HHS/United States
- R00 AG075241/AG/NIA NIH HHS/United States
- R37 MH109728/MH/NIMH NIH HHS/United States
- R21 AG073958/AG/NIA NIH HHS/United States
- R56 MH122819/MH/NIMH NIH HHS/United States
- U01 MH121260/MH/NIMH NIH HHS/United States
- R01 MH118203/MH/NIMH NIH HHS/United States
- P40 OD012217/OD/NIH HHS/United States
- K99 AG075241/AG/NIA NIH HHS/United States
- R56 AG071023/AG/NIA NIH HHS/United States
- R01 HG010632/HG/NHGRI NIH HHS/United States
- R01 AG060931/AG/NIA NIH HHS/United States
- T32 AG000057/AG/NIA NIH HHS/United States
- R01 MH108627/MH/NIMH NIH HHS/United States
- R01 MH096875/MH/NIMH NIH HHS/United States
LinkOut - more resources
Full Text Sources
