. 2023 Oct 13;9(41):eadf0708.
doi: 10.1126/sciadv.adf0708. Epub 2023 Oct 12.

Structural and functional specializations of human fast-spiking neurons support fast cortical signaling

Affiliations

Structural and functional specializations of human fast-spiking neurons support fast cortical signaling

René Wilbers et al. Sci Adv. .

Abstract

Fast-spiking interneurons (FSINs) provide fast inhibition that synchronizes neuronal activity and is critical for cognitive function. Fast synchronization frequencies are evolutionary conserved in the expanded human neocortex despite larger neuron-to-neuron distances that challenge fast input-output transfer functions of FSINs. Here, we test in human neurons from neurosurgery tissue, which mechanistic specializations of human FSINs explain their fast-signaling properties in human cortex. With morphological reconstructions, multipatch recordings, and biophysical modeling, we find that despite threefold longer dendritic path, human FSINs maintain fast inhibition between connected pyramidal neurons through several mechanisms: stronger synapse strength of excitatory inputs, larger dendrite diameter with reduced complexity, faster AP initiation, and faster and larger inhibitory output, while Na+ current activation/inactivation properties are similar. These adaptations underlie short input-output delays in fast inhibition of human pyramidal neurons through FSINs, explaining how cortical synchronization frequencies are conserved despite expanded and sparse network topology of human cortex.


Figures

Fig. 1.
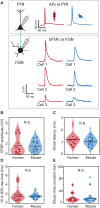
Fig. 1.. Human FSIN dendrites have elongated path lengths with reduced complexity.
(A) Examples of dendritic reconstructions of L2/L3 FSINs from human and mouse cortices. (B) Total dendritic length. ***P < 10−4, Wilcoxon rank sum (WRS) test. (C) Number of branch points. *P = 0.01, t test. (D) Number of primary dendrites originating from the soma. **P = 0.004, WRS test. (E) Dendritic diameters over branch orders. ***P < 10−12, linear regression model (species effect). (F) Mean dendritic path length from terminal end points to soma. ***P < 10−6, t test. (G) Mean length of nonterminal (NT) segments. **P = 0.0045, t test. T, terminal.
Fig. 2.
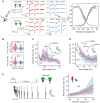
Fig. 2.. Unitary EPSP strength and kinetics are similar in human and mouse FSINs.
(A) Schematic representation and example traces from three human and three mouse recordings of pyramidal-FSIN pairs, where single APs in a pyramidal neuron evoked unitary EPSPs in a FSIN. (B to E) EPSP parameters extracted from average trace of 5 to 10 traces (data points), their distributions (violins), and median values (black horizontal lines) are shown for the data recorded in this study (filled circles) and extracted from Allen Institute for Brain Science (AIBS) database (open circles). Sample size: human, n = 17 connected pairs: 12 from our laboratory (filled circles) and 5 from AIBS (open circles); mouse, n = 23 connected pairs: 15 from our laboratory (filled circles) and 8 from AIBS (open circles). (B) EPSP amplitude. P = 0.46, Mann-Whitney U (MWU) test. (C) EPSP onset latency. P = 0.23, MWU test. (D) 10 to 90% rise time. P = 0.54, MWU test. (E) Time constant of decay. P = 0.48, MWU test. N.S., nonsignificant.
Fig. 3.
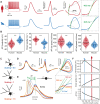
Fig. 3.. Conserved somatic Na+ current properties in human and mouse L2/L3 FSINs.
(A) Somatic Na+ current activation and inactivation properties are similar in mouse and human FSINs. Somatic Na+ currents were recorded in nucleated patch recordings, and example Na+ currents for three mouse and three human neurons at different prepulse voltages in inactivation protocol and at different activation voltages in activation protocol are shown in gray frames. Inactivation and activation curves (mean ± SEM) from human (red) and mouse (blue) FSINs are shown. Right: Black lines denote Boltzmann fits. (B) Half-voltages of inactivation (top) and activation (bottom) from Boltzmann fits to individual FSINs. (C) Time constant of activation across voltages. Inset: Example trace from a human nucleated patch recording. N.S., P = 0.90, linear regression model (species effect). (D) Time constant of inactivation across voltages. Inset: Example trace from human patch. N.S., P = 0.10, linear regression model (species effect). (E) Left: Example trace in a human FSIN showing the recovery protocol. Right: Time constant of recovery at −80 to −65 mV. N.S., P = 0.62, linear regression model (species effect). Sample size: human, n = 7 recordings; mouse, n = 9.
Fig. 4.
Fig. 4.. Human dendritic morphology combined with increased synapse size is sufficient to allow fast responses to distal excitatory inputs to FSINs.
(A) Schematic representation of human and mouse FSIN models based on dendrite count, dendrite diameter, terminal segment length, and nonterminal segment length. (B) Typical FSIN responses of the model to simulated current injection. (C) Somatic EPSP amplitude decrease and EPSP rise time increase as a function of synapse distance in models based on human and mouse morphologies. Example EPSP traces of human and mouse FSIN models to synaptic stimulations at different distances from soma are shown above. (D) Amplitudes and rise times of somatic EPSPs generated in human, mouse, and hybrid models based on morphological parameters (from left to right): full human model, human model with mouse number of primary dendrites originating from soma (seven dendrites), human model with the dendritic path length from mouse neurons, full mouse model, mouse model with dendritic path length from human FSINs, and mouse model with human number of primary dendrites originating from soma (five dendrites). (E) Amplitudes and rise times of somatic EPSPs generated in human models with an addition of one of the following electrophysiological parameters (from left to right): human model, human model with a twofold increase of synapse strength, with added Ih current gradient, with added passive conductance gradient, and with added stretched conductance. (F) AP traces of APs generated by synaptic inputs at different synaptic distances in the mouse, human, and human + twofold increase in synapse strength models. (G) Summary data of AP delays in the three models generated by inputs at different synaptic distances. (H) Stimulation of synaptic inputs at random locations leads to longer AP delays in the human model, which is rescued by a twofold increase in synaptic strength.
Fig. 5.
Fig. 5.. Mechanisms of fast onset kinetics and early AP initiation in AIS in human FSINs.
(A) Example AP traces recorded in human (red) and mouse (blue) FSINs. From left to right: AP firing in response to a long square current injection, AP waveform, AP derivative, AP phase plot, and onset rapidity (slope fit of the phase plane). (B) Cross-species analysis of AP parameters. From left to right: AP threshold (***P = 4.9 × 10⁻⁷, t test), onset rapidity (***P = 2.2 × 10⁻⁵, t test), AP rise speed (***P = 0.0001, t test), and AP fall speed (***P = 0.0003, t test). Sample size: human, n = 18 neurons: 14 from our laboratory (filled circles) and 4 from AIBS (open circles); mouse, n = 24 neurons: 19 from our laboratory (filled circles) and 5 from AIBS (open circles). (C) Three human models were generated: one with normal dendritic length (scaling = 1, red), elongated dendritic length (scaling = 1.5, orange), and shorter dendritic length similar to mouse morphology (scaling = 0.5, blue). (D) Up- and downscaling of the dendritic length in human model results in a lower threshold, faster onset rapidity, and earlier AP initiation at axon initial segment (AIS) relative to the soma. Example traces from left to right: AP waveform, AP derivative, AP phase plot, and onset rapidity (gray square). (E) Example AP traces in AIS and soma are shown for three models: Longer dendritic length leads to earlier AP initiation in AIS relative to soma. (F) Upscaling of dendritic length leads to more negative AP threshold, faster AP initiation kinetics (onset rapidity), and earlier AP initiation in AIS relative to soma, and shaded areas indicate dendritic length that corresponds to human (scaling =1, red) and mouse (scaling = 0.5, blue) neurons.
Fig. 6.
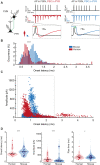
Fig. 6.. Fast synaptic output of human FSINs to pyramidal neurons.
(A) Example traces of paired recordings of FSIN to pyramidal (PYR) connections of mouse and human neurons. APs in FSINs resulted in negative PSCs in connected FSINs. (B) Distribution of onset latencies of unitary PSC events for human and mouse pairs shows faster PSC onset latencies in human pyramidal neurons. ***P = 2.6 × 10−46, two-sample Kolmogorov-Smirnov test. (C) Onset latencies of individual responses in FSINs are plotted versus their amplitudes. Events from pairs with monosynaptic connections have onset latencies < 2.5 ms (framed in gray). Sample size: human, n = 1707 PSCs from 15 recorded pairs; mouse, n = 2243 PSCs from 20 pairs). (D) Onset latencies, amplitudes, and rise times of only monosynaptic connections [framed in gray in (B)] are shown as individual events (open circles) and as median values for each connection (filled circles), and black horizontal lines are median per recorded connected pair. Statistics individual events: onset latencies, ***P = 4.3 × 10—21; amplitudes, ***P = 2.3 × 10−43; rise times, *P = 0.03, MWU test. Median values for each connected pair: not significant, MWU test. Sample size: human, n = 1569 PSCs from 15 recorded pairs; mouse, n = 2224 PSCs from 20 pairs).
Fig. 7.
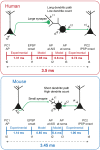
Fig. 7.. Estimation of the total input-output delay of the fast disynaptic loop through FSINs.
(Top) Schematic illustration of the loop and time series of events from input to output. (Bottom) Time lines of median delays obtained from experiments and models in this study. Estimated total disynaptic delay is 3.5 ms for human and 3.45 ms for mouse. PC1, pyramidal cell 1; PC2, pyramidal cell 2; IPSP, inhibitory postsynaptic potential.

References

    1. Z. J. Huang, A. Paul, The diversity of GABAergic neurons and neural communication elements. Nat. Rev. Neurosci. 20, 563–572 (2019). - PMC - PubMed
    1. R. Tremblay, S. Lee, B. Rudy, GABAergic interneurons in the neocortex: From cellular properties to circuits. Neuron 91, 260–292 (2016). - PMC - PubMed
    1. H. Hu, P. Jonas, A supercritical density of Na+ channels ensures fast signaling in GABAergic interneuron axons. Nat. Neurosci. 17, 686–693 (2014). - PMC - PubMed
    1. B. Wang, W. Ke, J. Guang, G. Chen, L. Yin, S. Deng, Q. He, Y. Liu, T. He, R. Zheng, Y. Jiang, X. Zhang, T. Li, G. Luan, H. D. Lu, M. Zhang, X. Zhang, Y. Shu, Firing frequency maxima of fast-spiking neurons in human, monkey, and mouse neocortex. Front. Cell. Neurosci. 10, 1–13 (2016). - PMC - PubMed
    1. V. Szegedi, M. Paizs, J. Baka, P. Barzó, G. Molnár, G. Tamas, K. Lamsa, Robust perisomatic GABAergic selfinnervation inhibits basket cells in the human and mouse supragranular neocortex. eLife 9, 1–19 (2020). - PMC - PubMed