. 2023 Oct 13;382(6667):eade9516.
doi: 10.1126/science.ade9516. Epub 2023 Oct 13.

Comparative transcriptomics reveals human-specific cortical features

Affiliations

Comparative transcriptomics reveals human-specific cortical features

Nikolas L Jorstad et al. Science. .

Abstract

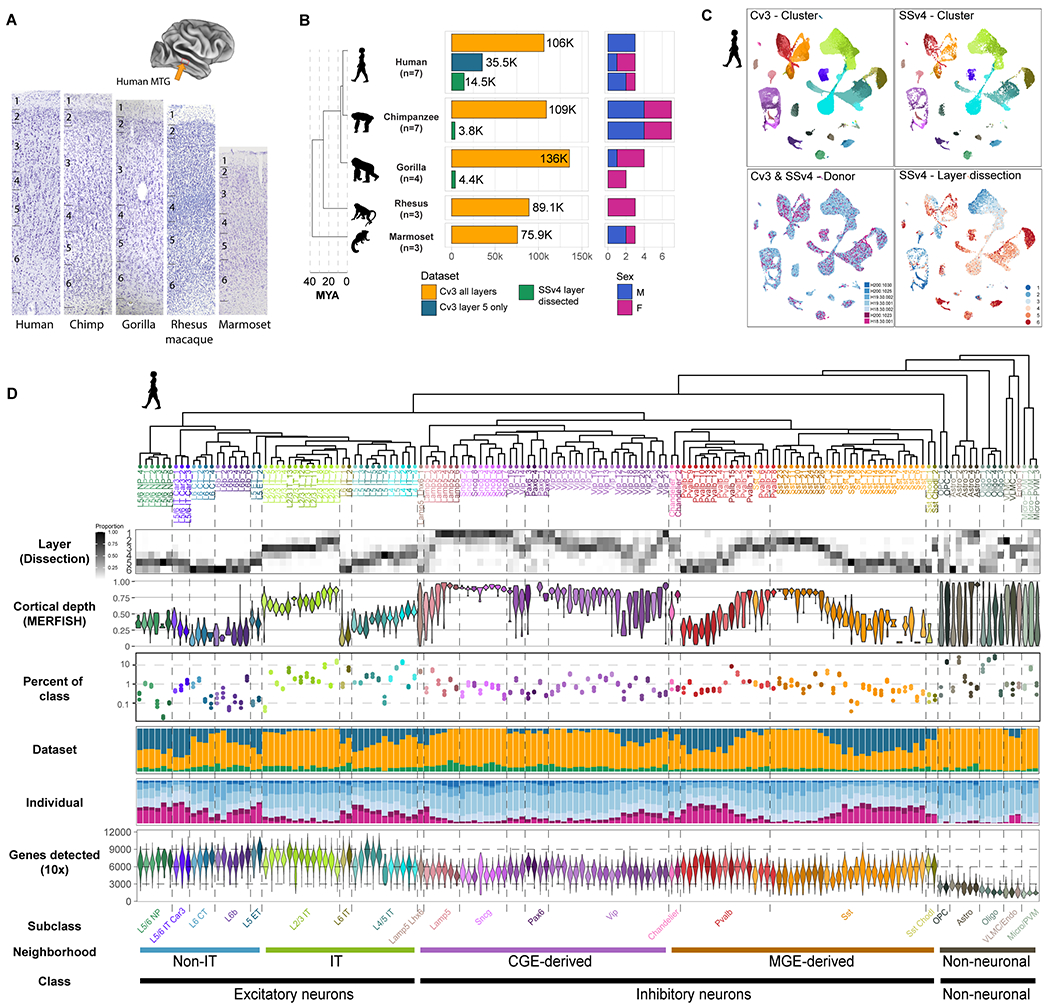
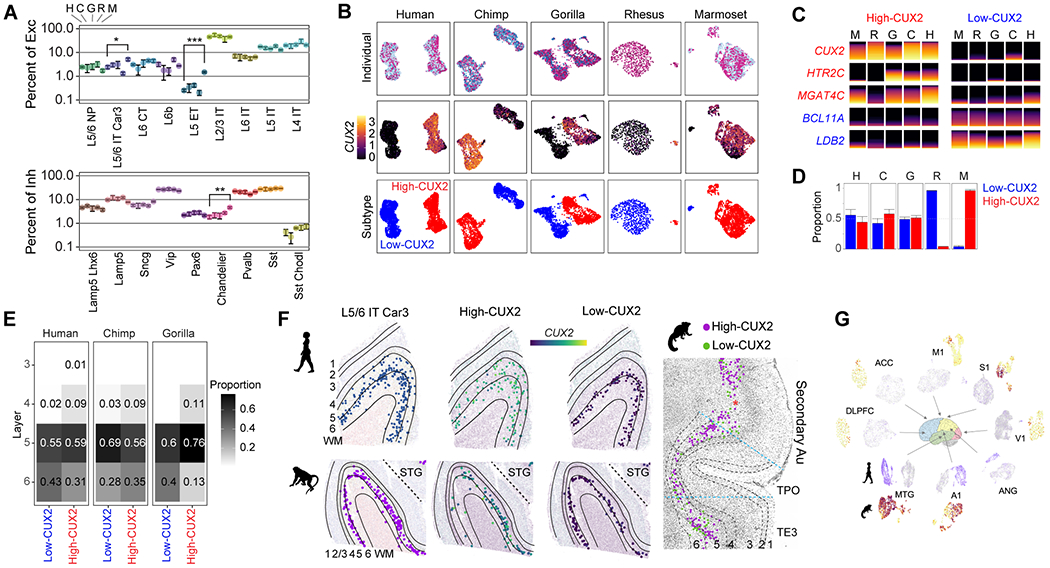
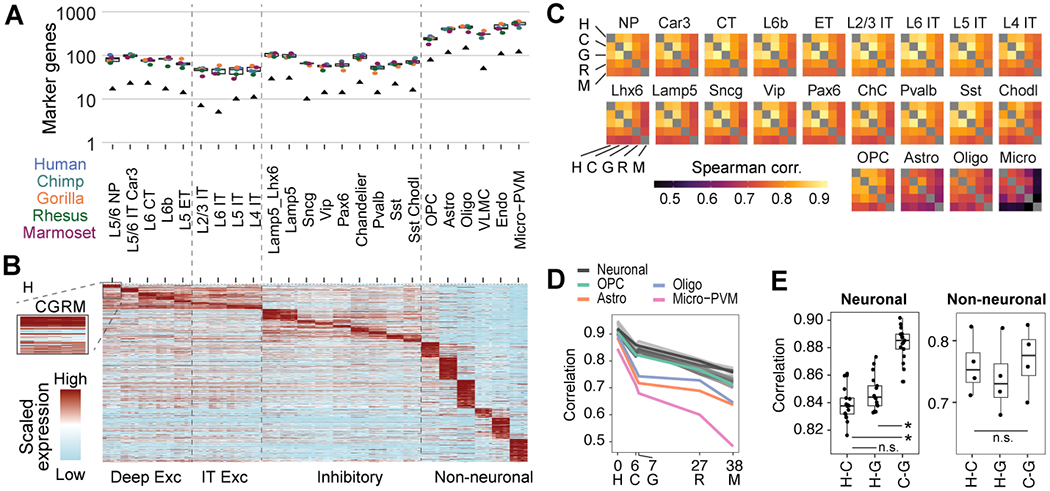
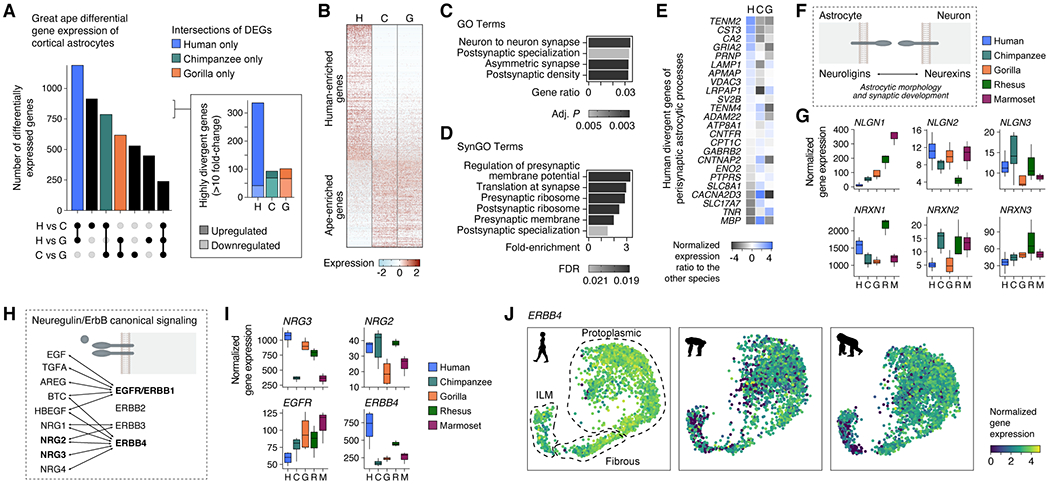
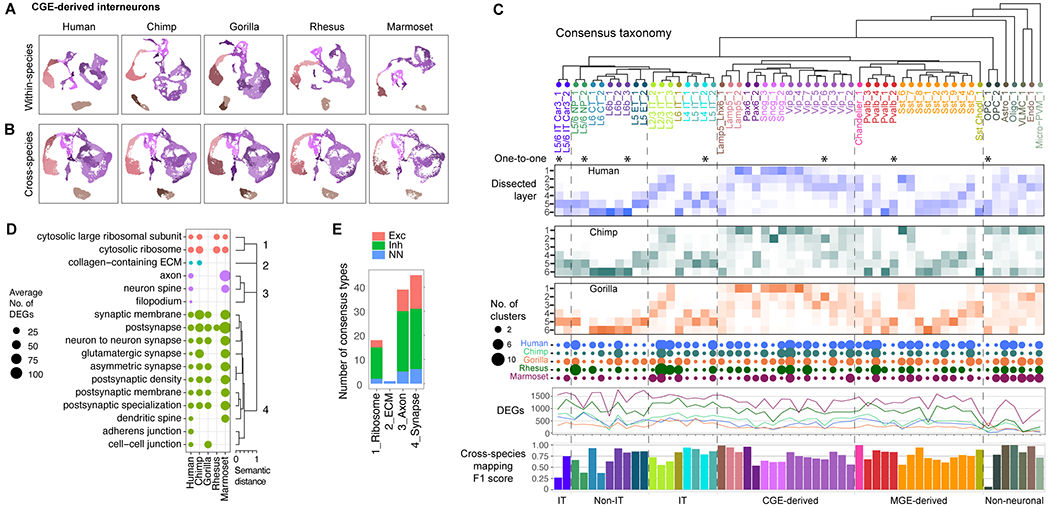
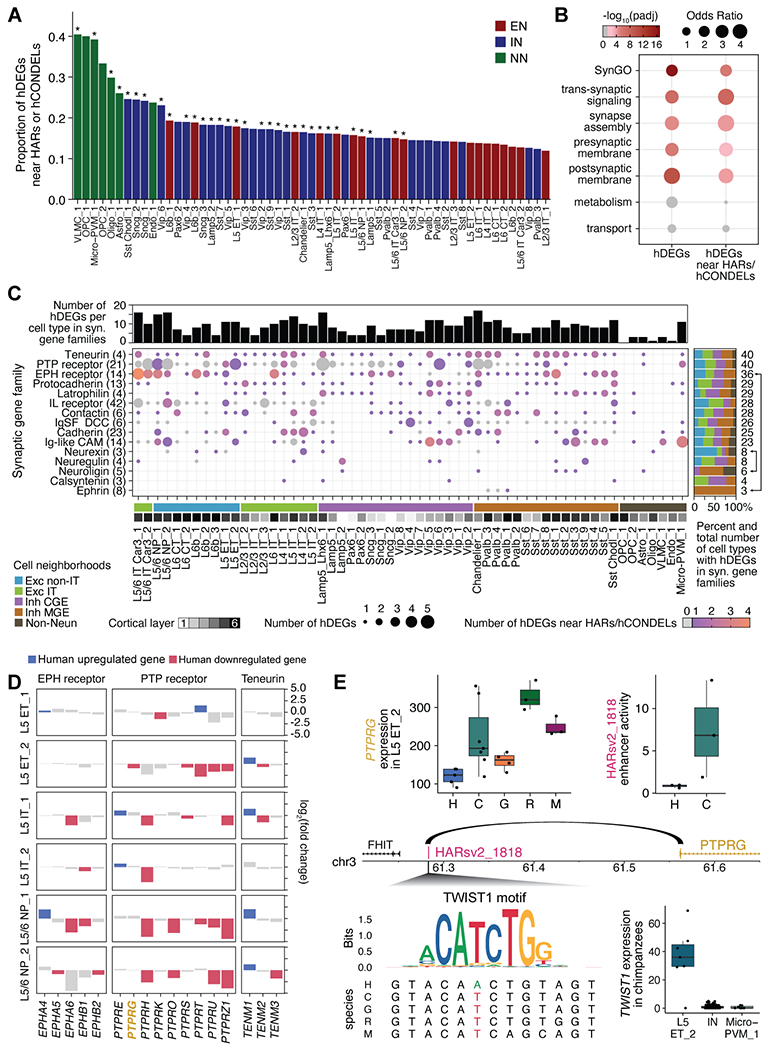
The cognitive abilities of humans are distinctive among primates, but their molecular and cellular substrates are poorly understood. We used comparative single-nucleus transcriptomics to analyze samples of the middle temporal gyrus (MTG) from adult humans, chimpanzees, gorillas, rhesus macaques, and common marmosets to understand human-specific features of the neocortex. Human, chimpanzee, and gorilla MTG showed highly similar cell-type composition and laminar organization as well as a large shift in proportions of deep-layer intratelencephalic-projecting neurons compared with macaque and marmoset MTG. Microglia, astrocytes, and oligodendrocytes had more-divergent expression across species compared with neurons or oligodendrocyte precursor cells, and neuronal expression diverged more rapidly on the human lineage. Only a few hundred genes showed human-specific patterning, suggesting that relatively few cellular and molecular changes distinctively define adult human cortical structure.


Conflict of interest statement

Competing interests: From April 11, 2022, N.L.J. is an employee of Genentech.

Figures

Fig. 1.
Fig. 1.. Transcriptomic cell type taxonomies of human and NHP MTG.
(A) Approximate MTG region dissected from human brain (inset). Representative Nissl-stained cross-sections of MTG in the five species profiled. (B) Phylogeny of species (left; MYA, millions of years ago) and barplots of QC-passing nuclei (center) and sampled individuals (right) for each dataset. (C) UMAP plots of single nuclei from human MTG integrated across individuals and RNA-seq technologies and colored by cluster, individual id, and dissected layer. (D) Human taxonomy dendrogram based on Cv3 cluster median expression. Heatmap of laminar distributions estimated from SSv4 layer dissections. Violin plots of the relative cortical depth (pia to white matter) of cells grouped by type based on in situ measurement of marker expression in human MTG. Dot plot of cell type abundance represented as a proportion of class (excitatory, inhibitory, glia). Error bars denote standard deviation across Cv3 individuals (L5 only dissection excluded). Barplots indicate the proportion of each cluster that is composed of Cv3 all layers, Cv3 layer 5 only, and SSv4 layer dissected datasets. Barplots indicating the proportion of each cluster that is composed of each individual. Violin plots showing the number of unique genes detected from Cv3 datasets.
Fig. 2.
Fig. 2.. Great ape specialization of L5/6 IT Car3 neuron proportions.
(A) Average subclass proportions of neuronal classes (whiskers, standard deviation across individuals). Significant differences in proportions compared to human (two-sided t-tests; Benjamini-Hochberg corrected * P < 0.05, ** P < 0.01, *** P < 0.001). (B) UMAPs of L5/6 IT Car3 neurons labeled by individual, CUX2 expression, and subtype. (C) Conserved marker gene expression of High-CUX2 and Low-CUX2 subtypes. (D) Average proportions of L5/6 IT Car3 neuron subtypes (whiskers, standard deviation across individuals). (E) Laminar distributions of subtypes across great apes estimated based on layer dissections. (F) L5/6 IT Car3 neurons labeled in situ based on marker expression in human and macaque MTG and in the matching regions in marmoset cortex (TPO and TE3). Low-CUX2 neurons are enriched at the layer 5/6 border in human and macaque. Red asterisk, area of low probe density due to a technical artifact. STG, superior temporal gyrus. Au, auditory cortex. (G) UMAPs of CUX2 expression in L5/6 IT Car3 neurons from matched cortical regions in humans (purple, high expression) and marmosets (dark orange, high expression).
Fig. 3.
Fig. 3.. Rapid divergence of neuronal expression on the human lineage.
(A) Boxplot showing the distribution of subclass marker genes across species. Points denote the number of species markers and black triangles denote the number of conserved markers. (B) Expression heatmap for 924 conserved markers shown in A. Expression is row-scaled for each subclass for each species. (C) Heatmaps showing Spearman correlations of subclass median expression for all variable genes between species. (D) Line graph of subclass correlations from D for humans compared to each NHP as a function of the evolutionary distance (millions of years ago) of the most recent common ancestor (13). The zero point denotes the median correlation between human individuals for each subclass. (E) Boxplots of great ape pairwise correlations for neuronal and non-neuronal subclasses from C. ANOVA and post-hoc two-sided t-tests; Benjamini-Hochberg corrected *P < 0.05. Non-neuronal ANOVA was not significant.
Fig. 4.
Fig. 4.. Human cortical astrocytes have specialized molecular features.
(A) Upset plot showing the number of DEGs in cortical astrocytes for pairwise comparisons between great ape species. Inset shows the number of highly divergent genes (fold-change > 10). (B) Heatmap showing row-scaled expression of human versus chimpanzee and gorilla DEGs. (C,D) Significantly enriched GO (C) and SynGO (D) terms in the union of astrocyte DEGs from the pairwise comparison between human and chimpanzee and the pairwise comparison between human and gorilla (FDR < 0.05). (E) Heatmap showing human DEGs (FDR < 0.01, normalized gene count > 5) of the proteome of perisynaptic astrocytic processes (Takano et al., 2020). (F) Schematic illustrating the trans-cellular interaction of astrocytic neuroligins and neuronal neurexins that is known to play a role in astrocytic morphology and synaptic development. (G) Box plots showing differential gene expression of neuroligins and neurexins in astrocytes across primate species. (H) Schematic illustrating ligand-receptor interactions of the neuregulin/ErbB signaling pathway. (I) Box plots showing differential expression of the ligands NRG2 and NRG3 and the receptors EGFR and ERBB4 in astrocytes across primate species. (J) Gene expression patterns of ERBB4 across astrocyte subtypes and great ape species. ILM, interlaminar.
Fig. 5.
Fig. 5.. Divergent expression across conserved cell types.
(A) UMAPs of CGE-derived interneuron expression generated for each species and colored by within-species cell types. (B) UMAPs of CGE interneuron expression integrated across the five species and with the same coloring as A. (C) Consensus taxonomy of 57 homologous cell types identified in all five species (*, one-to-one match across all species). For great ape species, heatmaps denote the proportion of nuclei dissected from layers 1 through 6 for each type. Dot plot denotes the number of within-species clusters that are associated with each consensus type. Line plots show the number of hDEGs per consensus type with fold-change (FC) > 1.4 for each species (colors as in dot plot). Barplots show the average classification accuracy (F1 score) across the five species using scPoli (84) (Fig. S12). (D) Summary of GO enrichment analysis of species DEGs. Cellular component terms are shown that were significantly enriched for hDEGs in at least one consensus type and form four distinct groups of similar GO terms. (E) Summary of the number of consensus types that express hDEGs that were enriched for at least one term in the four semantic GO groups.
Fig. 6.
Fig. 6.. HARs and hCONDELs are enriched near hDEGs.
(A) Asterisks indicate HARs and hCONDELs that are enriched near hDEGs in specific consensus cell types at 5% FDR. EN: excitatory neuron, IN: inhibitory neuron, NN: non-neuronal. (B) hDEGs, as well as hDEGs near HARs or hCONDELs, are enriched for genes annotated in specific SynGO terms (28). Non-significant associations are in gray. (C) Synaptic gene families with highly divergent expression patterns. Brackets on the far right highlight examples of synaptic gene families with trans-synaptic interactions that show human differential gene expression in cell types known to form canonical cortical circuits. (D) Patterns of expression change between humans and NHPs for three highly-divergent families in consensus types of L5 excitatory neurons. (E) PTPRG has decreased expression in human L5 ET_2 (each point represents normalized pseudobulk gene expression per individual). Its promoter interacts with the intergenic region containing HARsv2_1818 (16), which has decreased enhancer activity in human SH-SY5Y cells (14). A base pair change in the human HARsv2_1818 sequence removes a potential binding site for TWIST1, which is highly expressed in L5 ET_2.

References

    1. Papeo L, Agostini B, Lingnau A, The Large-Scale Organization of Gestures and Words in the Middle Temporal Gyrus. J. Neurosci 39, 5966–5974 (2019). - PMC - PubMed
    1. Özyürek A, Hearing and seeing meaning in speech and gesture: insights from brain and behaviour. Philos. Trans. R. Soc. Lond. B Biol. Sci 369, 20130296 (2014). - PMC - PubMed
    1. Kozlenkov A, Vermunt MW, Apontes P, Li J, Hao K, Sherwood CC, Hof PR, Ely JJ, Wegner M, Mukamel EA, Creyghton MP, Koonin EV, Dracheva S, Evolution of regulatory signatures in primate cortical neurons at cell-type resolution. Proc. Natl. Acad. Sci. U. S. A 117, 28422–28432 (2020). - PMC - PubMed
    1. Roumazeilles L, Eichert N, Bryant KL, Folloni D, Sallet J, Vijayakumar S, Foxley S, Tendler BC, Jbabdi S, Reveley C, Verhagen L, Dershowitz LB, Guthrie M, Flach E, Miller KL, Mars RB, Longitudinal connections and the organization of the temporal cortex in macaques, great apes, and humans. PLoS Biol. 18, e3000810 (2020). - PMC - PubMed
    1. Ardesch DJ, Scholtens LH, Li L, Preuss TM, Rilling JK, van den Heuvel MP, Evolutionary expansion of connectivity between multimodal association areas in the human brain compared with chimpanzees. Proc. Natl. Acad. Sci. U. S. A 116, 7101–7106 (2019). - PMC - PubMed