. 2023 Oct 13;382(6667):eadf7044.
doi: 10.1126/science.adf7044. Epub 2023 Oct 13.

A comparative atlas of single-cell chromatin accessibility in the human brain

Affiliations

A comparative atlas of single-cell chromatin accessibility in the human brain

Yang Eric Li et al. Science. .

Abstract

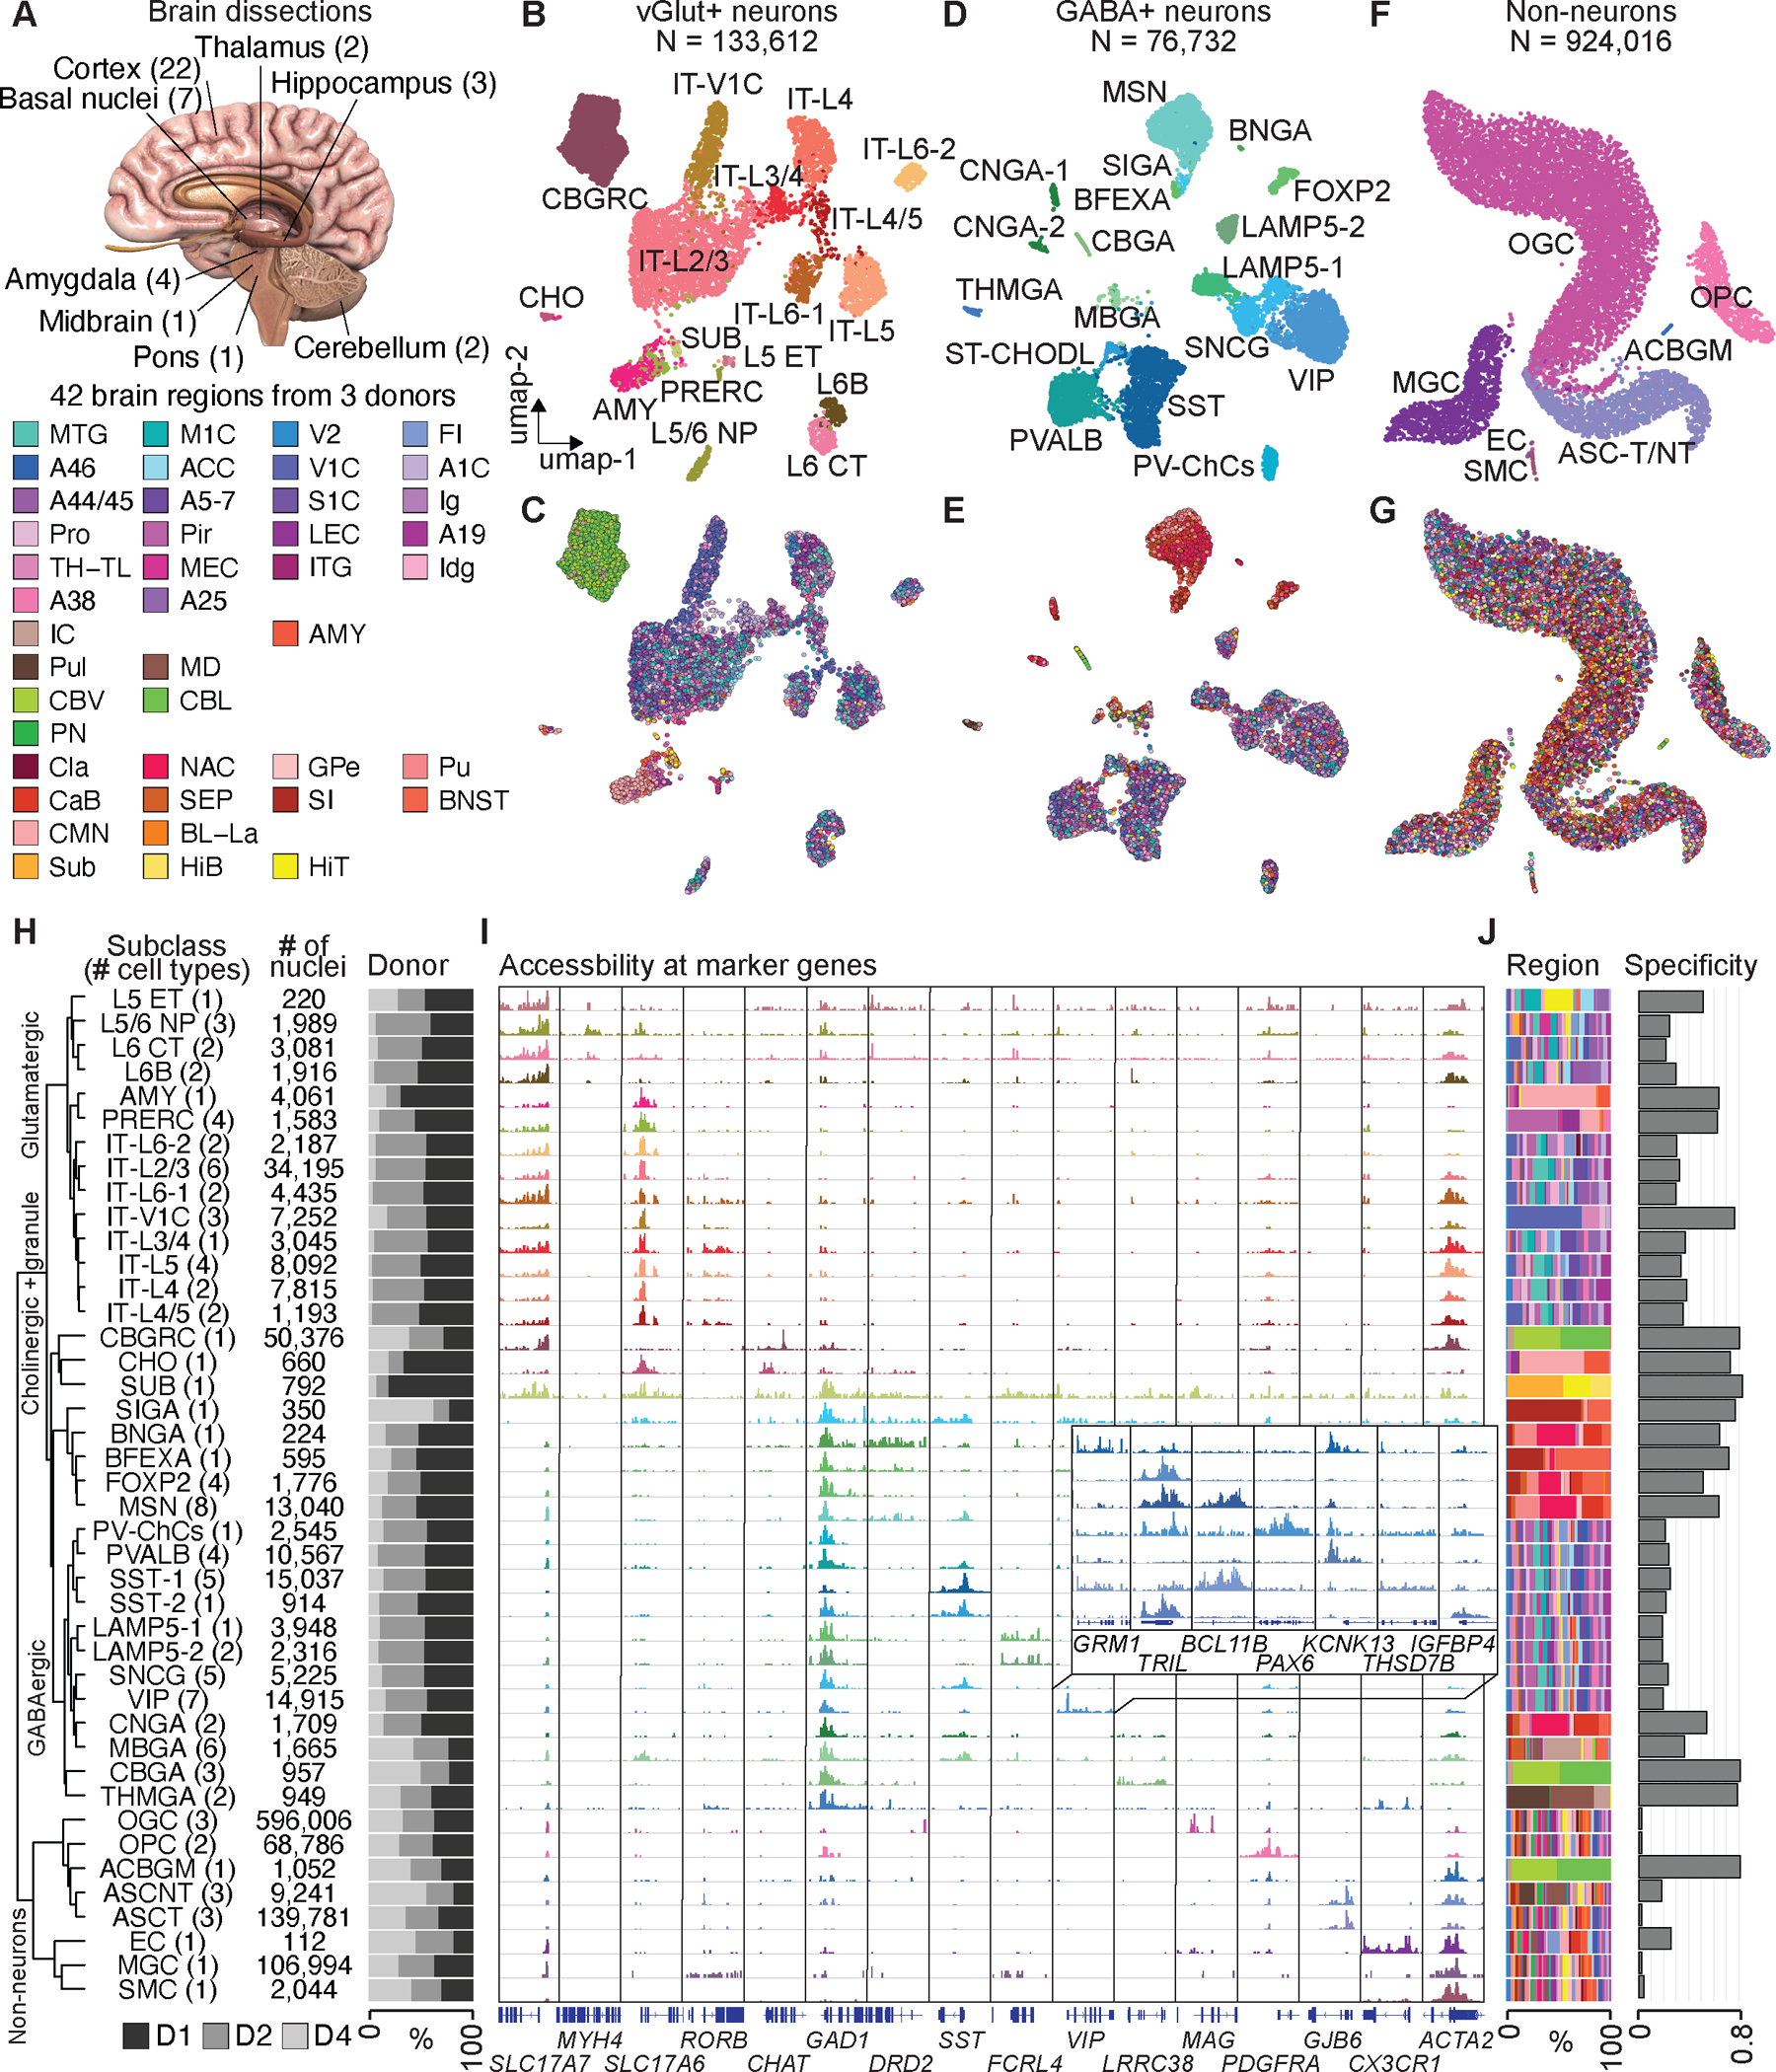
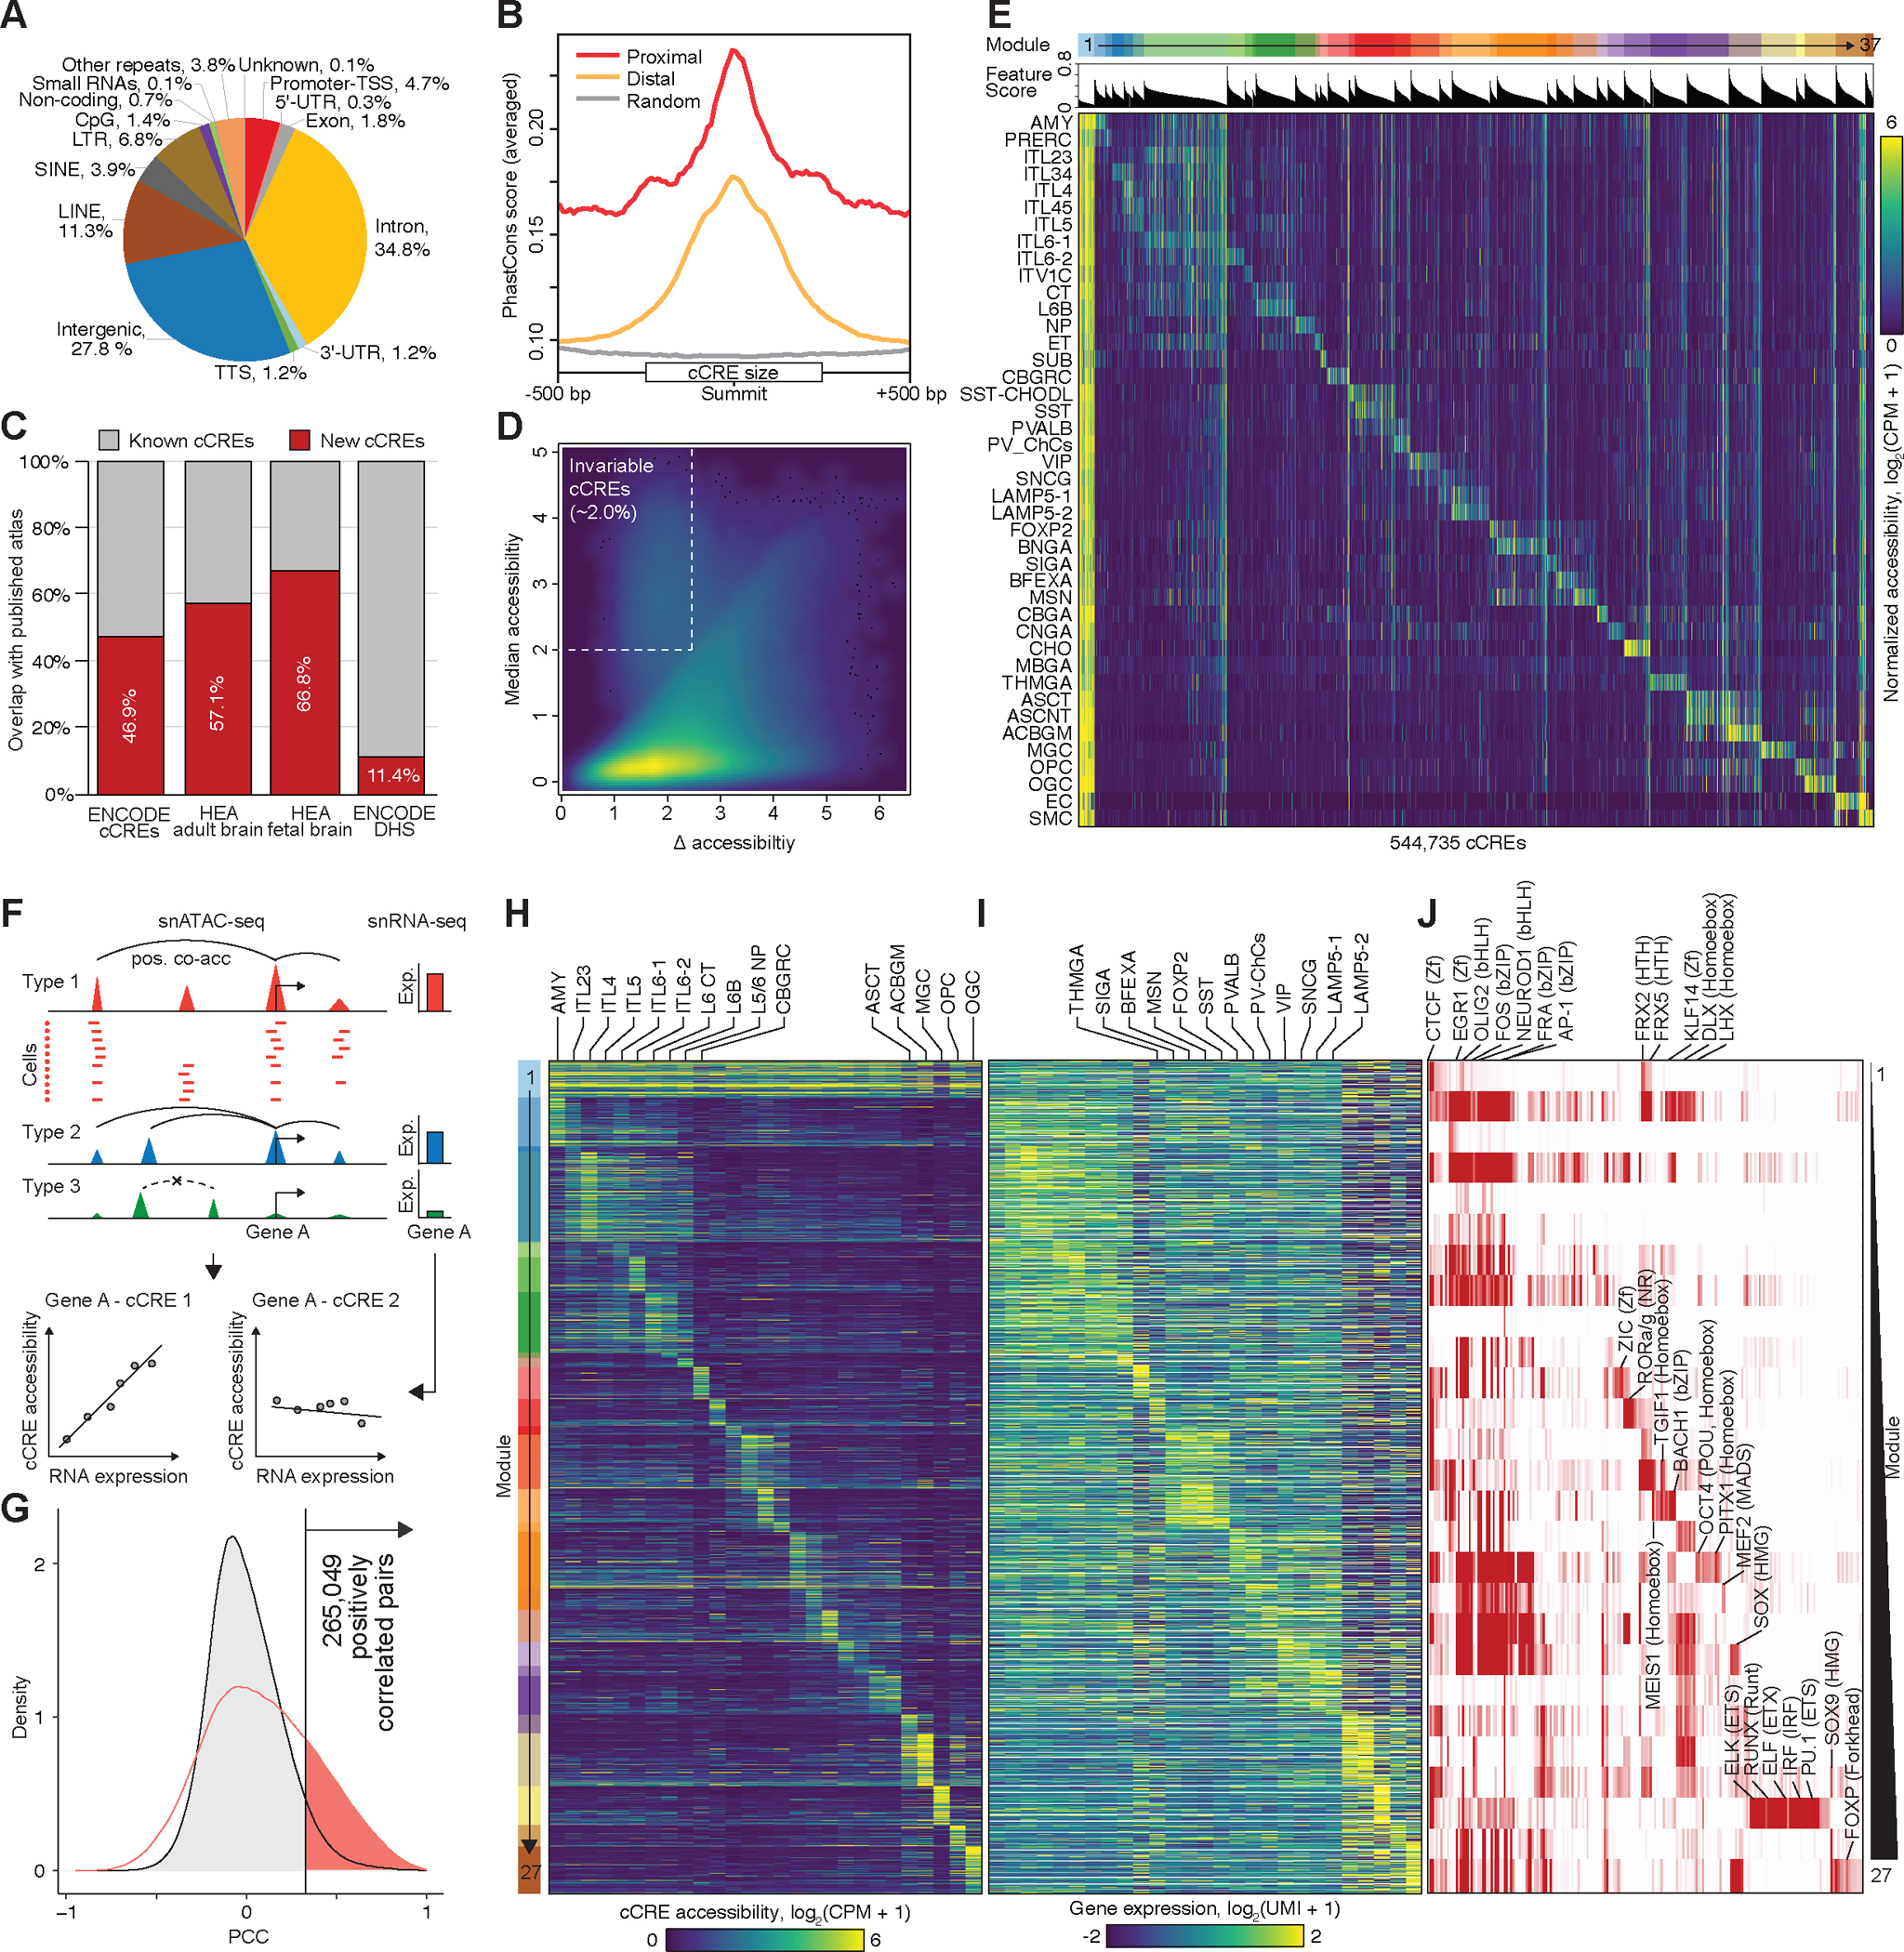
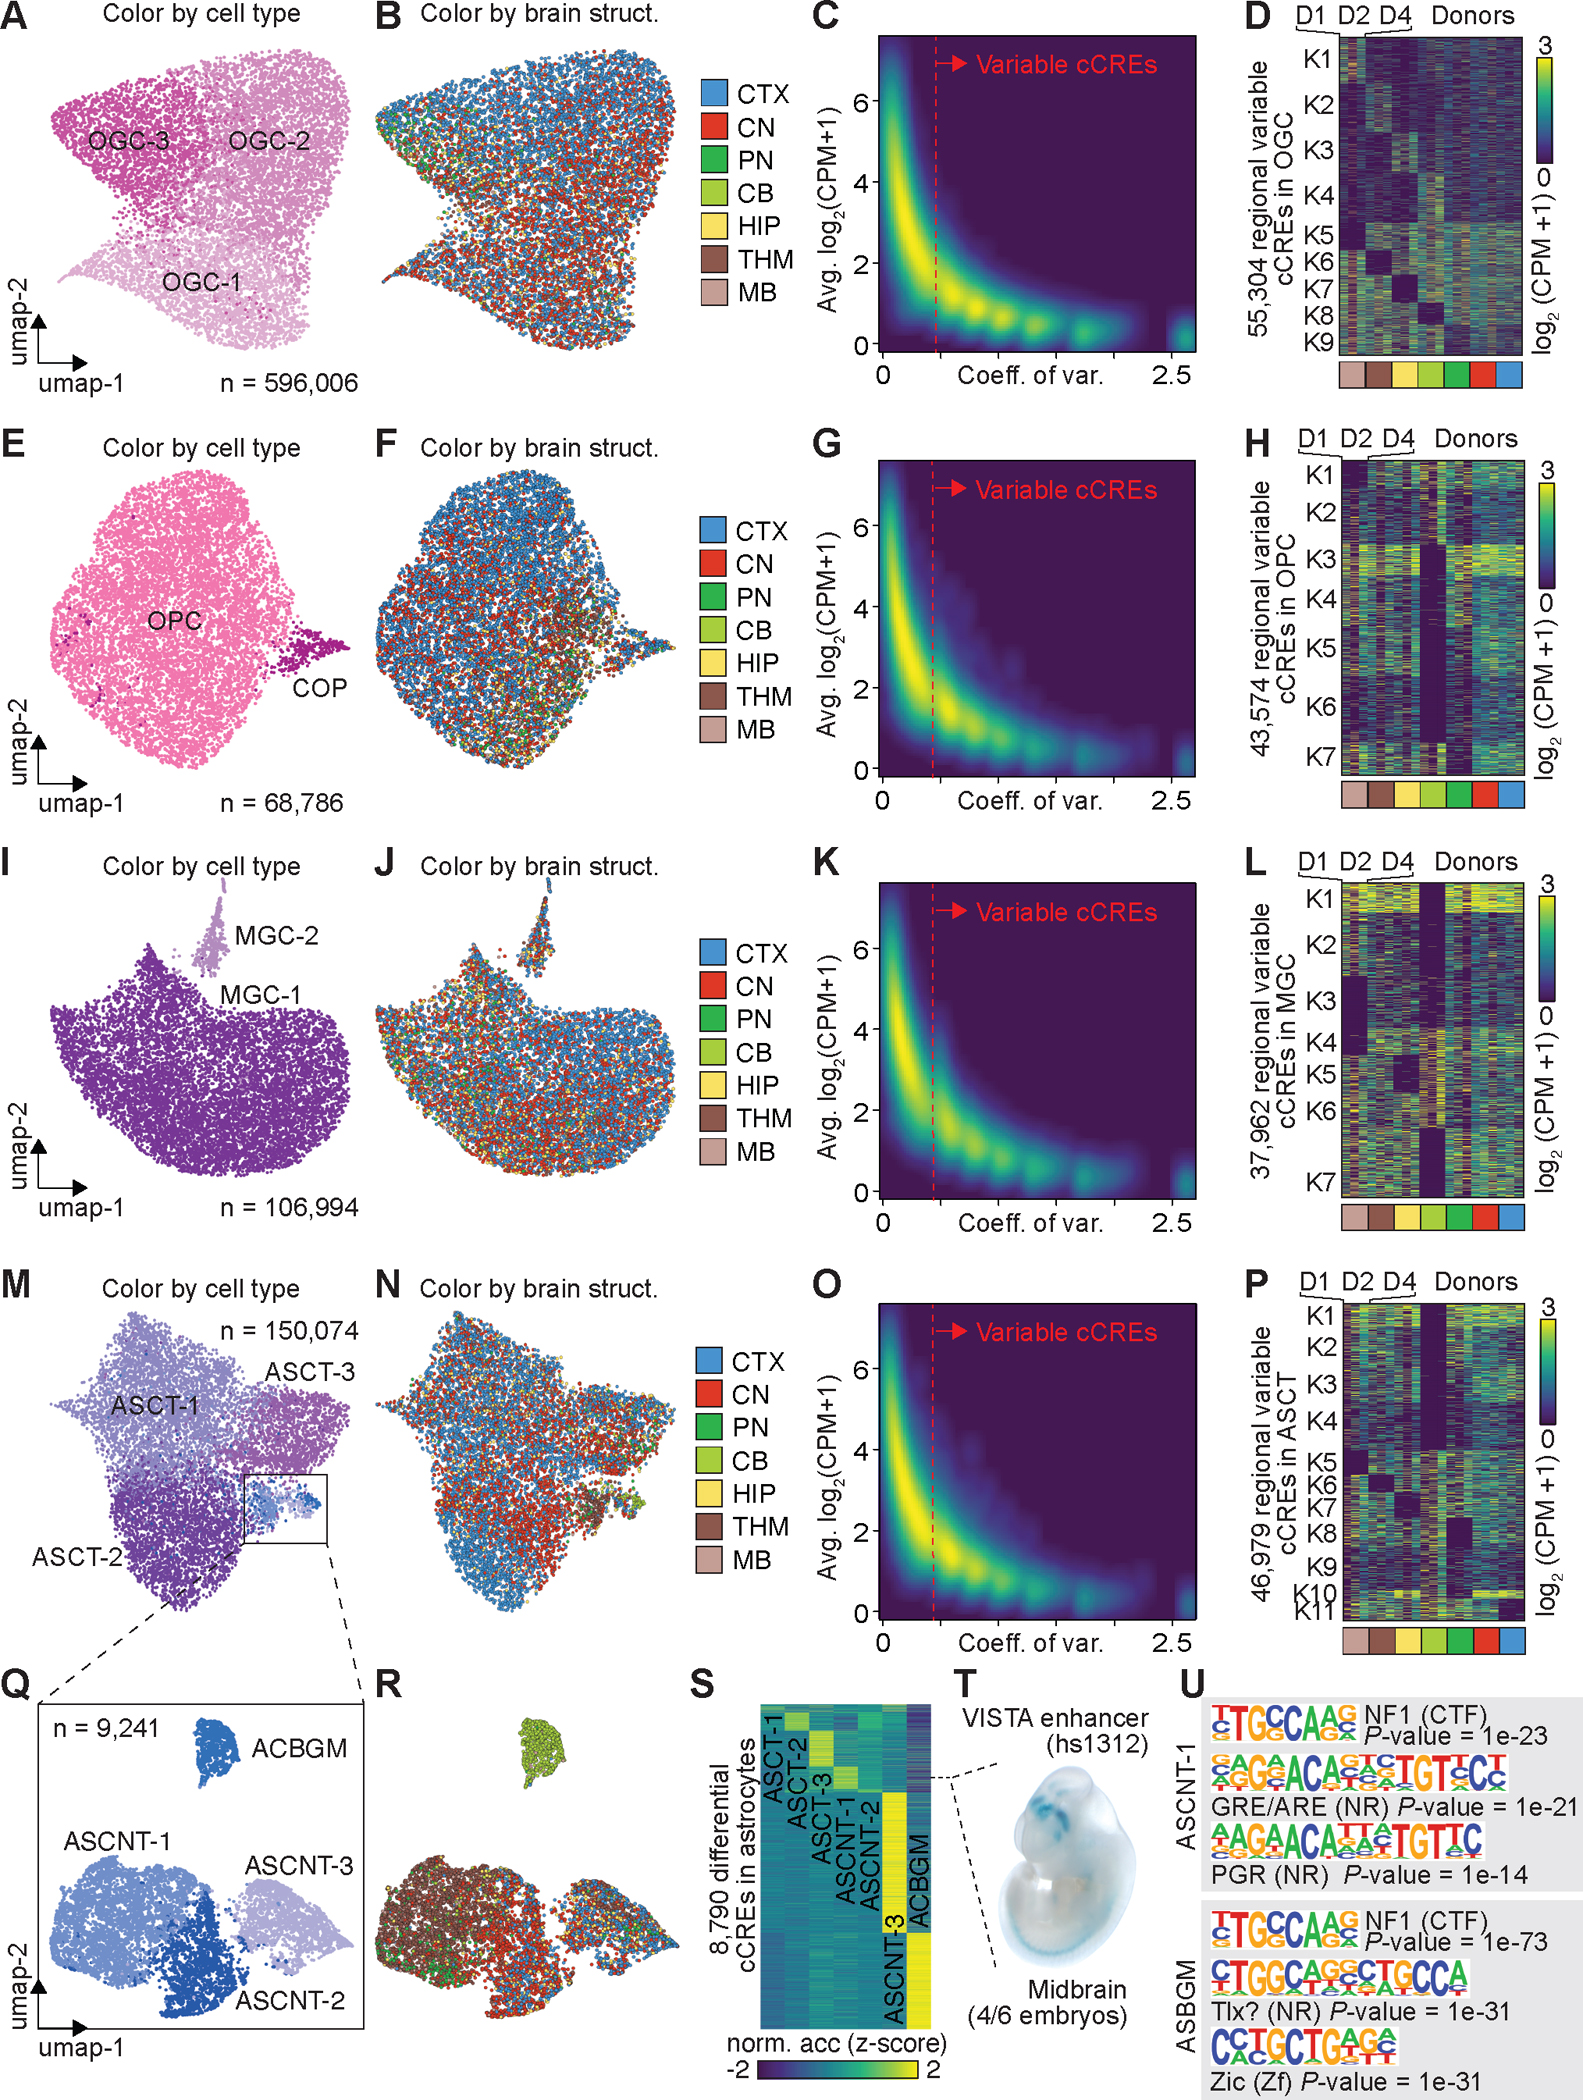
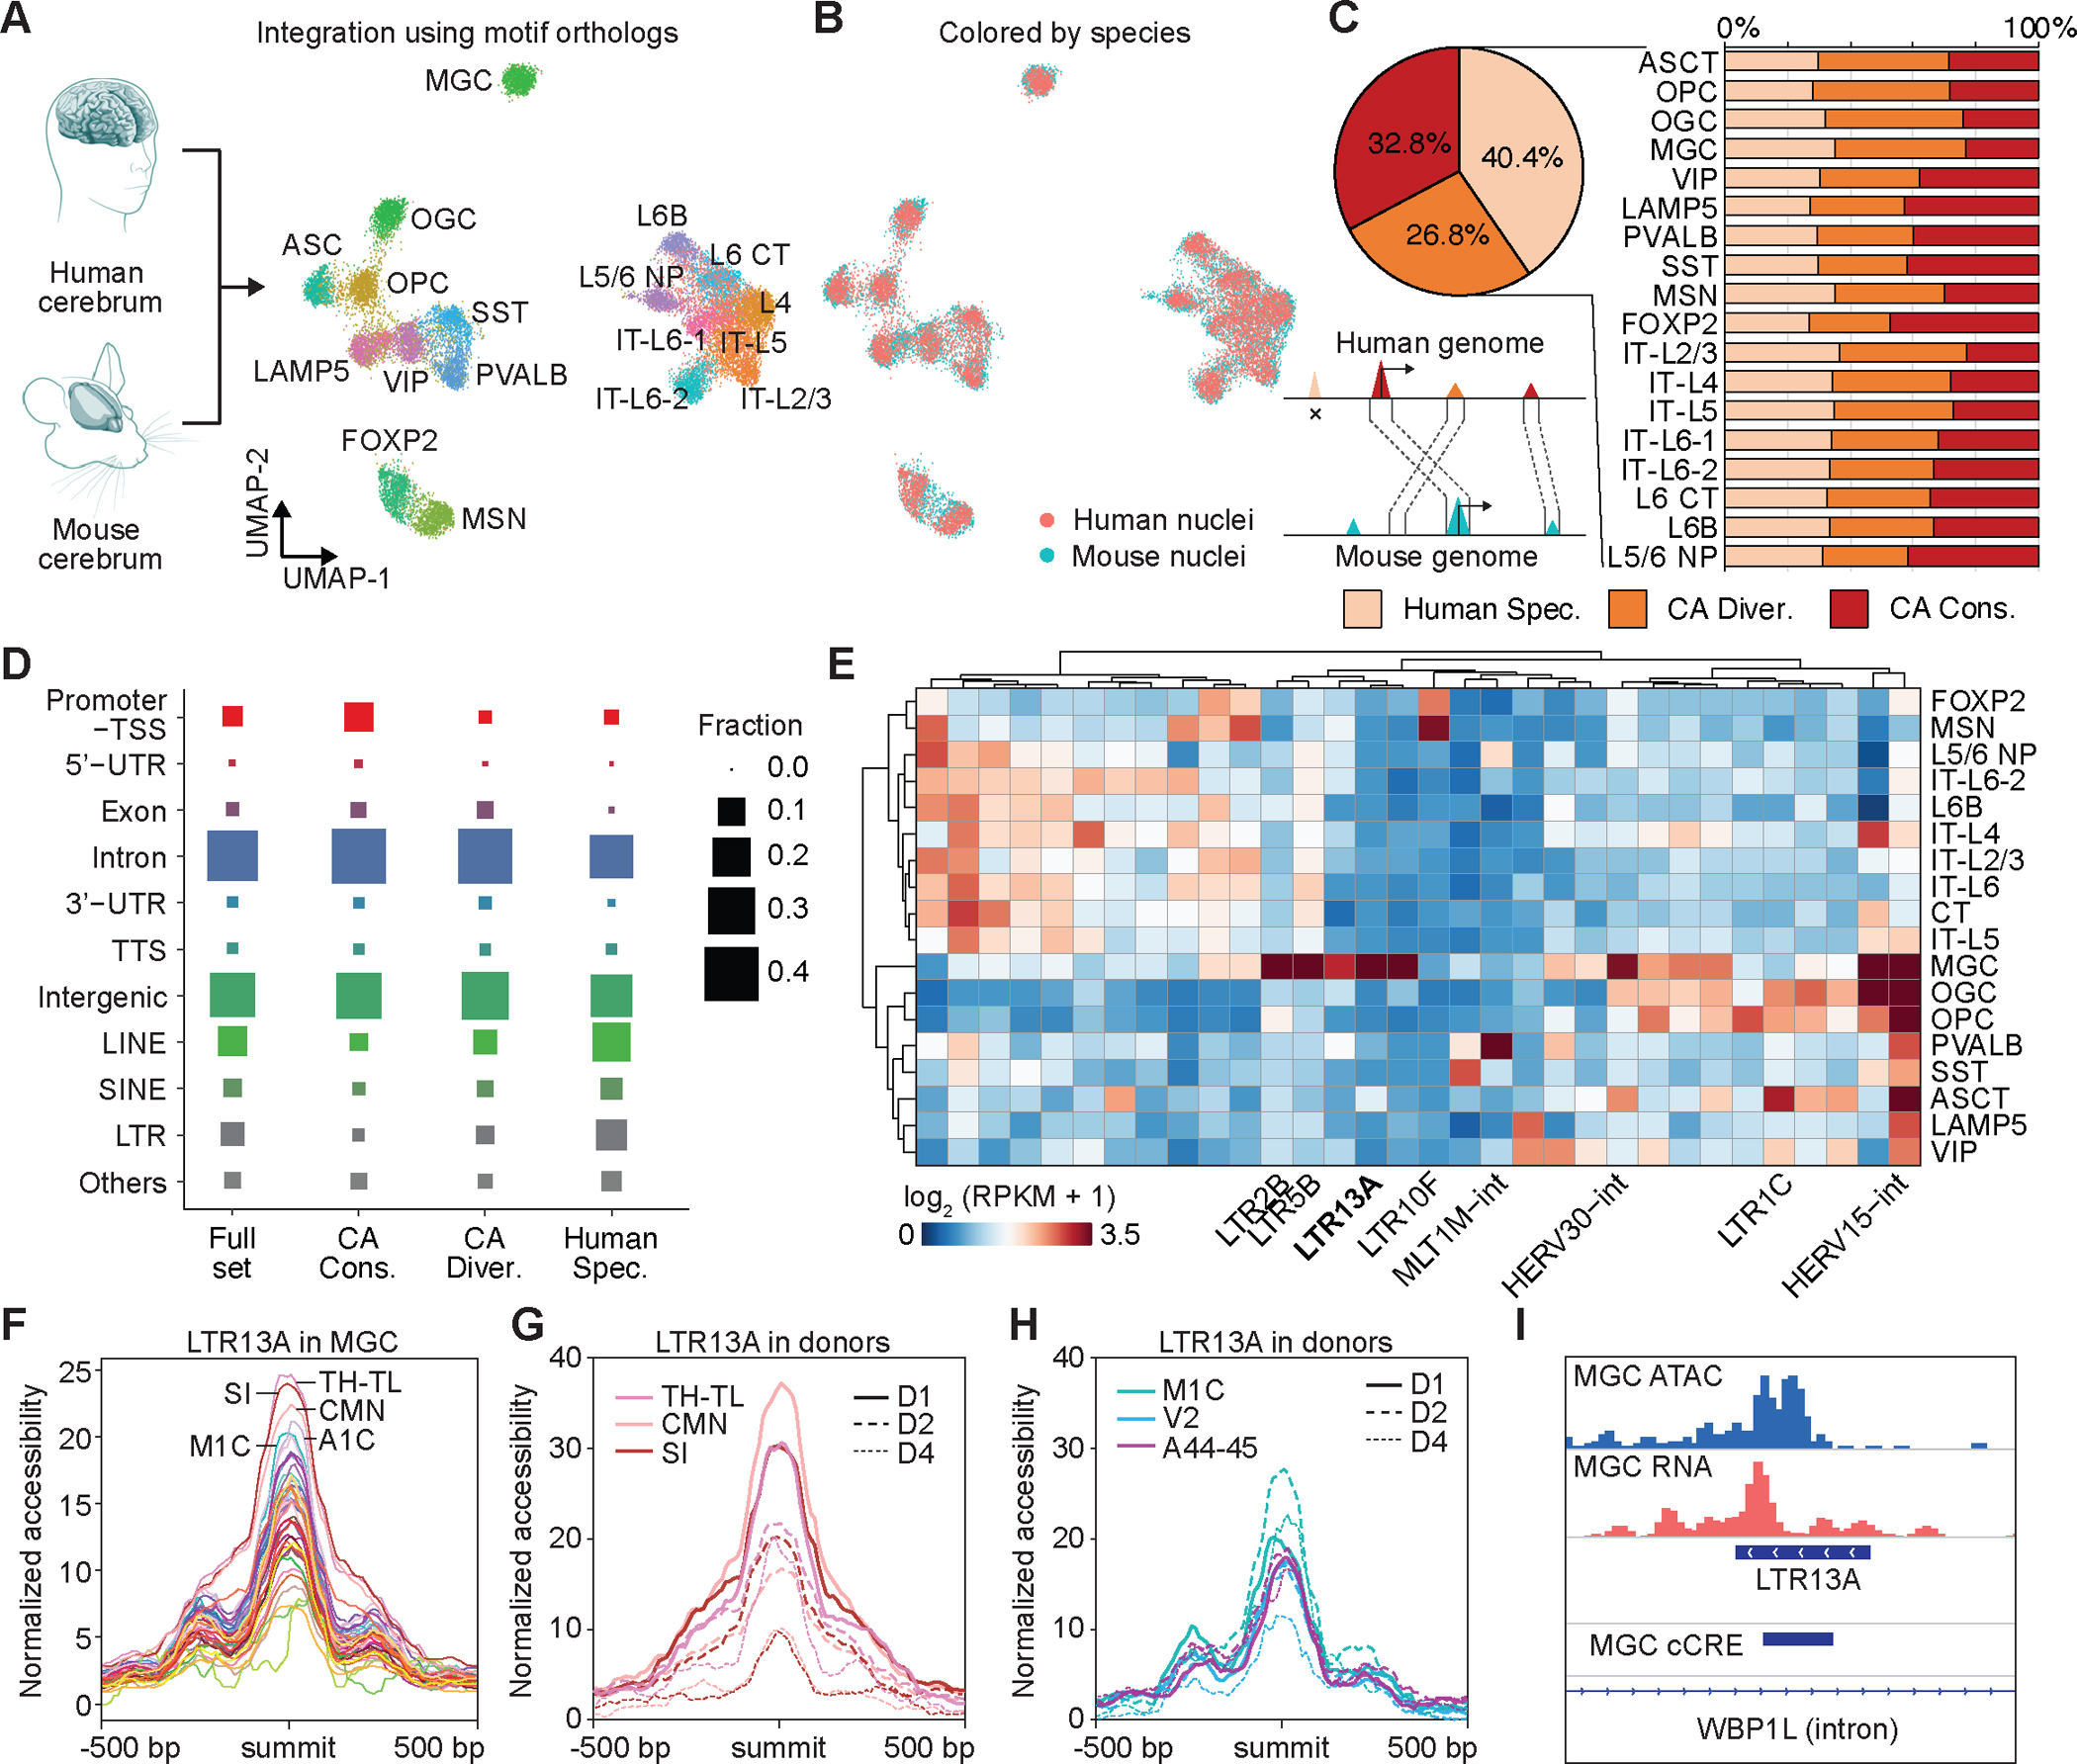
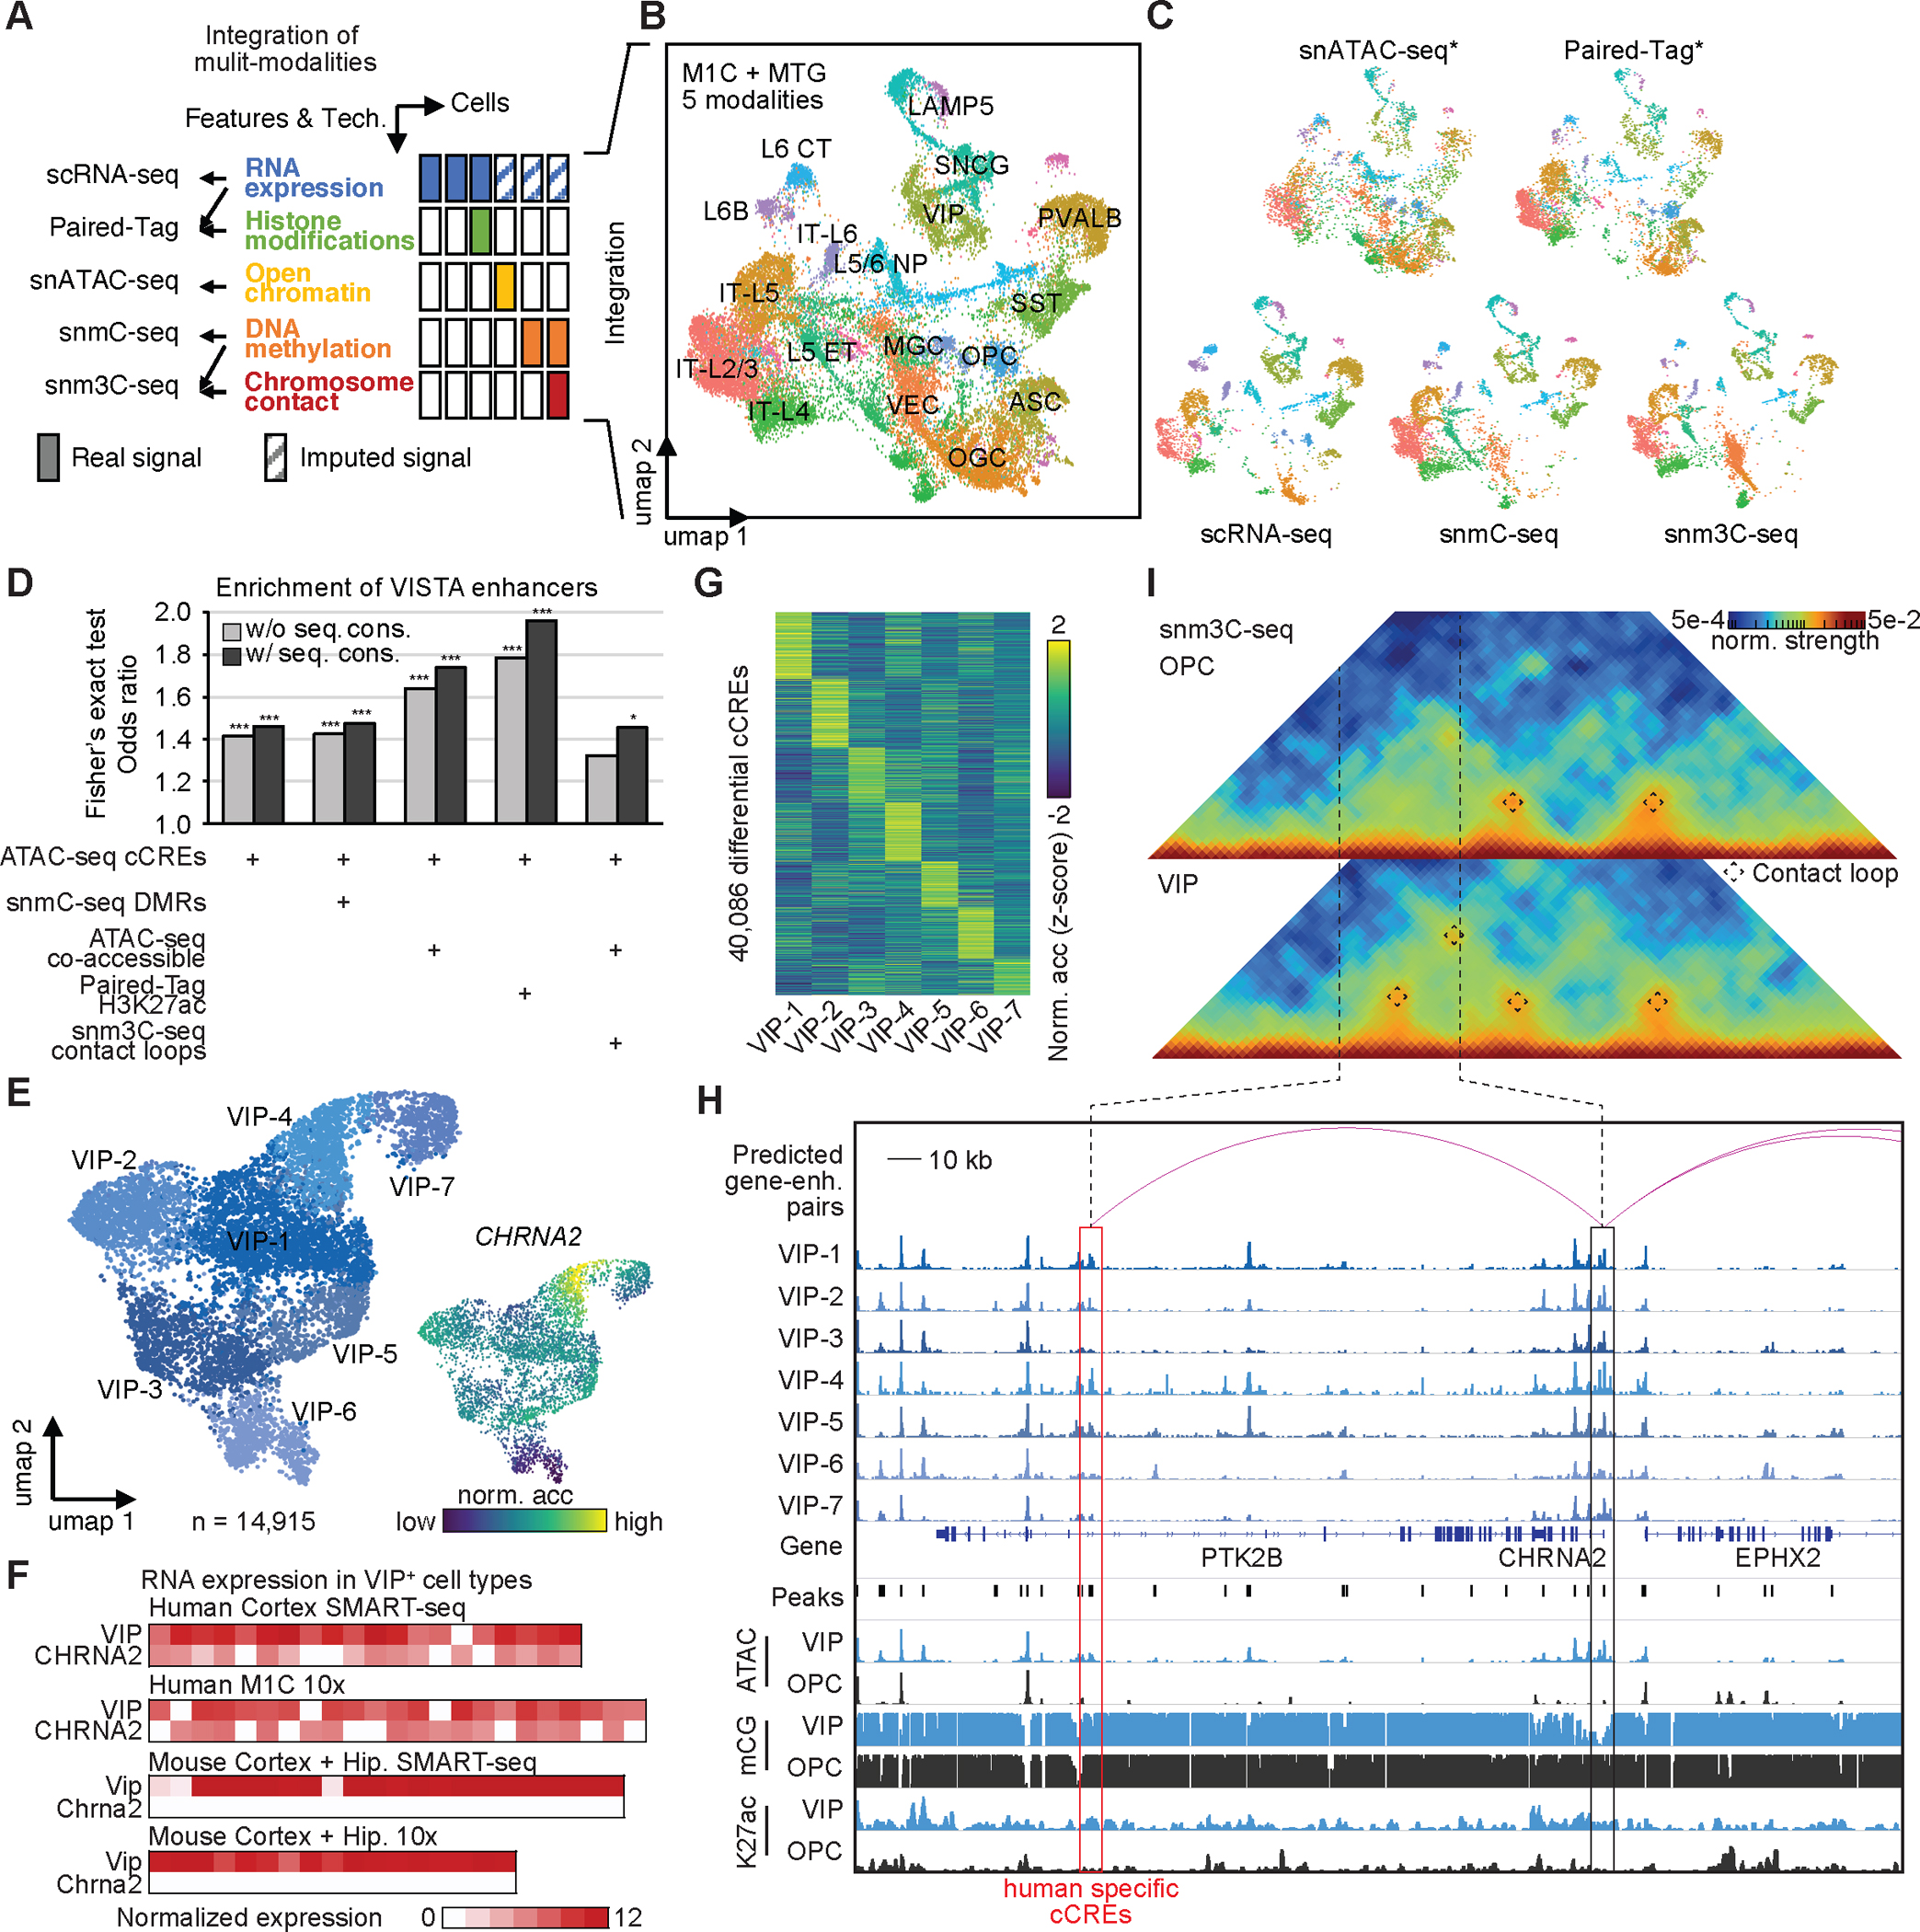
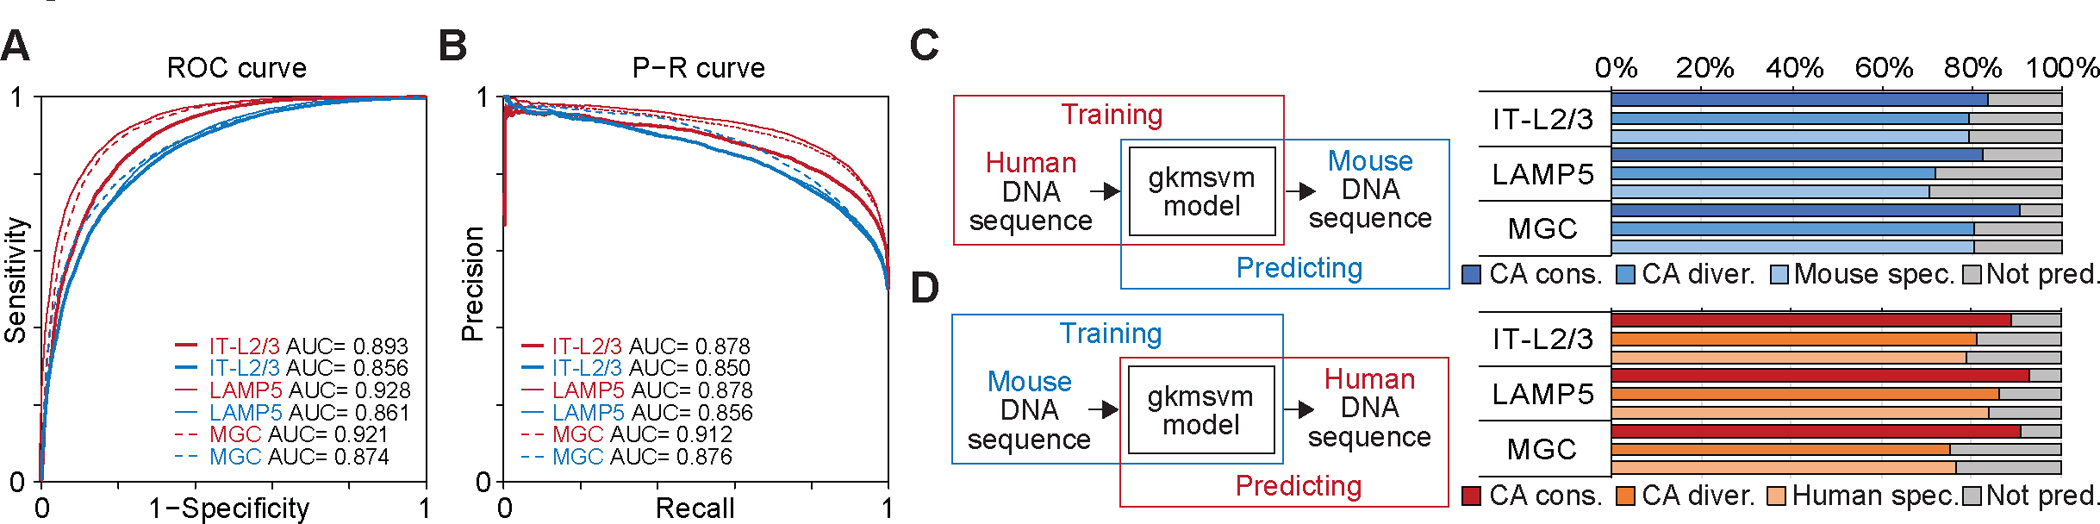
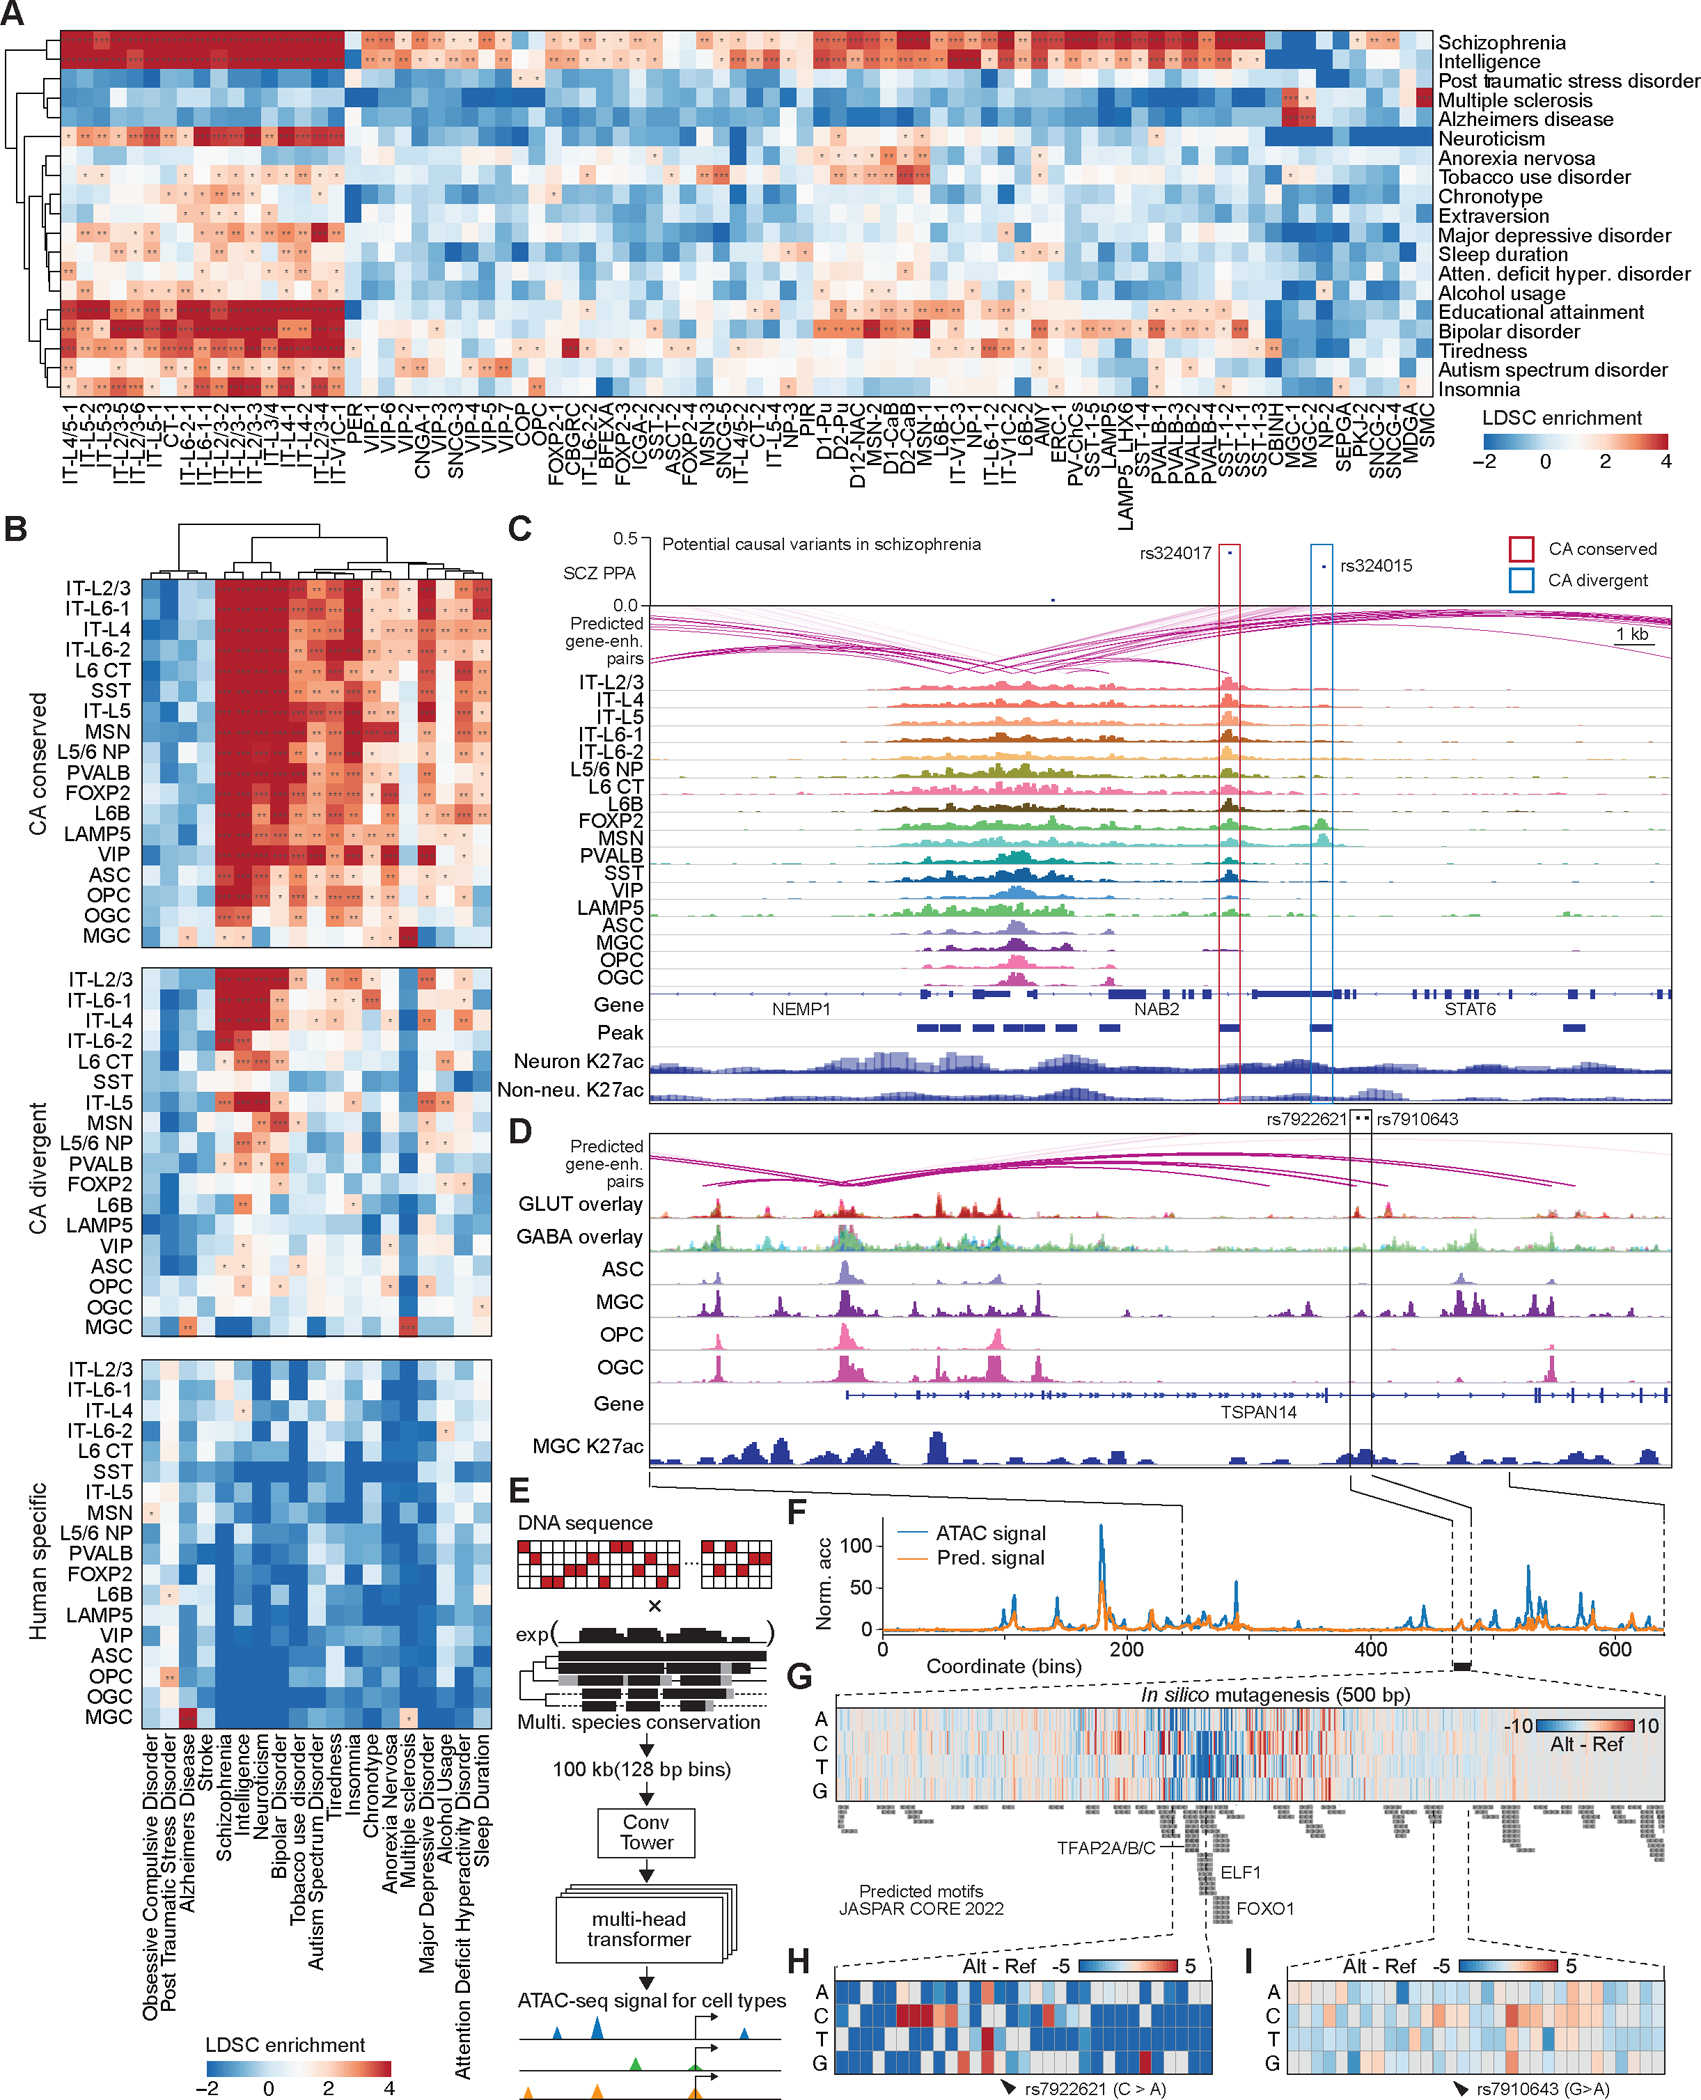
Recent advances in single-cell transcriptomics have illuminated the diverse neuronal and glial cell types within the human brain. However, the regulatory programs governing cell identity and function remain unclear. Using a single-nucleus assay for transposase-accessible chromatin using sequencing (snATAC-seq), we explored open chromatin landscapes across 1.1 million cells in 42 brain regions from three adults. Integrating this data unveiled 107 distinct cell types and their specific utilization of 544,735 candidate cis-regulatory DNA elements (cCREs) in the human genome. Nearly a third of the cCREs demonstrated conservation and chromatin accessibility in the mouse brain cells. We reveal strong links between specific brain cell types and neuropsychiatric disorders including schizophrenia, bipolar disorder, Alzheimer's disease (AD), and major depression, and have developed deep learning models to predict the regulatory roles of noncoding risk variants in these disorders.


Conflict of interest statement

Conflict of interst statement: B.R. is a consultant of and has equity interests in Arima Genomics, Inc. B.R. is also a co-founder of Epigenome Technologies Inc. S.L. is a paid scientific advisor to Moleculent, Combigene, and the Oslo University Center of Excellence in Immunotherapy.

Figures

Fig. 1.
Fig. 1.. Single-cell analysis of chromatin accessibility in the human brain
(A) Schematic of sampling strategy and 42 brain dissections. A detailed list of regions is provided in Table S1. (B) Uniform manifold approximation and projection (UMAP) embedding and clustering analysis of glutamatergic neurons from snATAC-seq data. Individual nuclei are colored and labelled by cell subclasses. A full list and description of cell subclass labels are provided in Tables S3. (C) UMAP embedding of glutamatergic neurons, colored by brain regions. (D) UMAP embedding and clustering analysis of GABAergic neurons, colored by cell subclasses. (E) UMAP embedding of GABAergic neurons, colored by brain regions. (F) UMAP embedding and clustering analysis of non- neurons, colored by cell subclasses. (G) UMAP embedding of non-neurons, colored by brain regions. (H) Left, hierarchical organization of 42 cell subclasses on chromatin accessibility. Middle, the number of nuclei in each subclass. Right, Bar chart representing the relative contribution of 3 donors to each cell subclass. (I) Genome browser tracks of aggregate chromatin accessibility profiles for each subclass at selected marker gene loci that were used for cell cluster annotation. A full list and description of subclass annotations are in Table S4. (J) Left, bar chart representing the relative contribution of brain regions to cell subclasses. Right, regional specificity scores of cell subclasses.
Fig. 2:
Fig. 2:. Identification and characterization of candidate CREs (cCREs) across human brain cell types
(A) Pie chart showing the fraction of cCREs that overlaps with different classes of annotated sequences in the human genome. TSS, transcription start site; TTS, transcription termination site. UTR, untranslated region. LINE, long interspersed nuclear element. SINE, short interspersed nuclear element. LTR, long terminal repeats. (B) Average phastCons conservation scores of proximal (in red) and distal cCREs (in yellow), and random genomic background is indicated in gray. (C) Stacked bar plot showing the percentage of new cCREs defined in this study (in red) and percentage of cCREs that overlapped with public recourse (in grey), including the cCREs and DHSs in the SCREEN database, cCREs identify in human enhancer atlas (HEA) fetal and adult brain. (D) Density map comparing the median and maximum variation of chromatin accessibility at each cCRE across cell types. Each dot represents a cCRE. (E) Heat map showing association of the 42 subclasses (rows) with 37 cis-regulatory modules (top, from left to right). Columns represent cCREs. A full list of subclass or module associations is in Table S9, and the association of cCREs to modules is in Table S10. CPM, counts per million. (F) Schematic overview of the computational strategy used to identify cCREs that are positively correlated with transcription of target genes. (G) In total, 265,049 pairs of positively correlated cCRE and genes (highlighted in red) were identified (FDR < 0.05). Grey filled curve shows distribution of Pearson’s correlation coefficient (PCC) for randomly shuffled cCRE–gene pairs. (H) Heat map showing chromatin accessibility of putative enhancers and (I) the expression of linked genes (right). Genes are shown for each putative enhancer separately. UMI, unique molecular identifier. (J) Enrichment of HOMER known transcription factor (TF) motifs in distinct enhancer–gene modules.
Fig. 3:
Fig. 3:. Regional specificity of cell types correlates with chromatin accessibility.
(A) UMAP embedding of cell types of oligodendrocytes (OGCs). (B) UMAP embedding of oligodendrocytes, colored by major brain structures. CTX, cortex; CN, cerebral nuclei; PN, Pons; CB, cerebellum; HIP, hippocampus; THM, thalamus; MB, midbrain. (C) Density scatter plot comparing the averaged accessibility and coefficient of variation across brain structures at each cCRE. Variable cCREs for OGCs are defined on the right side of dash line. (D) Heat map showing the normalized accessibility of variable cCREs in OGCs across major brain structures. CPM, counts per million. (E) UMAP embedding of cell types of oligodendrocyte precursor cells (OPCs). (F) UMAP embedding of OPCs, colored by major brain structures. (G) Density scatter plot comparing the averaged accessibility and coefficient of variation across brain structures at each cCRE. Variable cCREs for OPCs are defined on the right side of dash line. (H) Heat map showing the normalized accessibility of variable cCREs in OPCs. (I) UMAP embedding of cell types of microglia (MGC). (J) UMAP embedding of MGC, colored by major brain structures. (K) Density scatter plot comparing the averaged accessibility and coefficient of variation across brain structures at each cCRE. Variable cCREs for MGC are defined on the right side of dash line. (L) Heat map showing the normalized accessibility of variable cCREs in MGC. (M) UMAP embedding of cell types of astrocytes (ASCs). (N) UMAP embedding of ASCs, colored by major brain structures. (O) Density scatter plot comparing the averaged accessibility and coefficient of variation across brain structures at each cCRE. Variable cCREs for ASCs are defined on the right side of dash line. (P) Heat map showing the normalized accessibility of variable cCREs in ASCs. (Q) UMAP embedding of non-telencephalon ASCs (ASCNTs). (R) UMAP of ASCNTs, colored by major brain structures. (S) Normalized chromatin accessibility of 8,790 cell-type-specific cCREs. (T) Representative images of transgenic mouse embryos showing LacZ reporter gene expression under the control of the indicated enhancers that overlapped the differential cCRE in S (dotted line). Images were downloaded from the VISTA database (https://enhancer.lbl.gov). (U) Top enriched known motifs for astrocyte cell-type-specific cCREs.
Fig. 4:
Fig. 4:. Comparative analyses of chromatin accessibility between human and mouse cerebrum.
(A) UMAP co-embedding of 18 cell subclasses from both human and mouse cerebrum. (B) UMAP co-embedding of single nuclei colored by human and mouse. (C) Left, pie chart showing fraction of three categories of cCREs, including human specific, CA-divergent and CA-conserved cCREs. The CA-conserved cCREs are both DNA sequence conserved across species and have open chromatin in orthologous regions. The CA divergent cCREs are sequence conserved to orthologous regions but have not been identified as open chromatin regions in other species. Human specific cCREs are not able to find orthologous regions in the mouse genome. Right, bar plot showing three categories of cCREs in corresponding cell subclasses from human and mouse. (D) Dot plot showing fraction of genomic distribution of three categories of cCREs. (E) Normalized accessibility at variable human specific TEs in different cell subclasses. RPKM, reads per kilobase per million. (F) Average chromatin accessibility of LTR13A in microglia across different brain regions. (G) Variable chromatin accessibility of LTR13A across donors in microglia from different brain regions. (H) Invariable chromatin accessibility of LTR13A across donors in microglia from different brain regions. (L) Representative genomic locus showing chromatin accessibility and expression of LTE13A in microglia.
Fig. 5:
Fig. 5:. Integration of multi-modal single cell datasets of cortical cells.
(A) Summary of single cell technologies and multi-model data integration strategies. (B) UMAP embedding and integrative clustering analysis of 18 major cell types. (C) Co-embedding of multi-model single cell datasets showing excellent agreement. * for assays using unbiased sampling strategy. (D) The UpSet plot showing the enrichment of VISTA validated enhancer in different subsets of distal cCREs, which is defined by combining information/features from single-cell modalities or snATAC-seq only. These subsets include: (1) cCREs identified from snATAC-seq only; (2) snATAC-seq cCREs overlapped with differentially methylated regions (DMRs) identified from snmC-seq; (3) snATAC-seq distal cCREs that were predicted to be co-accessible with promoter across cells; (4) snATAC-seq distal cCREs marked by H3K27ac signals from Paired-Tag, a method for joint single cell analysis of histone modification and gene expression; and (5) snATAC-seq distal cCREs predicted to be co-accessible with promoters, and linked by chromatin loops identified in snm3C-seq assays. Then, we filtered out validated human enhancers in the forebrain from VISTA enhancer browser (https://enhancer.lbl.gov). By overlapping different subsets of distal cCREs, we observed various enrichment (odds ratios from Fisher’s exact test) with combination of different assays and features. Fisher’s exact test, *, p-value < 0.05, ***, p-value < 0.001. (E) Left, UMAP embedding of VIP positive (VIP+) GABAergic cell types. Upper right, colored by donors. Bottom right, normalized accessibility at gene CHRNA2. (F) Expression of gene VIP and CHRNA2 in human VIP+ cell types, and expression of gene Vip and Chrna2 in mouse VIP+ cell types from Allen Cell Types Database: RNA-Seq Data. (G) Normalized chromatin accessibility of 40,086 VIP+ cell-type-specific cCREs. (H) Genome browser track view at the CHRNA2 locus as an example for candidate enhancers predicted from single cell multi-model datasets. Displayed chromatin accessibility profiles from snATAC-seq; DNA methylation signals (mCG) from snm3C-seq; and histone modification signals (H3K27ac) from Paired-Tag for several VIP+ neurons and oligodendrocytes precursor cells (OPC). Red Arcs represent the predicted enhancer for gene CHRNA2. (I) Triangle heat map show chromatin contacts in VIP+ neurons and OPC derived from snm3C-seq data at gene CHRNA2 locus.
Fig. 6:
Fig. 6:. Epigenetic conservation and divergence of human orthologous cCREs
(A) Receiver operating characteristic (ROC) curve and area under curve (AUC) from gkmsvm models trained for representative human and mouse cell types. (B) Precision-recall curve (PRC) curve and area under curve (AUC) from gkmsvm models trained for representative human and mouse cell types. (C) Prediction for mouse epigenetic conserved, mouse CA-divergent, and mouse specific cCREs from gkmsvm models trained in corresponding human cell subclasses. (D) Prediction for human epigenetic conserved, human CA-divergent, and human specific cCREs from gkmsvm models trained in corresponding mouse cell subclasses.
Fig. 7:
Fig. 7:. Interpreting noncoding risk variant of neurological disorder and traits.
(A) Heat map showing enrichment of risk variants associated with neurological disorder and traits from genome wide association studies in human cell type-resolved cCREs. Cell-type specific linkage disequilibrium score regression (LDSC) analysis was performed using GWAS summary statistics. Total cCREs identified independently from each human cell type were used as input for analysis. P-values were corrected using the Benjamini Hochberg procedure for multiple tests. FDRs of LDSC coefficient are displayed. *, FDR < 0.05; **, FDR < 0.01; ***, FDR<0.001. Detailed results are reported in Table S26. (B) Heat map showing enrichment of risk variants associated with mental disorder and traits in three categories of cCREs. Detailed results are reported in Table S27. (C) Fine mapping and molecular characterization of schizophrenia (SCZ) risk variants in different categories of cCREs from multiple neuronal types. Genome browser tracks (GRCh38) display chromatin accessibility profiles from snATAC-seq; histone modification signals (H3K27ac) from Paired-Tag, and red arcs represent the predicted enhancer for gene TSNARE. (D) Molecular characterization of Alzheimer’s disease (AD) risk variants in microglia specific enhancer. Genome browser tracks (GRCh38) display chromatin accessibility profiles from snATAC-seq; histone modification signals (H3K27ac) from Paired-Tag, and red arcs represent the predicted enhancer for gene TSPAN14. (E) Schematic diagram of deep learning model for predicting chromatin accessibly. (C) Chromatin accessibility at TSPAN14 enhancer loci predicted in human microglia. (F) In silico nucleotide mutagenesis influenced the prediction of accessibility. Larger signals (in dark red) represent a higher accessibility prediction on altered sequence, and lower signals (in dark blue) represent lower accessibility on altered sequence. Predicted JASPAR CROE 2022 motifs were listed below. (E) Lower accessibility predicted on TSPAN14 enhancer with risk variant rs7922621 C>A. (F) Less accessibility change predicted on TSPAN14 enhancer with risk variant rs7910643 G>A.

References

    1. Murray CJL, Atkinson C, Bhalla K, Birbeck G, Burstein R, Chou D, Dellavalle R, Danaei G, Ezzati M, Fahimi A, Flaxman D, Foreman, Gabriel S, Gakidou E, Kassebaum N, Khatibzadeh S, Lim S, Lipshultz SE, London S, Lopez, MacIntyre MF, Mokdad AH, Moran A, Moran AE, Mozaffarian D, Murphy T, Naghavi M, Pope C, Roberts T, Salomon J, Schwebel DC, Shahraz S, Sleet DA, Murray J Abraham M Ali K, Atkinson C, Bartels DH, Bhalla K, Birbeck G, Burstein R, Chen H, Criqui MH, Dahodwala, Jarlais, Ding EL, Dorsey ER, Ebel BE, Ezzati M, Fahami S Flaxman, Flaxman AD, Gonzalez-Medina D, Grant B, Hagan H, Hoffman H, Kassebaum N, Khatibzadeh S, Leasher JL, Lin J, Lipshultz SE, Lozano R, Lu Y, Mallinger L, McDermott MM, Micha R, Miller TR, Mokdad AA, Mokdad AH, Mozaffarian D, Naghavi M, Narayan KMV, Omer SB, Pelizzari PM, Phillips D, Ranganathan D, Rivara FP, Roberts T, Sampson U, Sanman E, Sapkota A, Schwebel DC, Sharaz S, Shivakoti R, Singh GM, Singh D, Tavakkoli M, Towbin JA, Wilkinson JD, Zabetian A, Murray J Abraham, Ali MK, Alvardo M, Atkinson C, Baddour LM, Benjamin EJ, Bhalla K, Birbeck G, Bolliger I, Burstein R, Carnahan E, Chou D, Chugh SS, Cohen A, Colson KE, Cooper LT, Couser W, Criqui MH, Dabhadkar KC, Dellavalle RP, Jarlais, Dicker D, Dorsey ER, Duber H, Ebel BE, Engell RE, Ezzati M, Felson DT, Finucane MM, Flaxman S, Flaxman AD, Fleming T, Foreman, Forouzanfar MH, Freedman G, Freeman MK, Gakidou E, Gillum RF, Gonzalez-Medina D, Gosselin R, Gutierrez HR, Hagan H, Havmoeller R, Hoffman H, Jacobsen KH, James SL Jasrasaria R, Jayarman S, Johns N, Kassebaum N, Khatibzadeh S, Lan Q, Leasher JL, Lim S, Lipshultz SE, London S, Lopez, Lozano R, Lu Y, Mallinger L, Meltzer M, Mensah GA, Michaud C, Miller TR, Mock C, Moffitt TE, Mokdad AA, Mokdad AH, Moran A, Naghavi M, Narayan KMV, Nelson RG, Olives C, Omer SB, Ortblad K, Ostro B, Pelizzari PM, Phillips D, Raju M, Razavi H, Ritz B, Roberts T, Sacco RL, Salomon J, Sampson U, Schwebel DC, Shahraz S, Shibuya K, Silberberg D, Singh JA, Steenland K, Taylor JA, Thurston GD, Vavilala MS, Vos T, Wagner GR, Weinstock MA, Weisskopf MG, Wulf S, Murray USB of D. Collaborators, The State of US Health, 1990–2010: Burden of Diseases, Injuries, and Risk Factors. Jama. 310, 591–606 (2013). - PMC - PubMed
    1. Buniello A, MacArthur JAL, Cerezo M, Harris LW, Hayhurst J, Malangone C, McMahon A, Morales J, Mountjoy E, Sollis E, Suveges D, Vrousgou O, Whetzel PL, Amode R, Guillen JA, Riat HS, Trevanion SJ, Hall P, Junkins H, Flicek P, Burdett T, Hindorff LA, Cunningham F, Parkinson H, The NHGRI-EBI GWAS Catalog of published genome-wide association studies, targeted arrays and summary statistics 2019. Nucleic Acids Res. 47, D1005–D1012 (2019). - PMC - PubMed
    1. Claussnitzer M, Cho JH, Collins R, Cox NJ, Dermitzakis ET, Hurles ME, Kathiresan S, Kenny EE, Lindgren CM, MacArthur DG, North KN, Plon SE, Rehm HL, Risch N, Rotimi CN, Shendure J, Soranzo N, McCarthy MI, A brief history of human disease genetics. Nature. 577, 179–189 (2020). - PMC - PubMed
    1. Frydas A, Wauters E, van der Zee J, Broeckhoven CV, Uncovering the impact of noncoding variants in neurodegenerative brain diseases. Trends Genet. 38, 258–272 (2021). - PubMed
    1. Liu B, Montgomery SB, Identifying causal variants and genes using functional genomics in specialized cell types and contexts. Hum Genet. 139, 95–102 (2020). - PMC - PubMed