. 2023 Oct 13;382(6667):eadf0834.
doi: 10.1126/science.adf0834. Epub 2023 Oct 13.

Single-cell analysis of prenatal and postnatal human cortical development

Affiliations

Single-cell analysis of prenatal and postnatal human cortical development

Dmitry Velmeshev et al. Science. .

Abstract

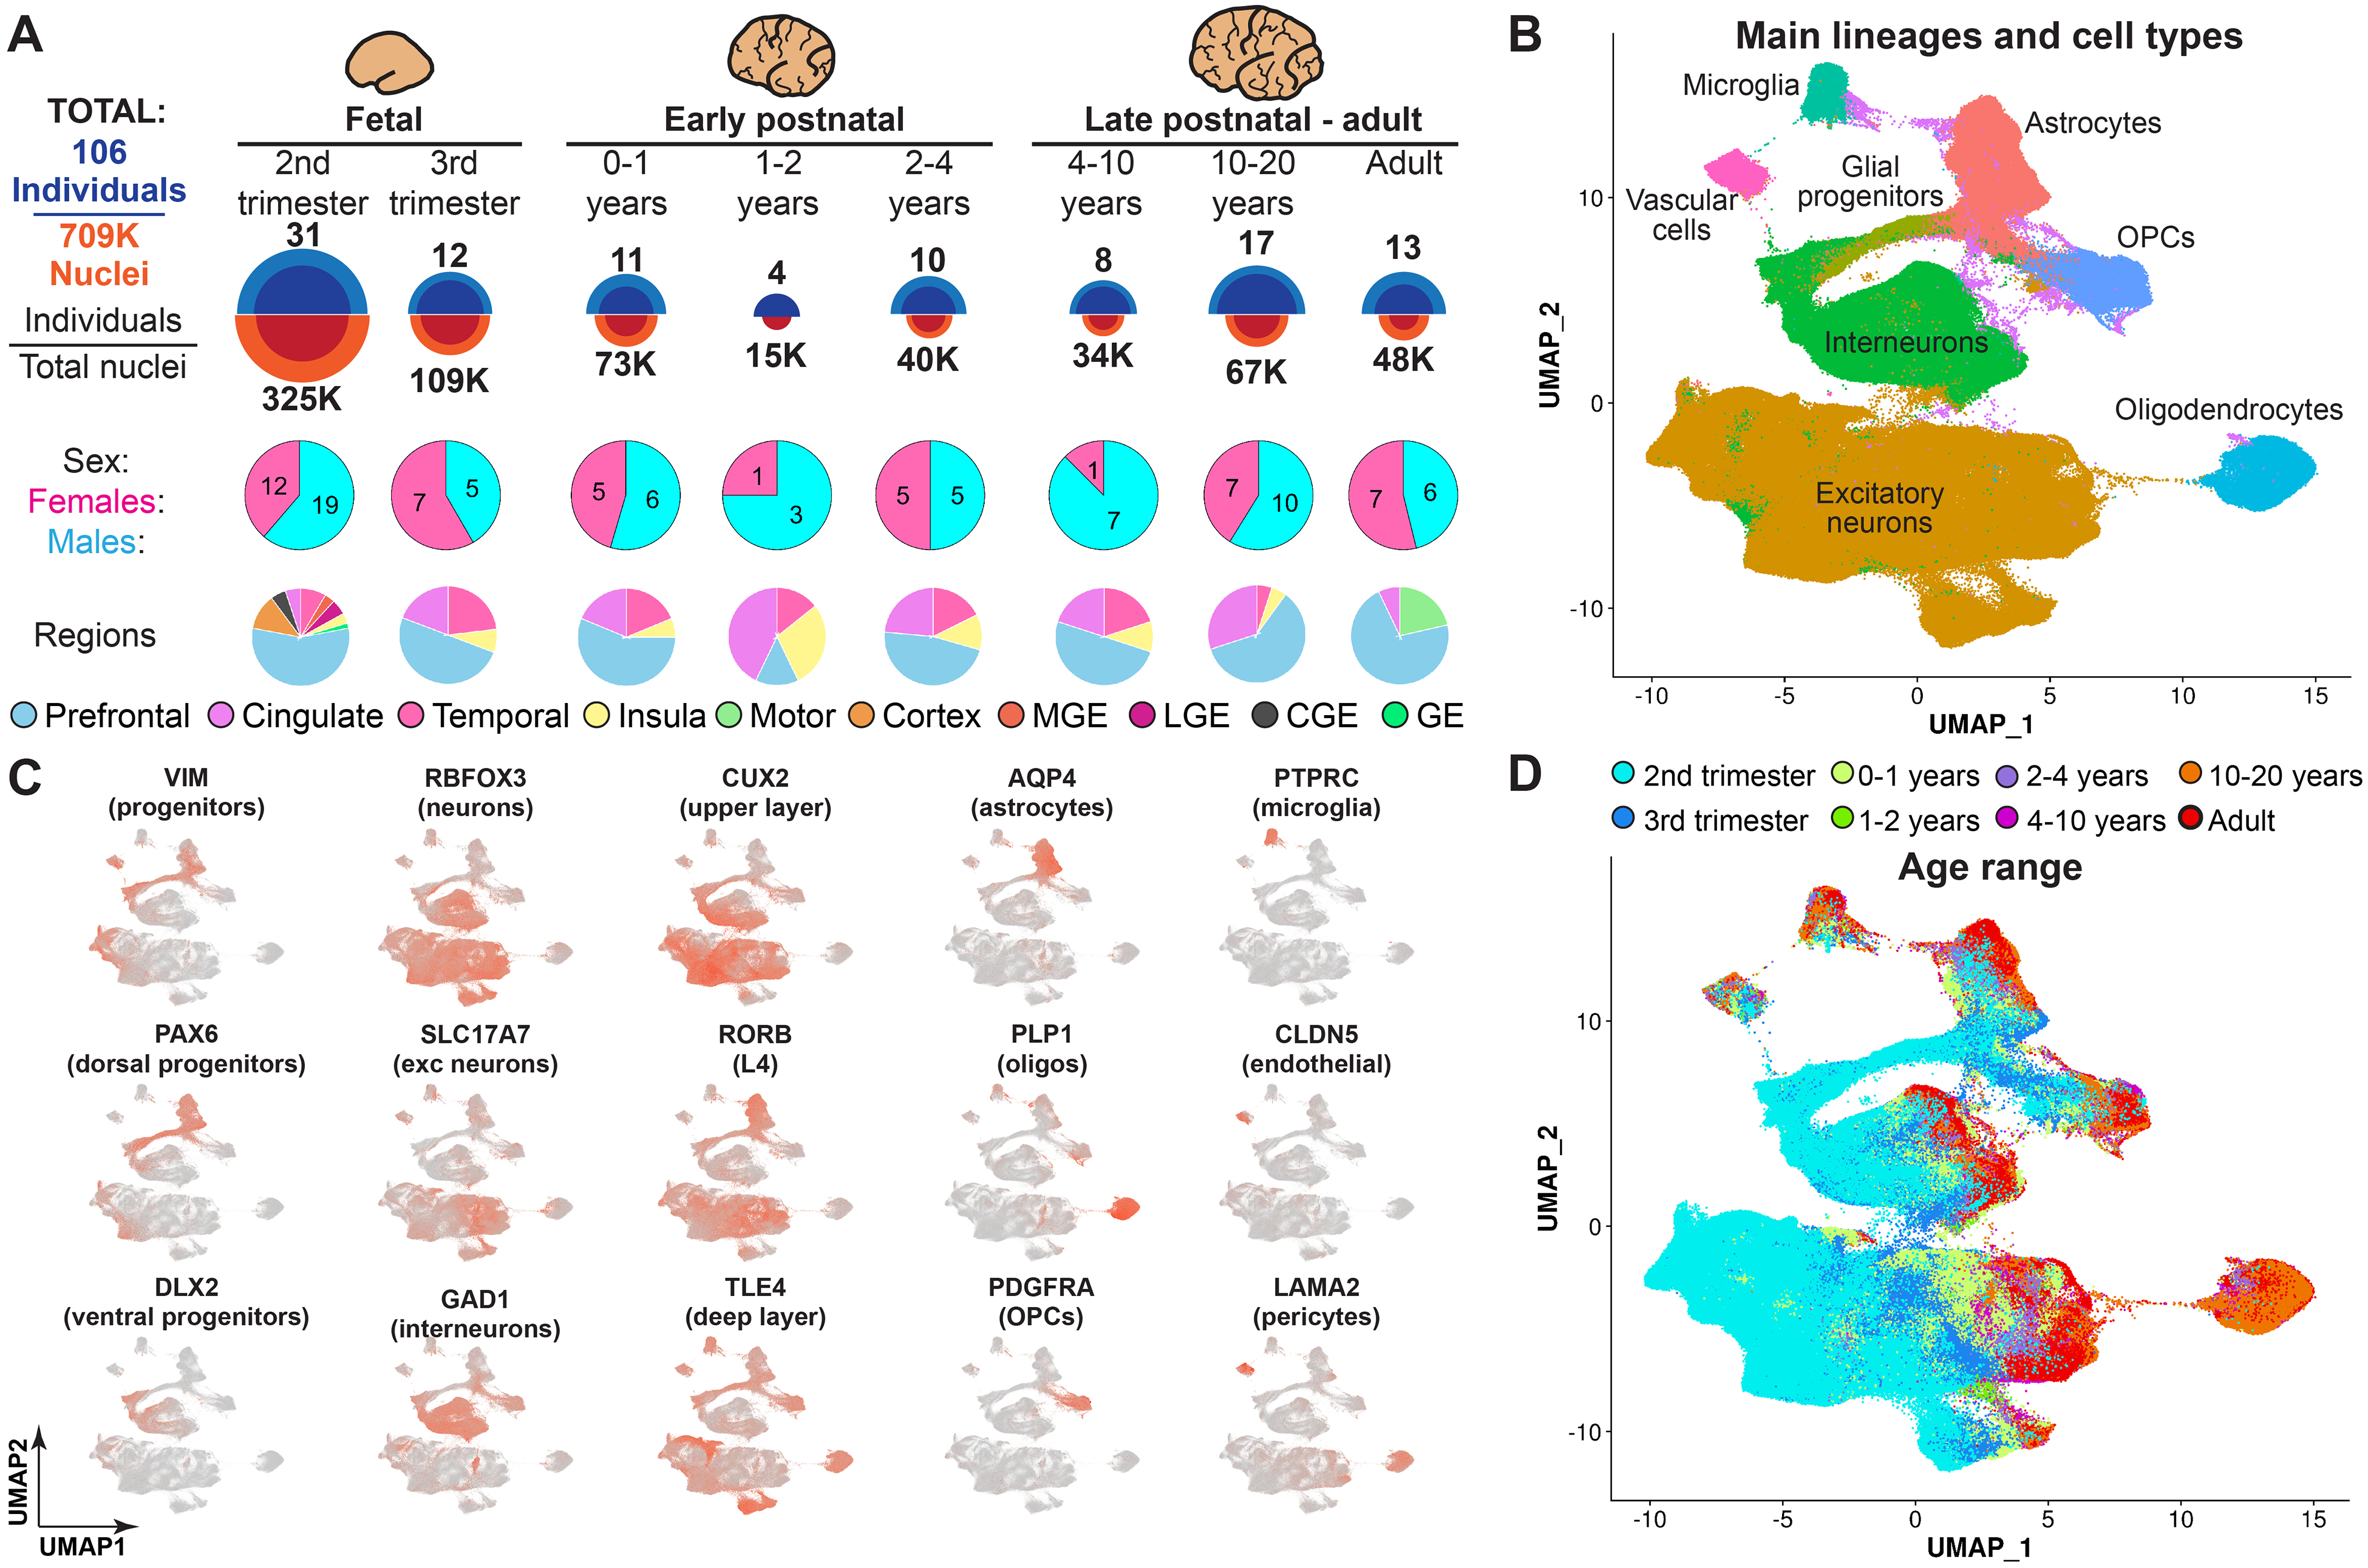
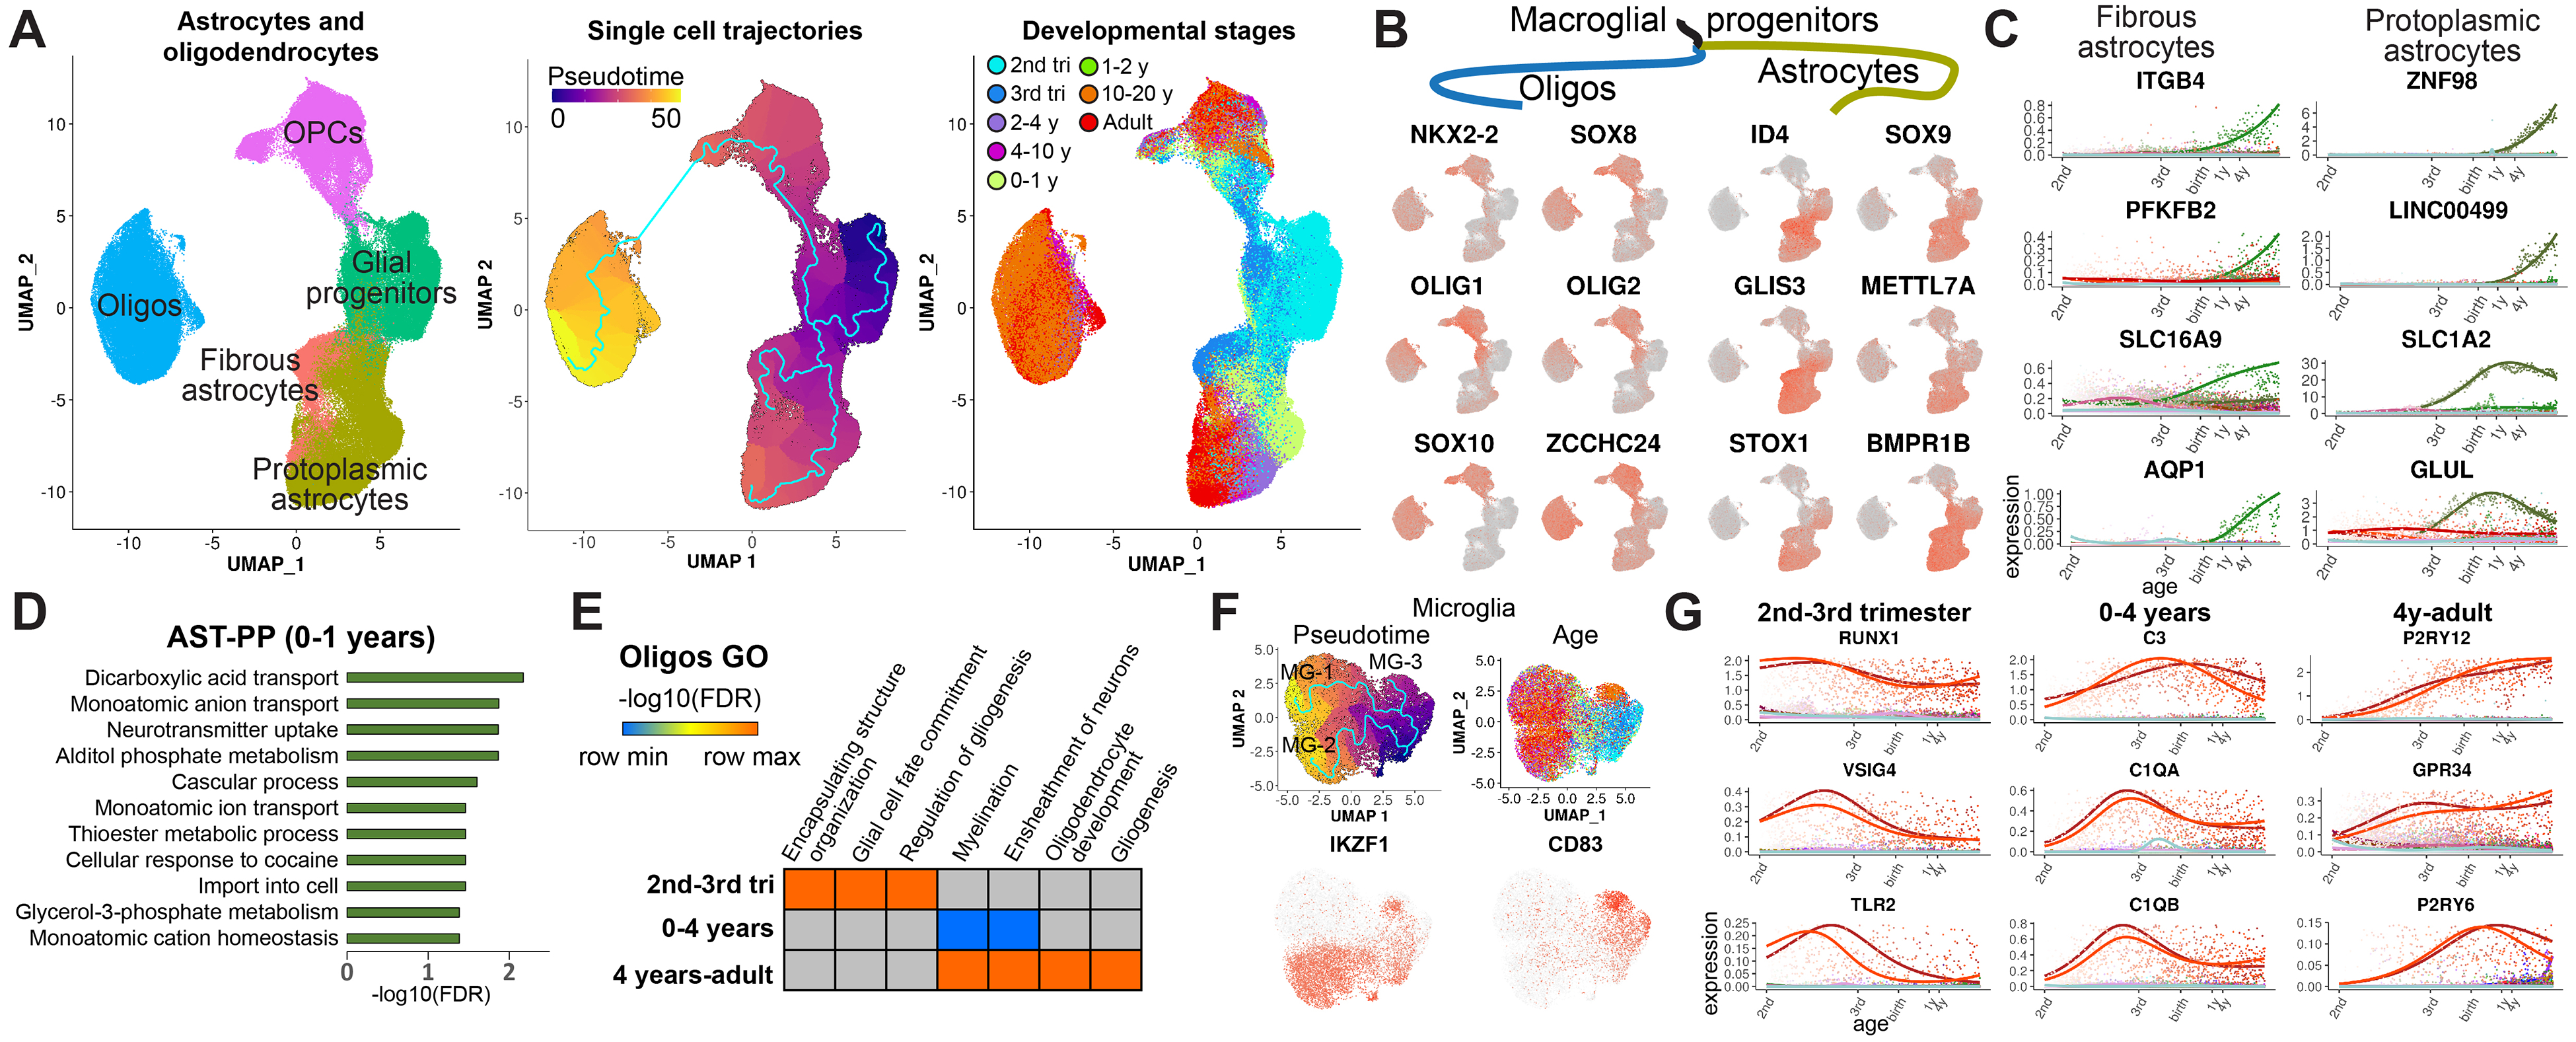
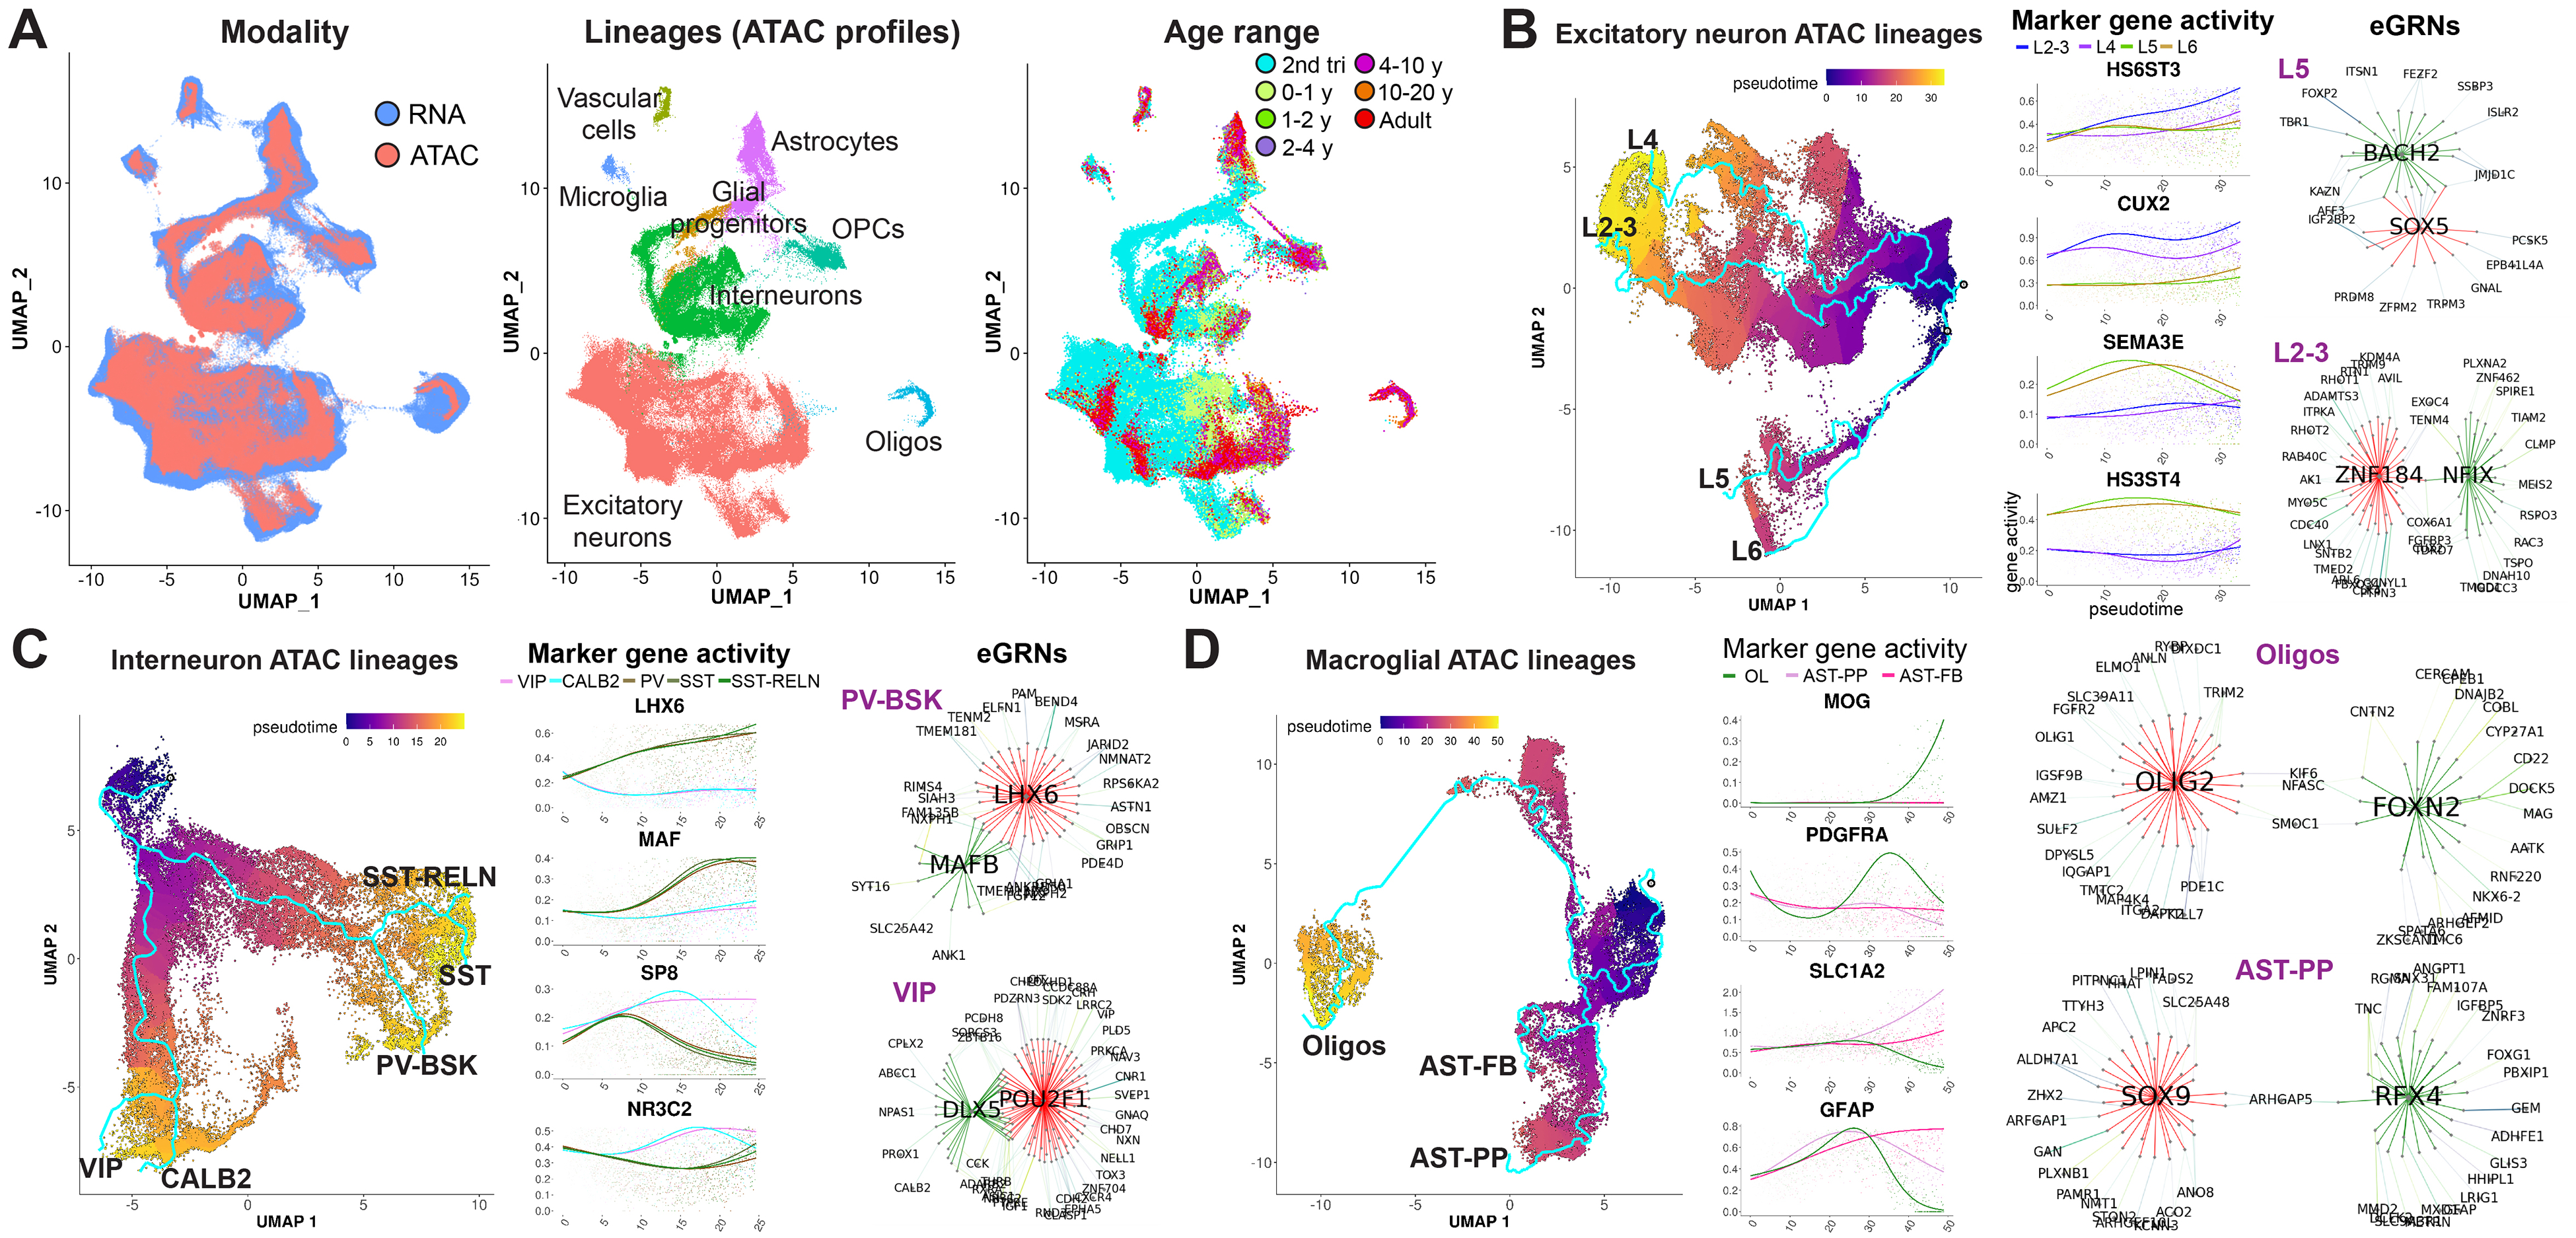
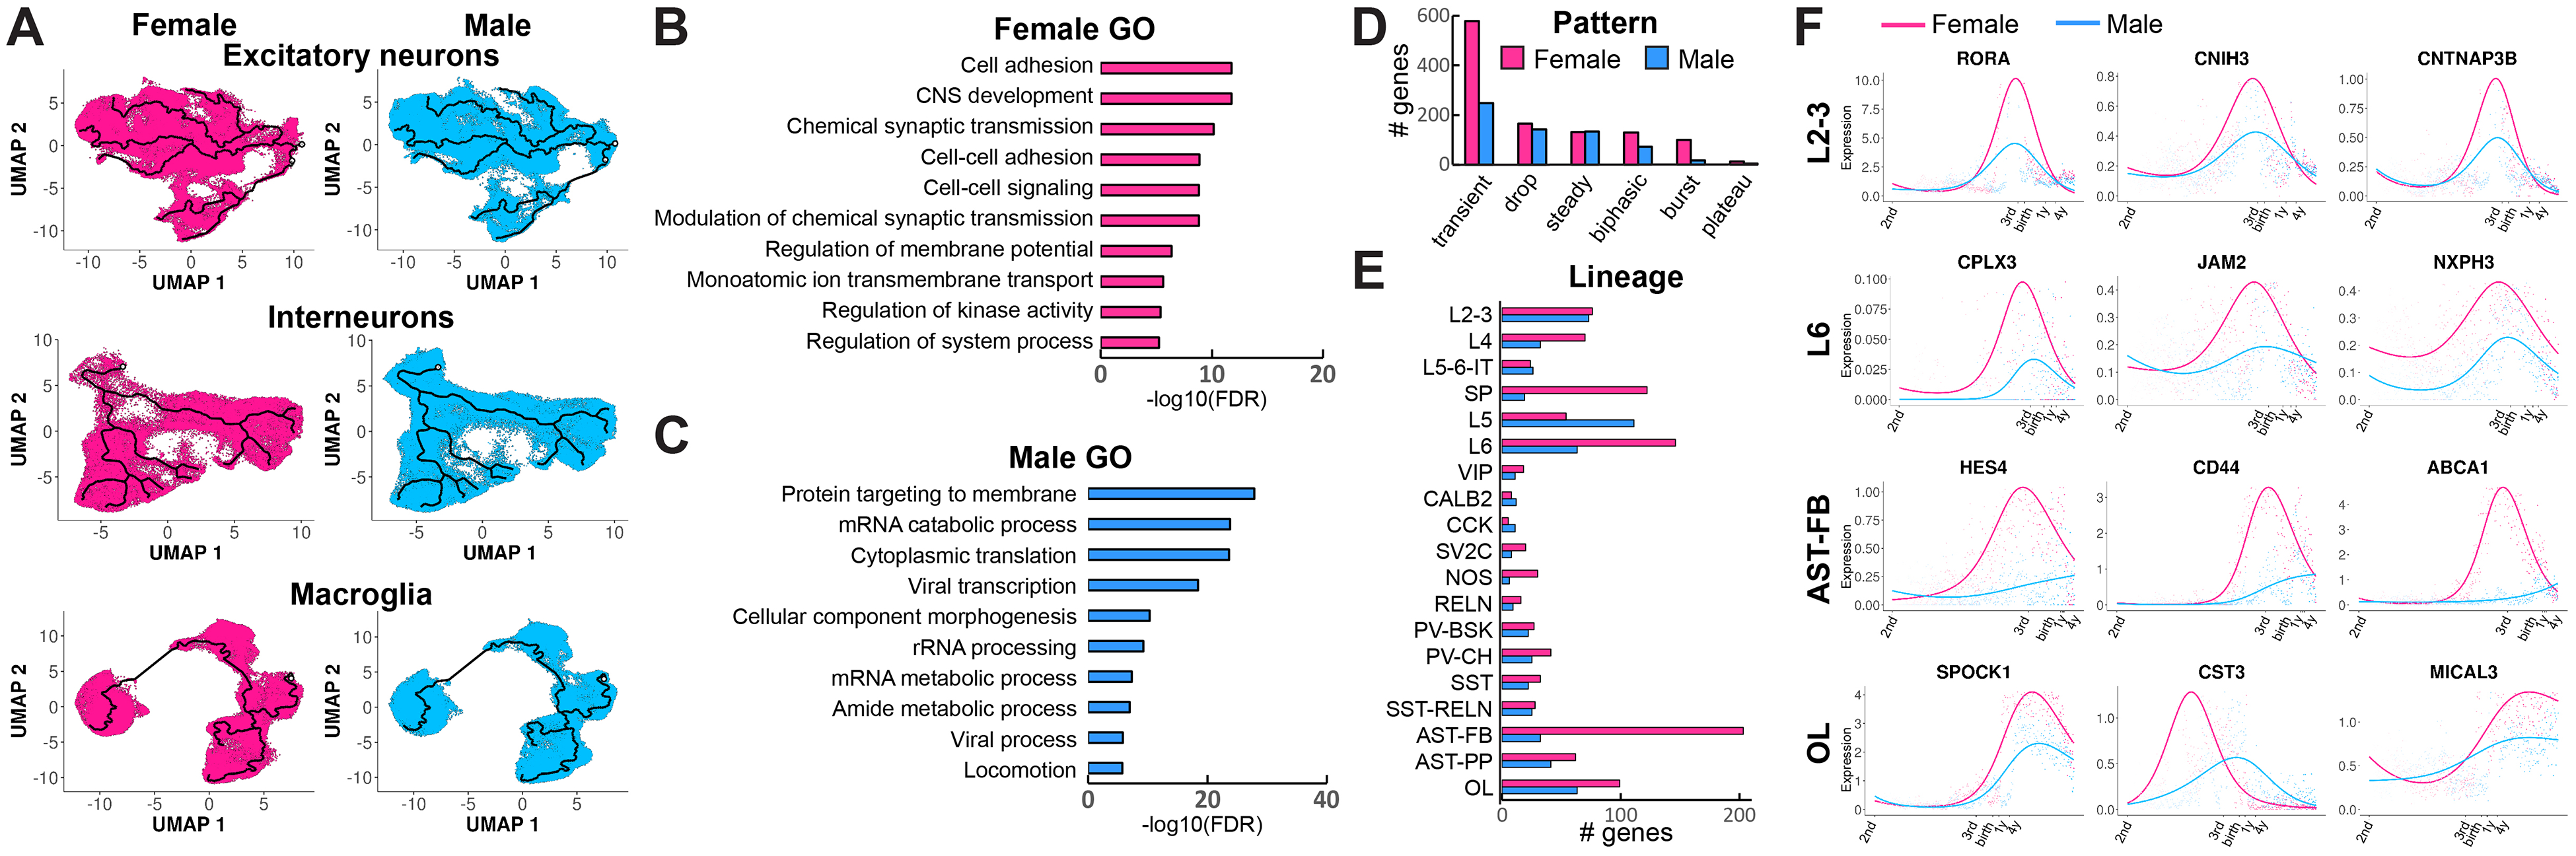
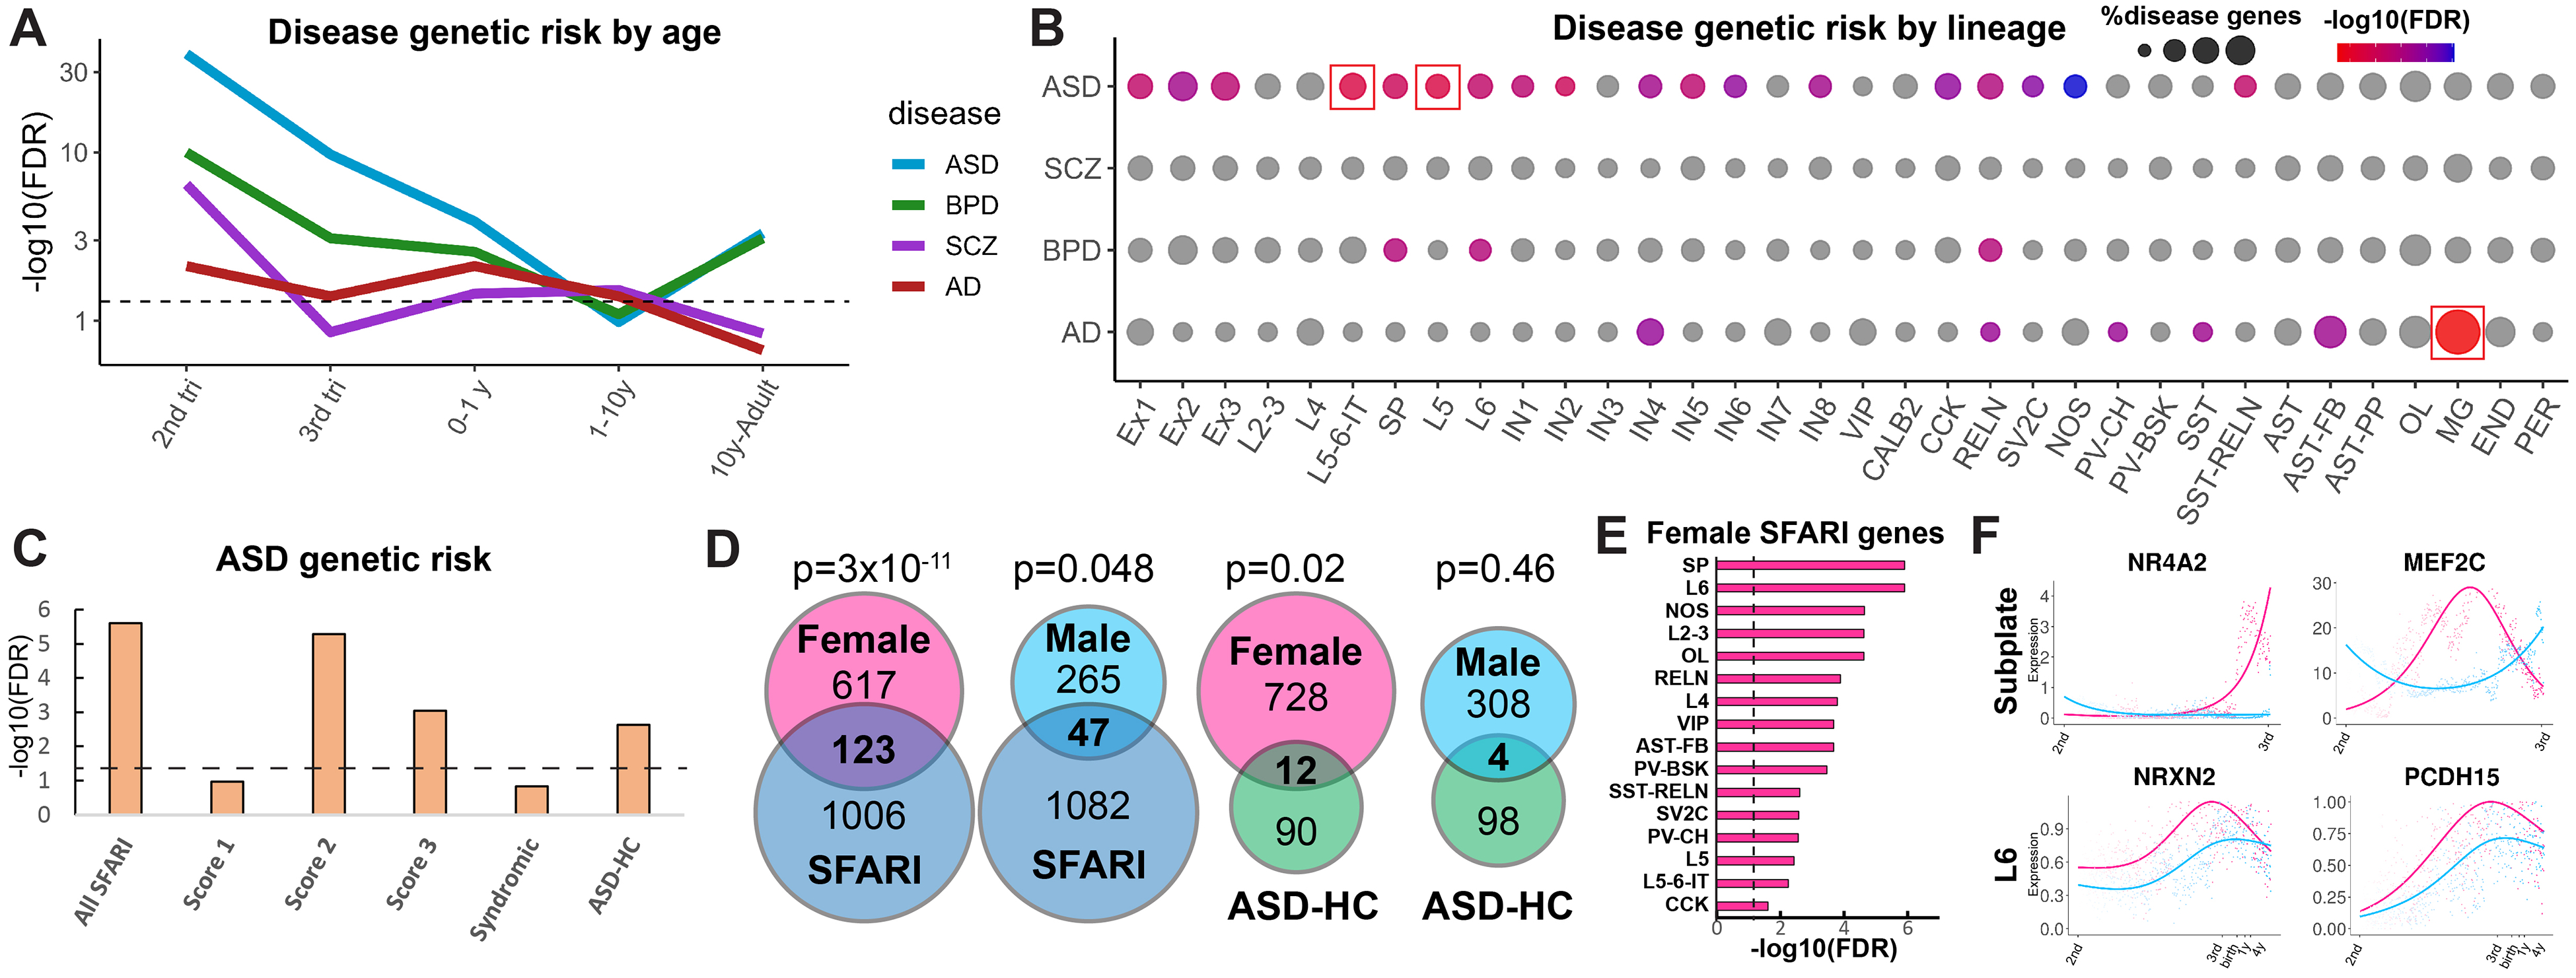
We analyzed >700,000 single-nucleus RNA sequencing profiles from 106 donors during prenatal and postnatal developmental stages and identified lineage-specific programs that underlie the development of specific subtypes of excitatory cortical neurons, interneurons, glial cell types, and brain vasculature. By leveraging single-nucleus chromatin accessibility data, we delineated enhancer gene regulatory networks and transcription factors that control commitment of specific cortical lineages. By intersecting our results with genetic risk factors for human brain diseases, we identified the cortical cell types and lineages most vulnerable to genetic insults of different brain disorders, especially autism. We find that lineage-specific gene expression programs up-regulated in female cells are especially enriched for the genetic risk factors of autism. Our study captures the molecular progression of cortical lineages across human development.


Conflict of interest statement

Competing interests: The authors have no competing interests.

Figures

Fig. 1.
Fig. 1.. Brain tissue samples used for data collection and initial clustering of snRNA-seq data.
(A) Overview of the tissue samples used in this study, including the number of individuals and the ages and brain regions captured in the snRNA-seq dataset. MGE, medial ganglionic eminence; LGE, lateral ganglionic eminence; CGE, caudal ganglionic eminence; GE, ganglionic eminence. (B) Clustering of the entire dataset, with the major lineages labeled. (C) Expression of cell type–specific markers used to determine cardinal lineages. exc neurons, excitatory neurons. (D) Nuclei labeled by their developmental age.
Fig. 2.
Fig. 2.. Analysis of excitatory and inhibitory neuron lineages.
(A) Cell types, reconstructed single-cell trajectories, and age distribution for subtypes of excitatory neurons. L2–3, upper-layer intratelencephalic projection neurons; L4, layer 4 neurons; L5–6-IT, deep-layer intratelencephalic projection neurons; L6, layer 6 neurons; L5, layer 5 neurons; SP, subplate neurons. (B) Identification of interneuron trajectories. (C) Rates of maturation of subtypes of excitatory neurons and interneurons. (D) GO analysis of genes with different age of onset of expression. FDR, false discovery rate; Reg., regulation. (E) Examples of top lineage- and branch-specific genes with transient and burst expression patterns. (F) Number of transient and burst genes in specific lineages and branches. (G) Spatial transcriptomic analysis of 140 lineage-specific genes, showing the spatial map of annotated cell types across development. GW22, 22 weeks of gestation; 2wk, 2 weeks postnatal; 25yo, 25-year-old; PFC, prefrontal cortex; Ex, excitatory; radial glial. (H) Examples of deep-layer neuronal markers with early patterned layer-specific expression (putative layer location is noted in parentheses).
Fig. 3.
Fig. 3.. Analysis of cortical glial lineages.
(A) Clusters and trajectories of glial progenitors, astrocytes, and oligodendrocytes. (B) Example genes specific to oligodendrocyte and astrocyte lineage branches. (C) Examples of top dynamically expressed genes specific to fibrous and protoplasmic astrocytes. (D) GO analysis of protoplasmic astrocyte-specific genes expressed during the first year of life. (E) Pathways enriched for oligo lineage-specific genes expressed at different developmental stages. (F) Analysis of microglia lineages. (G) Temporal patterns of developmental microglia genes.
Fig. 4.
Fig. 4.. Identification of lineage-specific epigenetic and transcriptional regulators.
(A) Integration of snRNA-seq and snATAC-seq data. snATAC-seq data was mapped on the snRNA-seq coordinates, clusters, and cell types. (B to D) Analysis of eGRNs in excitatory neuron lineages (B), interneurons (C), and glial lineages (D). Network plots (eGRNs) display transcription factors predicted to bind enhancer regions to regulate lineage-specific transcriptional programs. Edge colors indicate regulation by different transcription factors. Top 20 genes on the basis of the predicted confidence of interaction are shown for each transcription factor network.
Fig. 5.
Fig. 5.. Analysis of sex-specific developmental programs in human cortex.
(A) Female and male developmental trajectories of excitatory neurons, interneurons, astrocytes, and oligodendrocytes. (B and C) GO analysis of female-enriched and male-enriched genes. (D) Dynamic expression patterns of sex-enriched genes. (E) Sex enrichment of developmental gene expression across neuronal and glial lineages. (F) Examples of top female-enriched genes in specific lineages.
Fig. 6.
Fig. 6.. Lineage enrichment of brain-disorder risk genes.
(A) Enrichment of disease risk genes across developmental stages. (B) Disease risk gene enrichment across lineages and lineage branches of neuronal, glial, and vascular cell types. Red squares indicate statistical significance. (C) Enrichment of lineage-specific developmentally regulated ASD risk genes of different categories and evidence scores. (D) Overlap between ASD risk genes and female and male-enriched developmental gene programs. (E) Enrichment of sex-specific genes across cortical lineages. (F) Temporal patterns of female-enriched genes that are known risk factors for ASD.

References

    1. Bhaduri A et al., An atlas of cortical arealization identifies dynamic molecular signatures. Nature 598, 200–204 (2021). doi: 10.1038/s41586-021-03910-8 - DOI - PMC - PubMed
    1. Eze UC, Bhaduri A, Haeussler M, Nowakowski TJ, Kriegstein AR, Single-cell atlas of early human brain development highlights heterogeneity of human neuroepithelial cells and early radial glia. Nat. Neurosci. 24, 584–594 (2021). doi: 10.1038/s41593-020-00794-1 - DOI - PMC - PubMed
    1. Nowakowski TJ et al., Spatiotemporal gene expression trajectories reveal developmental hierarchies of the human cortex. Science 358, 1318–1323 (2017). doi: 10.1126/science.aap8809 - DOI - PMC - PubMed
    1. Ziffra RS et al., Single-cell epigenomics reveals mechanisms of human cortical development. Nature 598, 205–213 (2021). doi: 10.1038/s41586-021-03209-8 - DOI - PMC - PubMed
    1. Li M et al., Integrative functional genomic analysis of human brain development and neuropsychiatric risks. Science 362, eaat7615 (2018). doi: 10.1126/science.aat7615 - DOI - PMC - PubMed