. 2023 Oct 13;382(6667):eadf6812.
doi: 10.1126/science.adf6812. Epub 2023 Oct 13.

Transcriptomic cytoarchitecture reveals principles of human neocortex organization

Affiliations

Transcriptomic cytoarchitecture reveals principles of human neocortex organization

Nikolas L Jorstad et al. Science. .

Abstract

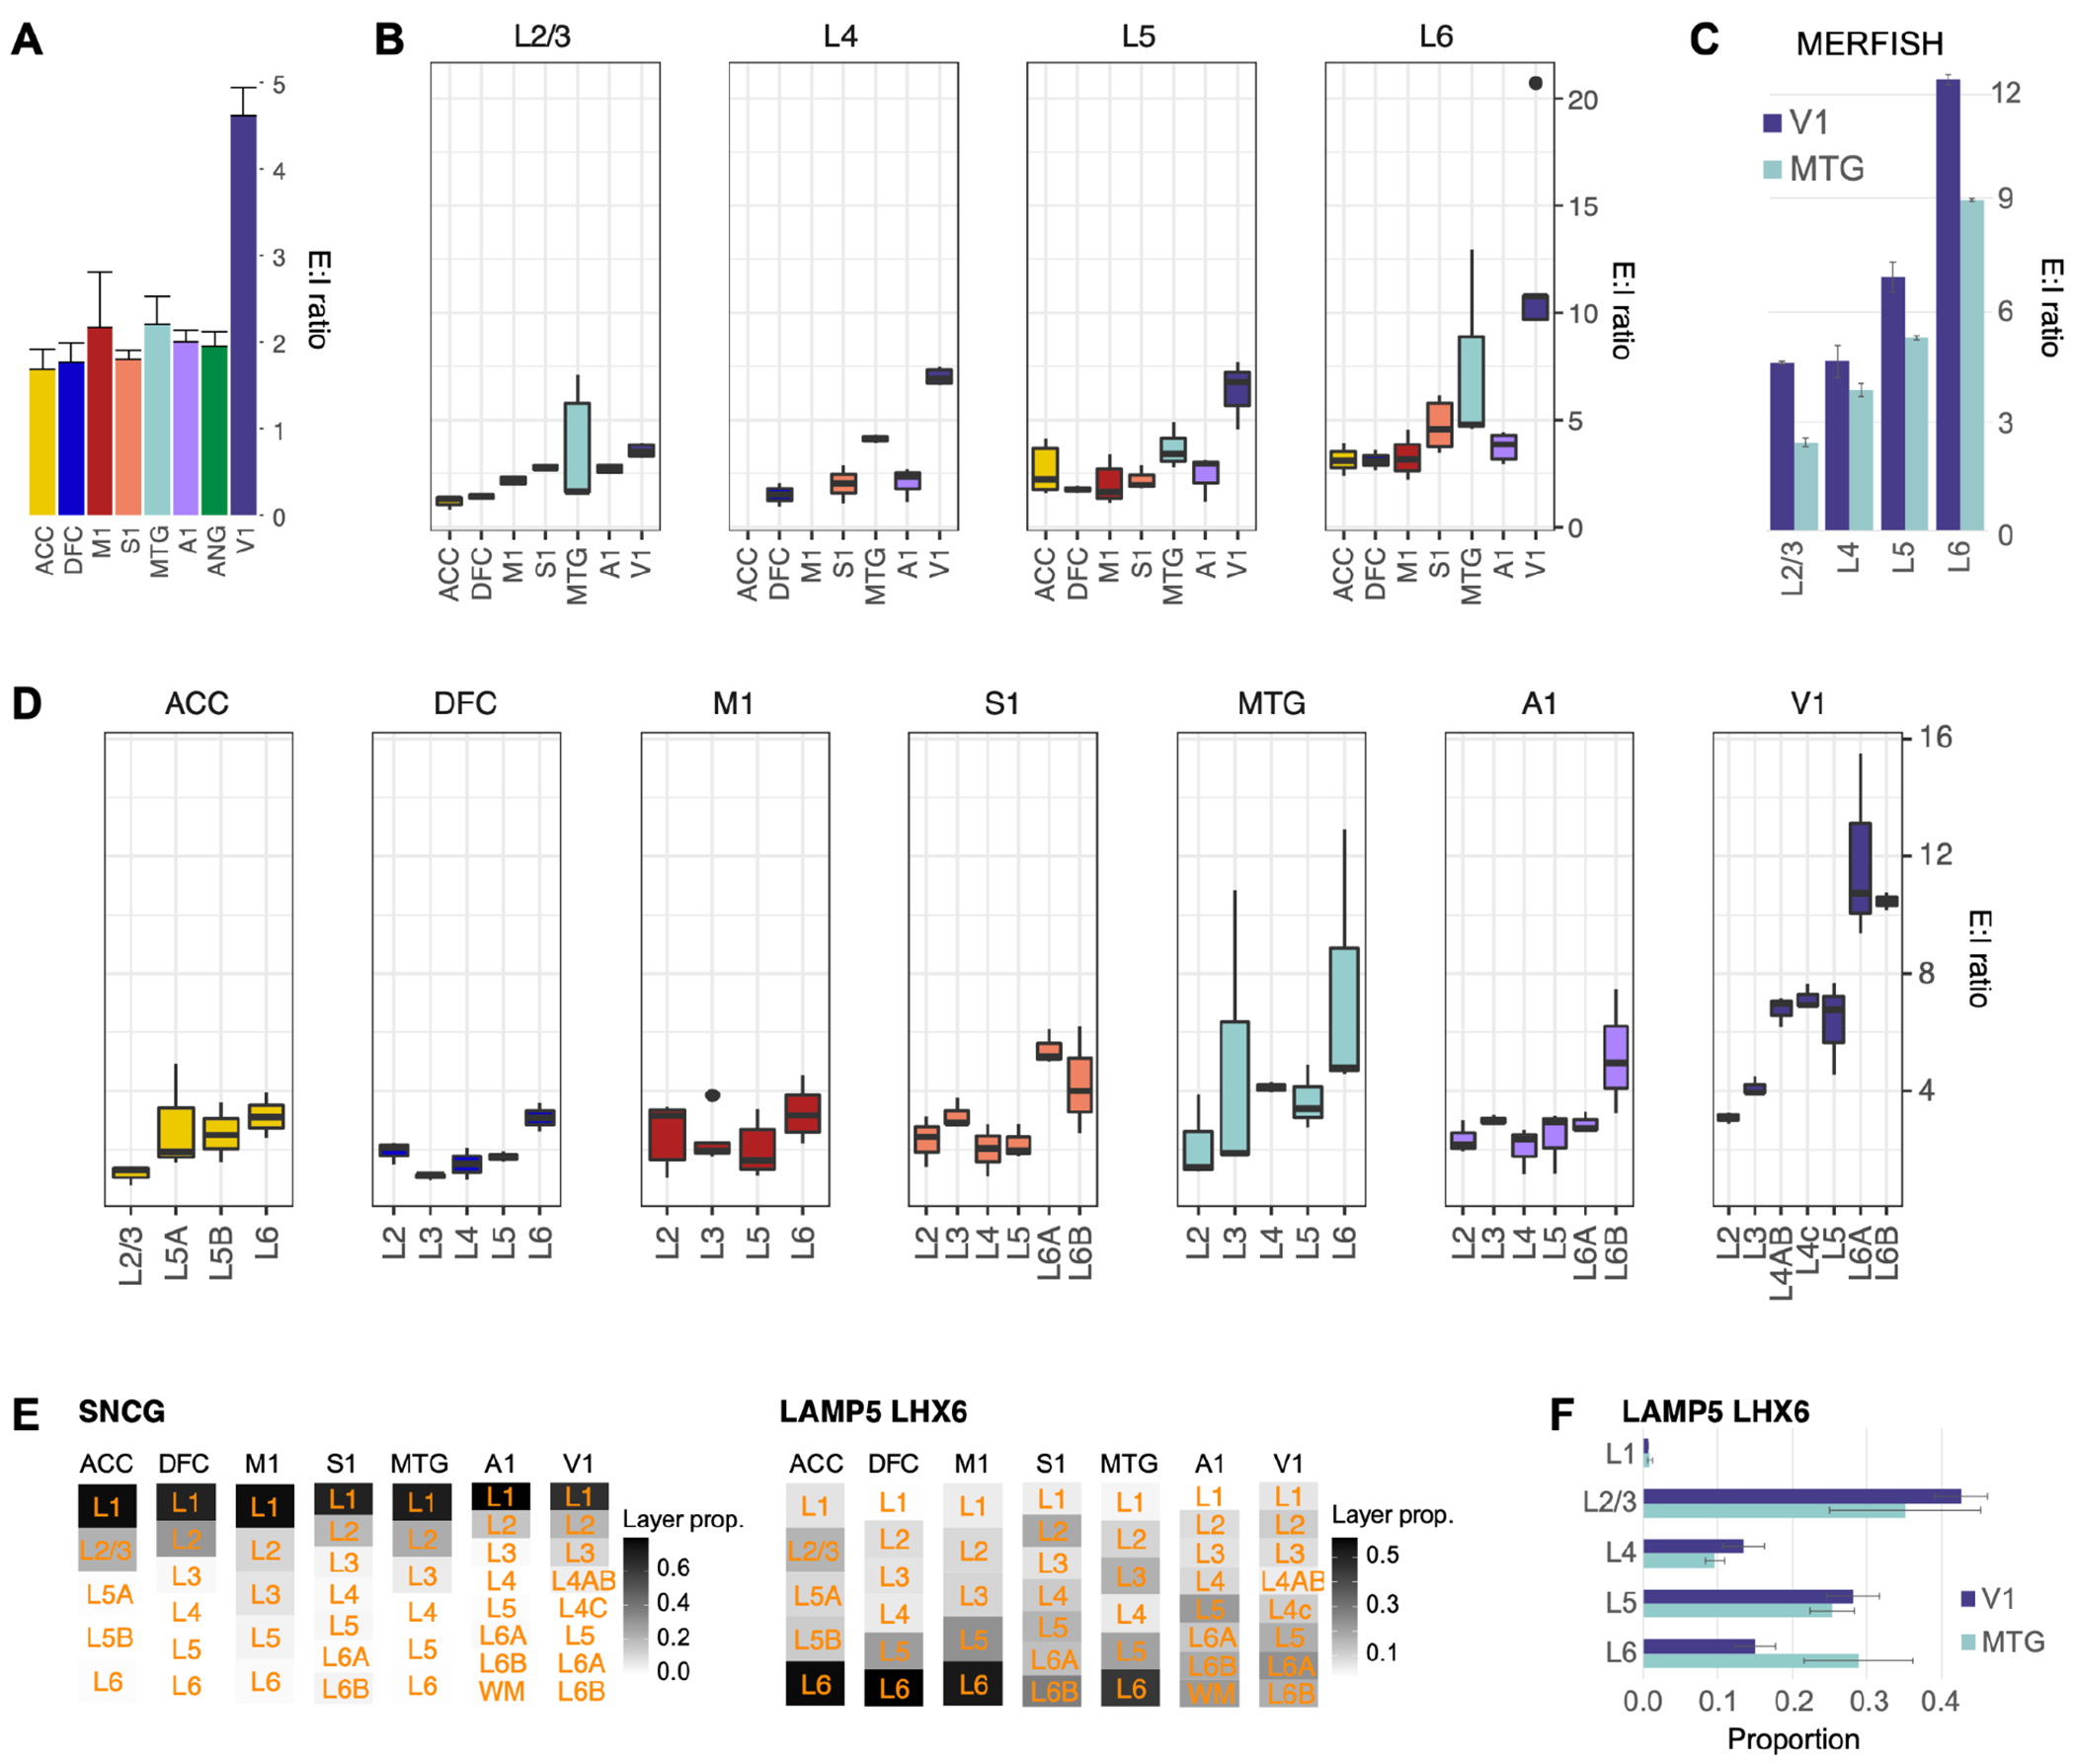
Variation in cytoarchitecture is the basis for the histological definition of cortical areas. We used single cell transcriptomics and performed cellular characterization of the human cortex to better understand cortical areal specialization. Single-nucleus RNA-sequencing of 8 areas spanning cortical structural variation showed a highly consistent cellular makeup for 24 cell subclasses. However, proportions of excitatory neuron subclasses varied substantially, likely reflecting differences in connectivity across primary sensorimotor and association cortices. Laminar organization of astrocytes and oligodendrocytes also differed across areas. Primary visual cortex showed characteristic organization with major changes in the excitatory to inhibitory neuron ratio, expansion of layer 4 excitatory neurons, and specialized inhibitory neurons. These results lay the groundwork for a refined cellular and molecular characterization of human cortical cytoarchitecture and areal specialization.


Conflict of interest statement

Competing interests: From April 11, 2022, N.L.J. is an employee of Genentech.

Figures

Fig. 1.
Fig. 1.. Transcriptomic cell type diversity across human cortical areas.
(A) Eight areas of the neocortex were sampled from four lobes of the adult human brain. (B) snRNA-seq sampling across areas grouped by RNA-seq platform and layer dissection strategy and number of male and female donors. (C) Schematic of snRNA-seq clustering to generate cell type taxonomies for each area. (D) UMAPs of single nuclei from each area based on variable gene expression and colored by cell subclass as in panel J. (E) Distributions of subclass transcriptomic entropy differ between neuronal (Exc and Inh) and non-neuronal (NN) classes and not between areas. (F,G,H) Summary of within-area taxonomies showing the number of nuclei sampled from each subclass and the number of distinct clusters (cell types) identified for excitatory (F) and inhibitory (G) neurons and non-neuronal cells (H). (I) Number of subclass markers in each area (box plots) and shared across areas (blue points). Box plots show median, interquartile range (IQR), up to 1.5*IQR (whiskers), and outliers (points). (J) Heatmaps of conserved marker expression for 50 random nuclei sampled from each area for chandelier interneurons and horizontally compressed for all subclasses.
Fig. 2.
Fig. 2.. Cell subclass composition reflects cytoarchitecture and varies systematically along the rostrocaudal axis.
(A) Images of Nissl-stained sections of cortical areas are labeled with approximate layer boundaries and show distinct cytoarchitecture. Areas are ordered by position along the rostrocaudal axis of the cortex. (B) Representative cortical gyral locations of sampled tissue. (C) Relative proportions of neuronal subclasses as a fraction of all excitatory or inhibitory neurons in each area and estimated based on snRNA-seq profiling or in situ labeling using MERFISH. Arrowhead directions indicate subclasses that significantly increase (pointing up) or decrease (down) across areas based on scCODA analysis (D) For each donor, subclass proportions were calculated as a fraction of all neurons in the same class (excitatory or inhibitory) and grouped by neighborhood (*nominal P < 0.05; **Bonferroni-corrected P < 0.05). (E) Spearman correlations of excitatory and inhibitory subclass proportions across areas. Scale bar on A, 200 μm.
Fig. 3.
Fig. 3.. E:I ratio variation across cortical areas and layers.
(A) Relative number of excitatory neurons to inhibitory neurons (E:I ratio) in each area. Bar plots indicate average and standard deviation across donors. (B) E:I ratios estimated for a common set of layers dissected from each area. Box plots show median, interquartile range (IQR), up to 1.5*IQR (whiskers), and outliers (points) across multiple donors. (C) Validation of increased E:I ratios in all cortical layers in V1 compared to MTG based on MERFISH experiments. Bar plots and whiskers indicate average and standard deviation of E:I ratios across donors, respectively. (D) E:I ratios estimated for all layers dissected from each area. (E) Laminar distributions of interneurons were conserved (SNCG) or divergent (LAMP5 LHX6) across areas based on counts of layer-dissected nuclei. Note that primary sensory areas (S1, A1 and V1) have a distinct distribution of LAMP5 LHX6 neurons. (F) MERFISH in situ labeling of LAMP5 LHX6 cells shows a decreased proportion of cells in layer 6 of V1 compared to MTG.
Fig. 4.
Fig. 4.. Transcriptional topography across cortical areas.
(A, B) UMAPs showing transcriptomic similarities of single nuclei dissected from eight cortical areas and colored by neuronal subclass (A) and area (B) for excitatory and inhibitory neuron neighborhoods. Arrows indicate V1-specialized neurons. Curved arrows illustrate rostral (R) to caudal (C) ordering of areas on the cortical sheet. (C) The number of genes that are significantly differentially expressed across areas for each subclass grouped by neighborhood. Subclasses with 0 or 1 DEG are labeled. See Table S6 for all DEGs. (D) The number of genes that have highly enriched expression in a single area for each subclass. (E) Spearman correlations of expression similarity between pairs of areas as a function of the approximate physical distance along an unfolded neocortical sheet. Pairwise comparisons that include V1 (blue points) or do not include V1 (red) are grouped separately because V1 is so transcriptomically distinct. (F) Ternary plot summarizing the relative proportion of variance explained by expression gradients across areas along rostrocaudal (R-C), midline-surface (M-S, anatomical left to right), and dorsoventral (D-V) axes for each subclass. Point size indicates the number of genes with >5% of variance explained by at least one gradient, and point location shows the weighted mean proportion across all genes (shown in Fig. S10H). Points are colored by cell neighborhood. (G) For each subclass, the number of genes with expression that increases (R-C) or decreases (C-R) in areas ordered by their position along the rostrocaudal axis. (H) Examples of genes with rostrocaudal gradient expression that have been previously described in development (CBLN2) (32), have opposing gradients in different subclasses for the same gene (DCC), or for two related genes (CNTN5 and CNTN6) involved in neuronal connectivity for the same subclass.
Fig. 5.
Fig. 5.. Cross-areal consensus taxonomy.
(A) Schematic of data integration across donors used for each neighborhood to generate the cross-area consensus taxonomy. (B) Consensus taxonomy of cell types across eight areas. (C) Proportion of nuclei in each consensus type dissected from each donor. (D) Consensus type proportion including nuclei from all areas as a fraction of cell class. Individual dots indicate proportions measured per donor. (E) The relative number of nuclei dissected from areas that contribute to each consensus cell type. (F) Changes in consensus type proportions across areas based on compositional analyses of neurons and non-neuronal cells using scCODA. Larger magnitude changes are indicated by darker colors. See Table S10 for proportion effect sizes.
Fig. 6.
Fig. 6.. V1 cell type specialization.
(A) Transcriptional uniqueness of cell types in the V1 taxonomy. Cell types with specificity >0.6 are considered V1-specialized and are highlighted in blue (see Table S11). (B) Laminar distributions of specialized (blue text) and common (grey) L2/3 IT types based on MERFISH in situ labeling experiments. (C,E) Scaled expression of marker genes of V1 specialized (blue labels) and common (black) L4 IT (C) and SST (E) types across areas. Dendrograms were pruned from the V1 taxonomy in panel A. (D,F) Laminar distributions of specialized and common L4 IT (D) and SST (F) types based on MERFISH experiments.
Fig. 7.
Fig. 7.. L5 ET-projecting neuronal diversity.
(A) UMAPs of L5 ET neurons labeled by area and cross-area consensus type. (B) Within-area L5 ET subtypes for each area shown in the same UMAP space as panel A. (C) Bar plots summarizing the expression variance explained by human donor, L5 ET subtype, and four types of variation across areas: rostrocaudal (R-C), midline-surface (M-S, anatomical left to right), and dorsoventral (D-V) gradients and more complex patterns or in a single area (Area). For the four types of areal variation, the distribution of expression across areas is shown for one of the top five genes. (D) Examples of genes with L5 ET neuron expression restricted to one or a few areas. (E) Number of genes in the top 10 significantly enriched terms from Gene ontology (GO) analyses (biological process, BP; cellular component, CC; molecular function, MF) of L5 ET areal markers (Table S13).
Fig. 8.
Fig. 8.. Areal specialization of astrocytes.
(A) UMAP of non-neuronal cells labeled by cortical area. (B) UMAPs of astrocyte expression for genes with areal enrichment. Arrow in (A,B) shows grouping of nuclei from ACC on the UMAP. (C) Laminar distributions of astrocytes vary across areas and are depleted in V1 L4A and L4B. (D) GFAP immunofluorescence (IF) and in situ hybridization (ISH) illustrates variable laminar distributions and morphologies of astrocytes in V1 and validates depletion in L4A and L4B. Single channel IF images were inverted to increase visibility of GFAP IF. Scale bars: IF columns (100μm), GFAP tracing images (15 μm), ISH (200 μm). (E) Laminar distributions of astrocyte subtypes in V1 based on MERFISH in situ labeling experiments. (F) Pan-astrocyte and subtype marker expression.

References

    1. von Economo C, Koskinas GN, Triarhou LC, Atlas of cytoarchitectonics of the adult human cerebral cortex (Karger, Basil; ; New York, 1st English ed., 2008).
    1. von Economo C, Koskinas GN, Die Cytoarchitektonik der Hirnrinde des erwachsenen Menschen.
    1. Brodmann K, Vergleichende Lokalisationslehre der Grosshirnrinde: in ihren Prinzipien dargestellt auf Grund d. Zellenbaues (Barth, Leipzig, Repr. d. 1. Aufl. von 1909., 1985).
    1. Vogt C, Vogt O, Allgemeine Ergebnisse unserer Hirnforschung (J.A. Barth, 1919).
    1. Amunts K, Zilles K, Architectonic Mapping of the Human Brain beyond Brodmann. Neuron. 88, 1086–1107 (2015). - PubMed