Comparative Study
. 2023 Oct 13;382(6667):eadf0805.
doi: 10.1126/science.adf0805. Epub 2023 Oct 13.

Morphoelectric and transcriptomic divergence of the layer 1 interneuron repertoire in human versus mouse neocortex

Thomas Chartrand  1 Rachel Dalley  1 Jennie Close  1 Natalia A Goriounova  2 Brian R Lee  1 Rusty Mann  1 Jeremy A Miller  1 Gabor Molnar  3 Alice Mukora  1 Lauren Alfiler  1 Katherine Baker  1 Trygve E Bakken  1 Jim Berg  1 Darren Bertagnolli  1 Thomas Braun  4 Krissy Brouner  1 Tamara Casper  1 Eva Adrienn Csajbok  3 Nick Dee  1 Tom Egdorf  1 Rachel Enstrom  1 Anna A Galakhova  2 Amanda Gary  1 Emily Gelfand  1 Jeff Goldy  1 Kristen Hadley  1 Tim S Heistek  2 DiJon Hill  1 Nik Jorstad  1 Lisa Kim  1 Agnes Katalin Kocsis  3 Lauren Kruse  1 Michael Kunst  1 Gabriela Leon  1 Brian Long  1 Matthew Mallory  1 Medea McGraw  1 Delissa McMillen  1 Erica J Melief  5 Norbert Mihut  3 Lindsay Ng  1 Julie Nyhus  1 Gáspár Oláh  3 Attila Ozsvár  3 Victoria Omstead  1 Zoltan Peterfi  3 Alice Pom  1 Lydia Potekhina  1 Ramkumar Rajanbabu  1 Marton Rozsa  3 Augustin Ruiz  1 Joanna Sandle  3 Susan M Sunkin  1 Ildiko Szots  3 Michael Tieu  1 Martin Toth  3 Jessica Trinh  1 Sara Vargas  1 David Vumbaco  1 Grace Williams  1 Julia Wilson  1 Zizhen Yao  1 Pal Barzo  6 Charles Cobbs  7 Richard G Ellenbogen  8 Luke Esposito  1 Manuel Ferreira  8 Nathan W Gouwens  1 Benjamin Grannan  8 Ryder P Gwinn  7 Jason S Hauptman  8 Tim Jarsky  1 C Dirk Keene  5 Andrew L Ko  8 Christof Koch  1 Jeffrey G Ojemann  8 Anoop Patel  8 Jacob Ruzevick  8 Daniel L Silbergeld  8 Kimberly Smith  1 Staci A Sorensen  1 Bosiljka Tasic  1 Jonathan T Ting  1   9   10 Jack Waters  1 Christiaan P J de Kock  2 Huib D Mansvelder  2 Gabor Tamas  3 Hongkui Zeng  1 Brian Kalmbach #  1   9 Ed S Lein #  1   8
Affiliations
Comparative Study

Morphoelectric and transcriptomic divergence of the layer 1 interneuron repertoire in human versus mouse neocortex

Thomas Chartrand et al. Science. .

Abstract

Neocortical layer 1 (L1) is a site of convergence between pyramidal-neuron dendrites and feedback axons where local inhibitory signaling can profoundly shape cortical processing. Evolutionary expansion of human neocortex is marked by distinctive pyramidal neurons with extensive L1 branching, but whether L1 interneurons are similarly diverse is underexplored. Using Patch-seq recordings from human neurosurgical tissue, we identified four transcriptomic subclasses with mouse L1 homologs, along with distinct subtypes and types unmatched in mouse L1. Subclass and subtype comparisons showed stronger transcriptomic differences in human L1 and were correlated with strong morphoelectric variability along dimensions distinct from mouse L1 variability. Accompanied by greater layer thickness and other cytoarchitecture changes, these findings suggest that L1 has diverged in evolution, reflecting the demands of regulating the expanded human neocortical circuit.


Conflict of interest statement

Competing interests: CK holds an executive position, and has a financial interest, in Intrinsic Powers, Inc., a company whose purpose is to develop a device that can be used in the clinic to assess the presence and absence of consciousness in patients. This does not pose any conflict of interest with regard to the work undertaken for this publication.

Figures

Fig. 1:
Fig. 1:. Single-nucleus RNA-seq demonstrates L1 diversity and provides a reference for patch-seq transcriptomic mapping.
(A) UMAP projections of human (left) and mouse (right) gene expression for L1 t-types (single-neuron or -nucleus RNA-seq). (B) Human t-types grouped by thresholding transcriptomic distinctness d’, defining subclasses. Remaining ungrouped t-types are marked as ‘L1 VIP’ or ‘other’ based on cross-species homology results. (C) Expression of canonical and t-type-specific marker genes across L1 t-types in human (left) and mouse (right). Pink background: human subclass markers, grey: classical mouse markers. Vertical lines group t-types by subclass. Violins show normalized probability density of gene expression (shape width) and median expression (dots), with expression in log(CPM+1) normalized by gene for each species, and maximal expression in counts per million (CPM) noted at right). (D) Mouse t-types grouped with human t-types into homologous subclasses (outlined) by thresholding similarity scores (heatmap intensity, from cluster overlap in integrated transcriptomic space). Non-L1 t-types are excluded, with maximal similarity over all non-L1 types shown for reference. (E) Proportions of subclasses and unclassified t-types in L1 patch-seq data, by species. Other L1 t-types refers to t-types in human L1 with no mouse homologue in L1. Deeper t-types refers to types found in L1 in lower proportions, not meeting the criteria for core L1 t-types. All cross-species proportion differences (except L1 VIP) significant at FDR-corrected p<0.001, one vs. rest Fisher’s exact tests.
Fig. 2:
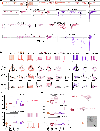
Fig. 2:. Human L1 transcriptomic subclasses are morpho-electrically diverse.
(A) Example human morphologies for L1 t-types are displayed by subclass. Neurons are shown aligned to an average cortical template, with histograms to the right of the morphologies displaying average dendrite (darker color) and axon (lighter color) branch length by cortical depth for all reconstructed cells in L1 and L2 (shading shows +/− 1 SD about mean, soma locations represented by black circles). (B) Electrophysiology summary view by t-type and subclass. Top shows example spiking response (scalebar 20 mV, 0.5 s). Cell-by-cell summary traces shown below, with black t-type average, dashed dataset average, individual cells in color. Top to bottom: phase plane (dV/dt vs V) plot of first action potential; instantaneous firing rate (IFR) normalized to peak; hyperpolarizing response normalized to peak. Spiking plots (example, phase-plane, IFR) at 40pA above rheobase, hyperpolarizing response at membrane potential closest to −100 mV (scalebar 0.5 s). Counts in Table S2. (C-D) Electrophysiological and morphological features distinguishing L1 subclasses (KW test, FDR-corrected p<10−7 for electrophysiology, <10−3 for morphology; Data S2). Boxplots show subclass statistics (box marks quartiles, whiskers extend 1.5xIQR past box), with individual cells arranged horizontally by t-type. Significant pairwise comparisons marked by lines above (FDR-corrected p<0.05, Dunn’s post-hoc test). Illustrative electrophysiology traces (scalebar 20 mV, 0.5 s) or layer-aligned morphologies shown for high and low values of each feature. Image inset shows that sparse dendrites in human PAX6 cells are not due to inability to resolve dendrites.
Fig. 3:
Fig. 3:. Comparison of human and mouse L1.
(A) Examples of NeuN labelling of neurons in human MTG and mouse VISp. (B) Comparisons of mouse versus human L1 thickness, neuron density, soma area and neuron count in 1mm wide ROIs of L1. Metrics plotted per ROI for L1 thickness, density and neuron count, and per cell for soma area. Boxplots show quartiles, stars indicate post-hoc Dunn’s test results at p<[0.05, 0.01, 0.001] (calculated for MTG vs TEa only). Counts in Materials and Methods. (C) Example layer-aligned morphologies from mouse and human L1 subclasses. One example shown from each t-type, scalebar for both species. (D) Morphological (left) and electrophysiological (right) features with differences between human and mouse L1 cells (species effect from 2-way ANOVA on ranks, FDR-corrected p<10−7 for morphology, p<10−38 for electrophysiology). For features with a species-subclass interaction (p<0.05 FDR-corrected for electrophysiology, not significant for morphology), stars indicate post-hoc Dunn’s test results at p<[0.05, 0.01, 0.001]. Counts in Table S2. Representative examples from LAMP5 subclass shown below each plot (L to R: layer-aligned reconstructions; AP frequency as a function of current injection; response to hyperpolarizing current nearest −100 mV, scalebar 0.5s/10mV; first action potential at rheobase, scalebar 1ms/20mV). (E) Electrophysiological feature differences between human L1 and mouse VISp L1 (left) were validated by testing against mouse TEa (right). Features selected by largest effect size against TEa (MW r, rank-biserial correlation). Stars indicate significance (FDR-corrected MW test, p<[0.05, 0.01, 0.001]). (F) Nucleated patch recordings quantified A-type K+ conductance of L1 neurons. Example traces show voltage commands (black) and recorded currents (orange) from measurement protocol (top), along with example soma size measurement. Boxplots show fast conductance density in both species, with example traces shown for each group (scalebars 400pA/200ms). Only LAMP5 neurons were sampled in mouse. (G) Features distinguishing L1 subclasses in human and mouse organized by relevance to each species. Bars show size of subclass effect (ε2 from KW test), with features ranked by the difference between human and mouse effects. Unfilled bars indicate p>0.05 (FDR-corrected).
Fig. 4:
Fig. 4:. MC4R rosehip cells.
(A) Characterization of MC4R subtypes as rosehip cells. Left: UMAP projection of transcriptomic data from MC4R and nearby subclasses. Right: example cells from each subtype. Morphologies show characteristic axonal arbors and boutons (insets: 63x MIP images, scalebars 10 μm; compare to panel D). Electrophysiology traces show sag response (hyperpolarization near −100 mV, rheobase, and rheobase +40 pA if present; scalebar 0.5s/10mV). (B) Electrophysiological and morphological features distinguishing MC4R t-types (FDR-corrected MW test vs. rest of L1, p<10−4). Boxplots show statistics of MC4R subtypes and other subclasses (box marks quartiles, whiskers extend 1.5xIQR past box). Significant pairwise comparisons (to MC4R t-types only) marked by lines above (FDR-corrected p<0.05, Dunn’s test post-hoc to KW test). (C) Gene expression of MC4R subclass (highlighted) and other L1 t-types, for between- and within-subclass marker genes (snRNA-seq). Violins show expression in log(CPM+1), normalized by gene (maximal expression noted at right). (D) Characterization of mouse L1 cells with moderate sag or irregular firing, the human rosehip type’s distinct properties (boxplots as in (B), all pairwise comparisons tested). Example morphology and electrophysiology shown for mouse Lamp5 Ntn1 Npy2r cell with highly irregular firing, but lack of rosehip-like morphology (Electrophysiology traces as in (A); image inset shows axonal boutons, scalebar 10 μm).
Fig. 5:
Fig. 5:. Burst spiking PAX6 TNFAIP8L3 cells.
(A) Reconstructed morphologies and example electrophysiology for bursting and non-bursting PAX6 t-types (TNFAIP8L3 and CDH12) (hyperpolarization near −100 mV, depolarization below rheobase, spiking at rheobase and rheobase +40 pA; scalebar 0.5s/10mV). Inset shows UMAP projection of transcriptomic data from PAX6 subclass. (B) Electrophysiological and morphological features distinguishing PAX6 TNFAIP8L3 t-type (FDR-corrected MW test vs. rest of L1, p<0.05 for morphology, <0.01 for electrophysiology). Boxplots show statistics of PAX6 subtypes and other subclasses (box marks quartiles, whiskers extend 1.5xIQR past box). Significant pairwise comparisons (to PAX6 TNFAIP8L3 only) marked by lines above (FDR-corrected p<0.05, Dunn’s test post-hoc to KW test). (C) Gene expression of human PAX6 subclass (highlighted) and other L1 t-types, for α7 type and bursting-related marker genes (snRNA-seq). Violins show expression in log(CPM+1), normalized by gene (maximal expression noted at right). (D) Characterization of mouse L1 cells with initial doublet firing in terms of the human PAX6 TNFAIP8L3 type’s distinct properties. Example morphology and electrophysiology shown from PAX6 subclass (Lamp5 Krt73 t-type). Depolarizing sag ratio is the normalized size of the hump at stimulus onset just below rheobase. (Electrophysiology traces as in (A); boxplots as in (B), all pairwise comparisons tested)
Fig. 6:
Fig. 6:. Quantifying distinctness of L1 t-types and cross-modality structure.
(A) Pairwise distinctness of human L1 t-types, from classifiers using electrophysiology (left) and gene expression (right). d’ (d-prime) is a metric of separation of distribution means, scaled relative to the standard deviation. Groups with N<4 excluded (hatched area). (B) Correlation of pairwise d’ values between transcriptomic and electrophysiological feature spaces. Pearson r=0.59, p=0.00016, shading shows bootstrapped 95% CI of regression. Within-subclass pairs shown in orange to confirm subclass structure. (C) Pairwise distinctness d’ of L1 subclasses across species and data modality. Groups with N<10 excluded. (D) Clustering of human L1 cells in electrophysiology subspaces, with correspondence to L1 subclasses. Points show all L1 neurons, with the subclass of interest in color. Background color shows cluster membership likelihoods from 2-cluster Gaussian mixture model trained on unlabeled data. F1 scores: LAMP5 0.81, MC4R 0.69, PAX6 0.89, all others 0.5 (L1 VIP and ungrouped t-types). All features normalized and Yeo-Johnson transformed to approximate Gaussian distribution.

References

    1. Cohen-Kashi Malina K, Tsivourakis E, Kushinsky D, Apelblat D, Shtiglitz S, Zohar E, Sokoletsky M, Tasaka G, Mizrahi A, Lampl I, Spiegel I, NDNF interneurons in layer 1 gain-modulate whole cortical columns according to an animal’s behavioral state. Neuron. 109, 2150–2164.e5 (2021). - PubMed
    1. Cichon J, Gan W-B, Branch-specific dendritic Ca2+ spikes cause persistent synaptic plasticity. Nature. 520, 180–185 (2015). - PMC - PubMed
    1. Abs E, Poorthuis RB, Apelblat D, Muhammad K, Pardi MB, Enke L, Kushinsky D, Pu D-L, Eizinger MF, Conzelmann K-K, Spiegel I, Letzkus JJ, Learning-Related Plasticity in Dendrite-Targeting Layer 1 Interneurons. Neuron. 100, 684–699.e6 (2018). - PMC - PubMed
    1. Letzkus JJ, Wolff SBE, Meyer EMM, Tovote P, Courtin J, Herry C, Lüthi A, A disinhibitory microcircuit for associative fear learning in the auditory cortex. Nature. 480, 331–335 (2011). - PubMed
    1. Hartung J, Letzkus JJ, Inhibitory plasticity in layer 1 – dynamic gatekeeper of neocortical associations. Current Opinion in Neurobiology. 67, 26–33 (2021). - PubMed

Publication types

LinkOut - more resources