. 2023 Oct 13;382(6667):223-230.
doi: 10.1126/science.adg1075. Epub 2023 Oct 12.

Phosphatidylinositol 3,5-bisphosphate facilitates axonal vesicle transport and presynapse assembly

Affiliations

Phosphatidylinositol 3,5-bisphosphate facilitates axonal vesicle transport and presynapse assembly

Filiz Sila Rizalar et al. Science. .

Abstract

Neurons relay information via specialized presynaptic compartments for neurotransmission. Unlike conventional organelles, the specialized apparatus characterizing the neuronal presynapse must form de novo. How the components for presynaptic neurotransmission are transported and assembled is poorly understood. Our results show that the rare late endosomal signaling lipid phosphatidylinositol 3,5-bisphosphate [PI(3,5)P2] directs the axonal cotransport of synaptic vesicle and active zone proteins in precursor vesicles in human neurons. Precursor vesicles are distinct from conventional secretory organelles, endosomes, and degradative lysosomes and are transported by coincident detection of PI(3,5)P2 and active ARL8 via kinesin KIF1A to the presynaptic compartment. Our findings identify a crucial mechanism that mediates the delivery of synaptic vesicle and active zone proteins to developing synapses.


Figures
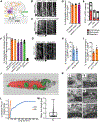
Figure 1 ∣
Figure 1 ∣. Nascent SV and active zone proteins are cotransported in iN axons.
(A) Scheme of the presynaptic compartment. (B,C) Kymographs showing the trafficking of endogenous SYPendo-eGFP with VAMP2-SNAP (B) or MUNC13-1-SNAP (C). X-axis=30 μm, Y-axis=1 min. Vertical lines=static foci. Scale bar, 10 μm. (D) Fraction of anterogradely moving SYPendo-eGFP vesicles co-trafficking with SYP-SNAP (87.3 ± 3.2%), VAMP2-SNAP (87.1 ± 4.3%), MUNC13-1-SNAP (88.4 ± 7.0%). n=4 experiments (≥ 50 vesicles each). (E) Number of anterogradely trafficking SYPendo-eGFP vesicles (per min/ 30 μm length) in proximal axons of day 12-13 iNs following 24h incubation with DMSO, CHX or Anisomycin: DMSO, 11.5 ± 1.3; CHX 2.2 ± 0.2; Anisomycin, 2.1 ± 0.1. n = 3 experiments (≥ 50 vesicles each). One-way ANOVA followed by Dunnett’s post-test; p<0.0001 ****; p<0.01 **; p>0.05 ns. (F) Fraction of anterogradely moving vesicles co-labeled for SYP-mRFP and SYP-eGFP (92.8 ± 2.6%), vGlut1-venus (89.6 ± 3.3%), eGFP-Bassoon (79.2 ± 7.5%), MUNC13-1-eGFP (82.7 ± 5.9%), Neurexin1β-eGFP (83.4 ± 3.4%), or Mito-Halo (6.5 ± 1.8%) in proximal axons of mouse hippocampal neurons. n=3 experiments (≥ 50 vesicles each). (G) Kymographs illustrating co-trafficking of endogenous SYPendo-eGFP with ARL8B-iRFP in iN. X-axis=30 μm. Y-axis=1 min. Vertical lines=static foci. Scale bars, 10 μm. (H) Fraction of anterogradely moving SYPendo-eGFP vesicles co-labeled for LAMP1-mRFP (61.0 ± 10.4%) or ARL8B-iRFP (56.3 ± 6.3%). n=5 experiments (≥ 50 vesicles each). (I) Fraction of anterogradely moving LAMP1endo-eGFP vesicles co-labeled for SYP-mRFP (44.0 ± 6.4%) or Syt1-mRFP (62.9 ± 8.9%). n=4 experiments (≥ 50 vesicles each). (J) 3D reconstruction of PVs (green) recruited to mitochondrion (red). Scale bar, 500 nm. (K) Ultrastructure of PVs recruited to mitochondria analyzed by FIB-SEM. * marks vesicles. Scale bars, 100 nm. (L) Cumulative plot of diameters of PVs and SVs. (M) Violin plot of the distribution of PV sizes. Whiskers show the min/max, box borders indicate 1st and 3rd quartiles, line indicates the median. Data are mean ± SEM.
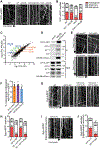
Figure 2 ∣
Figure 2 ∣. Axonal transport of PVs is controlled by ARL8A/B and KIF1A.
(A) Kymographs of trajectories of SYP-eGFP vesicles in WT or ARL8A/B double KO iN. X-axis=30 μm. Y-axis=1 min. Scale bar, 10 μm. (B) Number of anterogradely moving SYP-eGFP vesicles (per min/ 30 μm length): WT, 9.2 ± 0.6; WT + ARL8B-Myc, 8.7 ± 1.4; ARL8A/B double KO, 2.6 ± 0.9; ARL8A/B double KO + ARL8B-Myc, 7.9 ± 1.7. n = 3 experiments (≥ 50 vesicles each). One-way ANOVA followed by Dunnett’s post-test; p<0.0001 ****; p<0.01 **; p>0.05 ns. (C) Scatter plot of ARL8B-mCherry interacting proteins in iN. Blue, lysosomal proteins; green, kinesins; orange, SV proteins. (D) Co-immunoprecipitation of ARL8B-mCherry with KIF1A-eGFP in developing iNs. Bound proteins were detected by immunoblotting. Input, 5% of total lysate. (E) Kymographs illustrating co-trafficking of KIF1A-eGFP with SYP-mRFP (top) or ARL8B-mCherry (bottom) in iN. X-axis=30 μm. Y-axis=1 min. Scale bars, 10 μm. (F) Fraction of anterogradely moving SYP-mRFP (76.9 ± 6.5%), MUNC13-1-SNAP (79.7 ± 5.9%), or ARL8B-mCherry (64.1 ± 10.1%) puncta co-trafficking with KIF1A-eGFP. n = 5 experiments (≥ 50 vesicles each). (G) Kymographs of trajectories of SYP-eGFP vesicles in iNs that are WT, KIF1A KO, or KO expressing full-length KIF1A or Rigor mutant KIF1A. X-axis=30 μm. Y-axis=1 min. Scale bar, 10 μm. (H) Number of anterogradely moving, retrogradely moving, or stationary SYP-eGFP vesicles (per min/ 30 μm length): WT, 9.7 ± 1.7; KIF1A KO, 2.4 ± 0.5; KO + KIF1A-FL, 8.7 ± 0.3; KO + KIF1A-rigor, 2.4 ± 0.3. n = 3 experiments (≥ 50 vesicles each). One-way ANOVA followed by Dunnett’s post-test; p<0.0001 ****; p<0.01 **; p>0.05 ns. (I) Kymographs showing trajectories of SYP-mRFP vesicles in primary mouse hippocampal neurons expressing full length KIF1A or Rigor mutant KIF1A. Scale bar, 10 μm. (J) Number of anterogradely moving SYP-mRFP vesicles (per min/ 30 μm length) in mouse hippocampal neurons: KIF1A-FL, 8.1 ± 1.1; KIF1A-Rigor, 2.5 ± 0.8. n = 3 experiments (≥50 synaptic puncta each). t test; p<0.0001 ****; p<0.01 **; p>0.05 ns. Data are mean ± SEM.
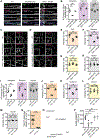
Figure 3 ∣
Figure 3 ∣. Loss of ARL8A/B or KIF1A/ Unc104 impairs presynaptic biogenesis and function.
(A) Representative confocal images of WT iNs, ARL8A/B double KO iNs or double KO iNs expressing ARL8B-c-myc at day 30 immunostained for presynaptic Bassoon, postsynaptic Homer1 and MAP2. Scale bar, 5 μm. (B) Number of synapses and of pre- and postsynaptic puncta per 20 μm dendrite length. n = 3 experiments ( ≥50 puncta each). (C,D) Representative confocal images of WT iN, ARL8A/B double KO iN or double KO iN expressing ARL8B-c-myc at day 30 immunostained for Synaptophysin (C), Bassoon (D) and Homer1 (C,D). Scale bars, 10 μm. (E-H) Quantified mean fluorescence intensity of pre- and postsynaptic proteins in WT iN, ARL8A/B double KO iN or double KO iN expressing ARL8B-c-myc (day 30). n=3 experiments (≥100 synapses each). SYP, Synaptophysin (E), Bassoon (F), Cav2.1 (G), Homer1 (H). (I) Number of synapses and of pre- and postsynaptic puncta per 20 μm dendrite length in WT iNs, KIF1A KO iNs or KO iNs expressing KIF1A (day 30). n = 3 experiments (≥50 puncta each). (J-M) Quantified mean fluorescence intensity of pre- and postsynaptic proteins in WT iNs, KIF1A KO iNs or KO iNs expressing KIF1A (day 30). See (E-H) for abbreviations. n = 3 experiments (≥100 synaptic puncta each). (N) Defective presynaptic biogenesis in absence of Unc104-mediated PV delivery in D. melanogaster. Reduced amounts of VGLUT at Unc104 mutant NMJs. WT, 100 ± 11; Unc104, 6.3 ± 0.8. n = 10 (WT) and 10 (Unc104) NMJs. t test; *P < 0.05, *P < 0.01, ****P < 0.0001. (O) Schematic representation of pre- and postsynaptic calcium sensors SYP-CGaMP6f and Xph20-CGaMP7f. (P) Mean ΔF/F0 response of Xph20-CGaMP7f to 100 action potentials (APs) (10 Hz, 10 s) stimulation in WT, ARL8A/B double KO or KIF1A KO iNs. Data were normalized to pre-stimulation. n=3 independent experiments. (B, E-M) One-way ANOVA followed by Dunnett’s post-test; p<0.0001 ****; p<0.01 **; p>0.05 ns. All data represent mean ± SEM.
Figure 4 ∣
Figure 4 ∣. PI(3,5)P2 synthesis regulates presynaptic biogenesis.
(A) Motility of SYP-mRFP vesicles in WT and ARL8A/B double KO iNs transduced with control lentivirus (shCTRL) or following lentiviral knockdown of Myrlysin, Diaskedin, or PIKFYVE. n = 3 experiments (≥ 50 vesicles each). (B) PI(3,5)P2 measured by quantitative ratiometric imaging in situ: WT, 0.05 ± 0.004; shMyrlysin, 0.15 ± 0.01. t test; *P < 0.05, **P < 0.01, ****P < 0.0001. (C) Depletion of PI(3)P or PI(3,5)P2 inhibits anterograde transport of SYPendo-eGFP vesicles in iNs. Number of SYPendo-eGFP vesicles (per min/ 30 μm length) moving anterogradely, retrogradely, or remaining stationary per minute in iNs treated (30 min) with DMSO, VPS34-IN1 or Apilimod. DMSO, 11.1 ± 2.2; VPS34-IN1, 1.7 ± 0.9; Apilimod, 3.6 ± 1.1. n = 5 experiments (≥ 50 vesicles each). (D) Number of anterogradely-moving SYP-eGFP vesicles in day 12-14 iNs (per min/ 30 μm length): WT, 8.5 ± 0.9; PIKFYVE KO #1, 3.8 ± 0.05; PIKFYVE KO #2, 2.5 ± 0.4; PIKFYVE KO #3, 4.3 ± 0.2. n = 3 experiments (≥ 50 vesicles each). (E) 2xPH-(KIF1A) associates with PI(3,5)P2 liposomes. Bound fraction (% of total): No liposomes, 1.7 ± 0.6%; no PI, 5.5 ± 2.0%; PI(3,5)P2, 60.9 ± 4.0%; PI(4,5)P2, 12.9 ± 5.5%; PI(3)P, 24.0 ± 8.1%. n = 4 experiments. (A,C,D,E) One-way ANOVA followed by Dunnett’s post-test; p<0.0001 ****; p<0.01 **; p>0.05 ns. (F) Colocalization of endogenous mCherry-PIKFYVE with VAMP2 or SYT1 (green) in iN axons. Scale bar, 10 μm. Bottom, line intensity scans from 10 μm segments. (G) Representative confocal images of iN axons expressing SYP-mRFP and microinjected with the PI(3,5)P2-sensing fluorophore-labeled ep85α-cSH2 domain. Scale bar, 10 μm. Bottom, line intensity scans from 10 μm segments. (H) Confocal images of WT and Fab1 mutant NMJs stained for VGLUT (green) and HRP as axonal membrane marker (magenta). Top: overview. Scale bars, 5 μm. Insets, zooms. Scale bars, 2 μm. (I) Quantification of representative data shown in (H). WT, 100 ± 11.7; Fab1-RNAi, 51.2 ± 5.5. n=10 NMJs each. t test; *P < 0.05, **P < 0.01, ****P < 0.0001. Data are mean ± SEM.

References

    1. Nunnari J, Walter P, Regulation of organelle biogenesis. Cell 84, 389–394 (1996). - PubMed
    1. Warren G, Wickner W, Organelle inheritance. Cell 84, 395–400 (1996). - PubMed
    1. Takamori S. et al., Molecular Anatomy of a Trafficking Organelle. Cell 127, 831–846 (2006). - PubMed
    1. Zhai RG, Bellen HJ, The architecture of the active zone in the presynaptic nerve terminal. Physiology (Bethesda) 19, 262–270 (2004). - PubMed
    1. Sudhof TC, The presynaptic active zone. Neuron 75, 11–25 (2012). - PMC - PubMed

MeSH terms

Substances