. 2023 Oct 13;382(6667):eadf5357.
doi: 10.1126/science.adf5357. Epub 2023 Oct 13.

Single-cell DNA methylation and 3D genome architecture in the human brain

Affiliations

Single-cell DNA methylation and 3D genome architecture in the human brain

Wei Tian et al. Science. .

Abstract

Delineating the gene-regulatory programs underlying complex cell types is fundamental for understanding brain function in health and disease. Here, we comprehensively examined human brain cell epigenomes by probing DNA methylation and chromatin conformation at single-cell resolution in 517 thousand cells (399 thousand neurons and 118 thousand non-neurons) from 46 regions of three adult male brains. We identified 188 cell types and characterized their molecular signatures. Integrative analyses revealed concordant changes in DNA methylation, chromatin accessibility, chromatin organization, and gene expression across cell types, cortical areas, and basal ganglia structures. We further developed single-cell methylation barcodes that reliably predict brain cell types using the methylation status of select genomic sites. This multimodal epigenomic brain cell atlas provides new insights into the complexity of cell-type-specific gene regulation in adult human brains.


Conflict of interest statement

Competing interests: J.R.E is a member of the scientific advisor for Zymo Research In. and Ionis Pharmaceuticals. B.R. is a co-founder and consultant of Arima Genomics Inc. and co-founder of Epigenome Technologies. W.T and J.R.E have filed a provisional patent related to the findings presented in this paper. The patent application number is US provisional application No. 63/427,789 filed November 23, 2022, and assigned to Salk Institute for Biological Studies.

Figures

Figure 1.
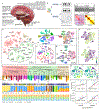
Figure 1.. Epigenomic profiling of human brain cells with snmC-seq3 and snm3C-seq.
(A) Human brain structures and regions covered. (B) Schematics of profiling modalities of snmC-seq3 and snm3C-seq. (C) Iterative clustering and annotation of human brain nuclei. Cells from the whole mC dataset, from the inhibitory/non-telencephalic neuron cell class, and from the SubCtx-Cplx major type are visualized successively using t-distributed stochastic neighbor embedding (t-SNE), colored by the cell groups annotated in the corresponding iterations. (D) The robust dendrogram of the major types and the meta info of subtype numbers, brain structure, and donor origins. The color palettes are shared across this study. (E) CH-methylation of excitatory and inhibitory markers (SLC17A1 and GAD1) of the major type SubCtx-Cplx. (F) Human brain cells are colored by the dissection regions. (G) 2D visualization of brain nuclei profiled by snm3C-seq. (H) Variation of global CG- and CH-methylation across brain cell types. (I) Correlations between global DNA methylation and gene expressions of MECP2 and DNMT1 across major types.
Figure 2.
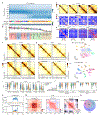
Figure 2.. Diversity of 3D genome structures across major types.
(A) Frequency of contacts against genomic distance in each single cell, Z-score normalized within each cell (column). The cells are grouped by major type and then ordered by the median log2 short/long ratio over cells. The y-axis is binned at log2 scale. (B) log2 short/long ratio of major types, ordered the same as in (A).(C) Imputed contact maps of four major types. (D) Heatmaps show the correlation matrices of distance normalized contact maps in (C), and line plots show the first principal component of the correlation matrices. (E) Zoom in view of two matrices in (D) and the corresponding correlation matrices of mCG across cells. (F and G) Imputed contact matrices (heatmap), boundary probabilities (blue lines), insulation scores (orange lines), differential boundaries (red dots in line plots), and differential loops (cyan dots in heatmaps) of excitatory IT neurons at FOXP2 locus (a marker of cell type L4-IT; F) or CGE-derived inhibitory neurons at LAMP5 locus (a marker of Lamp5 and Lamp5-Lhx6; G). Grey shade represents the gene body (TSS to TES). (H) t-SNE plot of cells (n=5,707) using domains (top) or loops (bottom) as features, colored by major types. (I) PCC between compartment score, boundary probability, or loop interaction strength and ATAC signals, mCG and mCH fractions of the bin(s) across all major types for all genes (left) or top DEGs only (right). (J) PCC between compartment scores, boundary probabilities, or loop interaction strength and gene expression across all major types for different categories of overlap (x-axis) using all genes (left) or top DEGs (right). (K and L) Proportion of significantly positively or negatively correlated compartment (K) or domain boundary (L) out of all the bins located at different positions relative to a gene, average across the top neuronal DEGs. (M) Proportion of significantly correlated loop pixels out of all the loop pixels (left), ratio between positively and negatively correlated loop pixels (middle), or average PCC of significantly correlated loop pixels (right) located at different positions relative to a gene, average across the top neuronal DEGs. (N) The number of genes, out of the top neuronal DEGs, having significantly positively correlated compartments, domain boundaries overlap the gene body, or loop pixels within the gene body or with at least one anchor overlaps the TSS or TES of the gene. 35 genes were not included in any of the three circles.
Figure 3.
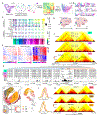
Figure 3.. Gene regulation in brain cells.
(A) mCG of cell type-specific DMRs across 188 cell subtypes. (B) CH-hypomethylated transcription factors and the enrichment of their motifs in CG hypo-DMRs. The lower panel showed average methylation fractions of transcription factor PBX3 in its potential binding sites across the whole genome. (C) Workflow of determining putative CREs. (D) Distribution of correlation between methylation of putative CREs and the corresponding genes from different filtering. (E) Numbers of putative CREs and overlapping proportions with open chromatin regions for different filtering. (F) Heatmaps showing mCG of putative CREs, mCH and expression of the target genes, and contact strength of the corresponding loops. (G) The gene body mCH, DMR mCG, and 3D chromatin organization around the gene SYT1 in the major types L2/3-IT and MSN-D1. (H) Heatmap showing the results of LDSC analysis of the variants associated with the indicated traits or diseases in DMRs identified from major human cell types. The asterisks indicate the magnitude of p-values (*=−1, **=−2, ***=−3, and ****=−4).
Figure 4.
Figure 4.. Regional axes of cortical and subcortical cells.
(A) Workflow of determining regional axis from single-nucleus DNAm. (B) 2D visualization of cortical neurons in regional spaces, colored by dissection locations. (C) The common regional axis among cortical neurons. The scatter plot showed how regional indices vary in each cortical region. (D) Schematic of example cortical dissection locations. (E) Regional gradients in mCG of rDMRs, and mCH and expression of rDMGs in L2/3-IT cells. (F) Regional difference in chromatin conformation around NR2F1. The blue and purple numbers showed respectively the relative domain strength and promoter strength of each domain. (G) Zoom-in view of example differential-loop-overlapping rDMRs marked in F. In the decreasing domain (left), the methylation fractions increase from V1C to A46 to LEC, while the methylation fractions decrease in the increasing domain (right). (H) Inhibitory neurons in basal ganglia showed an L–D–V axis in DNA methylation (I) 2D t-SNE visualization of MSN-D1. Cells from NAC, CaB and Pu were highlighted. (J) Regional differences of gene body mCH-methylation and expression of LSAMP in MSN-D1. (K) Regional difference in chromatin conformation around LSAMP in MSN-D1.
Figure 5.
Figure 5.. Cross-species comparison between human and mouse brain cell methylomes.
(A) Integration of single-cell methylomes between human and mouse brains, visualized using 2D t-SNE. (B) Discrepancy between cell types of human and mouse brains in cell types L4-IT, HIP-Misc1, and HIP-Misc2. (C) CH-hypomethylation and gene expression of TF TSHZ2 in the cell types HIP-Misc1 and HIP-Misc2. (D) Correlated global mCH and mCG of conserved cell types between human and mouse. (E) Schematic of cross-species matching of cell type DMRs. (F) Overall, ~50% of DMRs have orthologous sequences in the other species, among which ~25% are reciprocal DMRs. (G) Distribution of cross-species correlation of DMR methylations (red) and the randomly shuffled background (black). (H) Examples of methylation fractions of hcCnsvDMRs. (I) The enrichment of the hcCnsvDMRs in the histone modification marks. (H) Browser view of hcCnsvDMRs around gene INPP5J in major type Pvalb. The regions colored by red are the cell type-specific distal enhancers validated in Ref (54).
Figure 6.
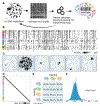
Figure 6.. snMCodes for brain cell types.
(A) Workflow of deriving snMCodes. (B) snMCodes derived from all three donors. (C) Examples of cell-type specificity of snMCode features. (D) Heatmap showing confusion matrix of snMCodes in predicting cell types. (E) Cell-type-prediction accuracy in cross-donor test. (F) snMCodes predict human cell types with a limited number of CpG sites at single-cell resolution.

References

    1. Liu H, Zhou J, Tian W, Luo C, Bartlett A, Aldridge A, Lucero J, Osteen JK, Nery JR, Chen H, Rivkin A, Castanon RG, Clock B, Li YE, Hou X, Poirion OB, Preissl S, Pinto-Duarte A, O’Connor C, Boggeman L, Fitzpatrick C, Nunn M, Mukamel EA, Zhang Z, Callaway EM, Ren B, Dixon JR, Behrens MM, Ecker JR, DNA methylation atlas of the mouse brain at single-cell resolution. Nature. 598, 120–128 (2021). - PMC - PubMed
    1. Li YE, Preissl S, Hou X, Zhang Z, Zhang K, Qiu Y, Poirion OB, Li B, Chiou J, Liu H, Pinto-Duarte A, Kubo N, Yang X, Fang R, Wang X, Han JY, Lucero J, Yan Y, Miller M, Kuan S, Gorkin D, Gaulton KJ, Shen Y, Nunn M, Mukamel EA, Behrens MM, Ecker JR, Ren B, An atlas of gene regulatory elements in adult mouse cerebrum. Nature. 598, 129–136 (2021). - PMC - PubMed
    1. Lee D-S, Luo C, Zhou J, Chandran S, Rivkin A, Bartlett A, Nery JR, Fitzpatrick C, O’Connor C, Dixon JR, Ecker JR, Simultaneous profiling of 3D genome structure and DNA methylation in single human cells. Nat. Methods. 16, 999–1006 (2019). - PMC - PubMed
    1. He Y, Hariharan M, Gorkin DU, Dickel DE, Luo C, Castanon RG, Nery JR, Lee AY, Zhao Y, Huang H, Williams BA, Trout D, Amrhein H, Fang R, Chen H, Li B, Visel A, Pennacchio LA, Ren B, Ecker JR, Spatiotemporal DNA methylome dynamics of the developing mouse fetus. Nature. 583, 752–759 (2020). - PMC - PubMed
    1. Luo C, Keown CL, Kurihara L, Zhou J, He Y, Li J, Castanon R, Lucero J, Nery JR, Sandoval JP, Bui B, Sejnowski TJ, Harkins TT, Mukamel EA, Behrens MM, Ecker JR, Single-cell methylomes identify neuronal subtypes and regulatory elements in mammalian cortex. Science. 357, 600–604 (2017). - PMC - PubMed