. 2024 Jan 4;143(1):57-63.
doi: 10.1182/blood.2023020554.

Ibrutinib-based therapy reinvigorates CD8+ T cells compared to chemoimmunotherapy: immune monitoring from the E1912 trial

Affiliations

Ibrutinib-based therapy reinvigorates CD8+ T cells compared to chemoimmunotherapy: immune monitoring from the E1912 trial

Despoina Papazoglou et al. Blood. .

Abstract

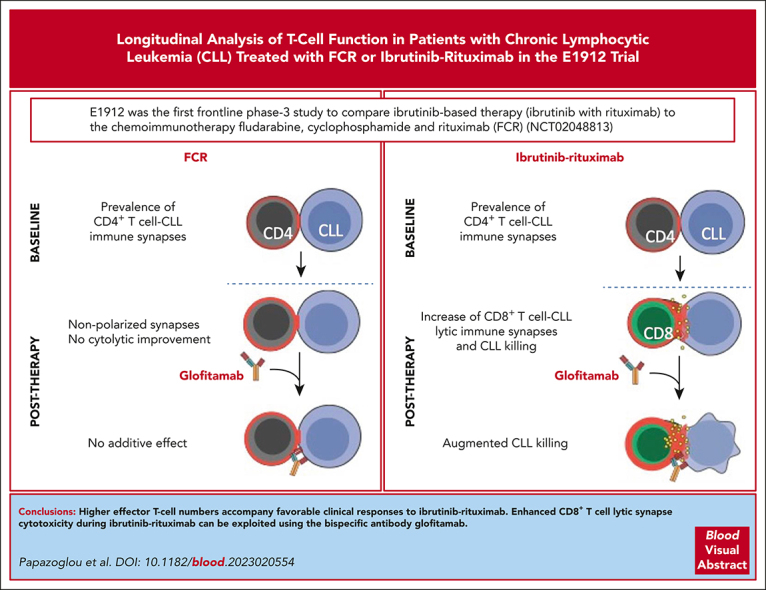
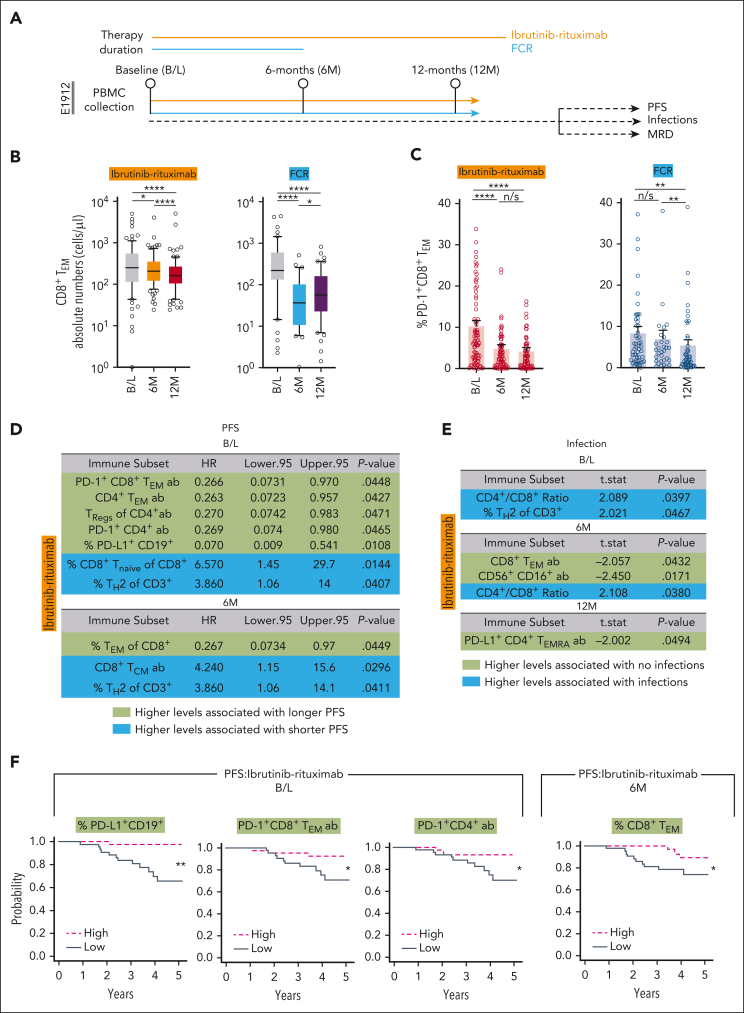
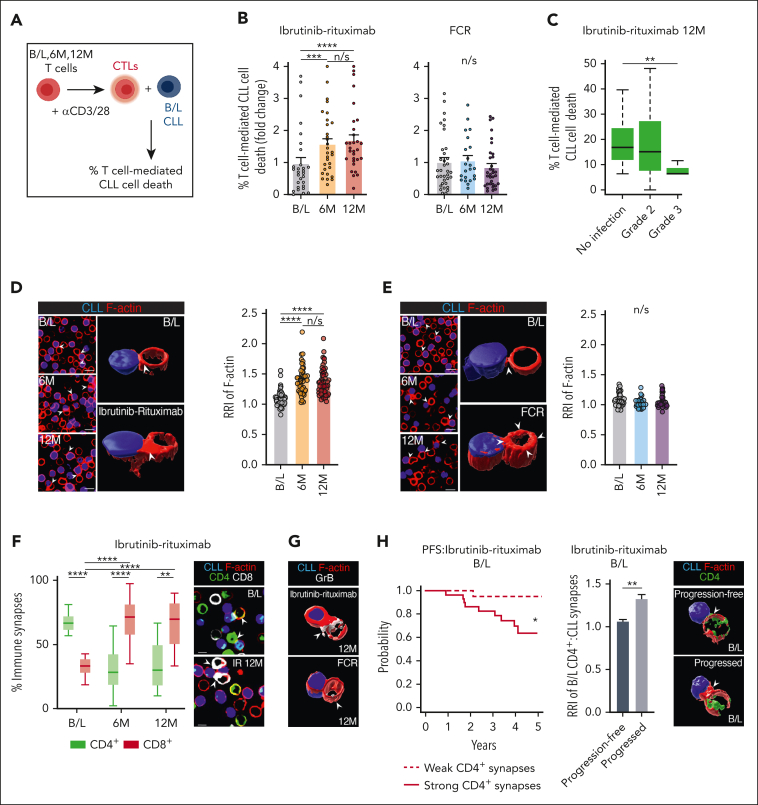
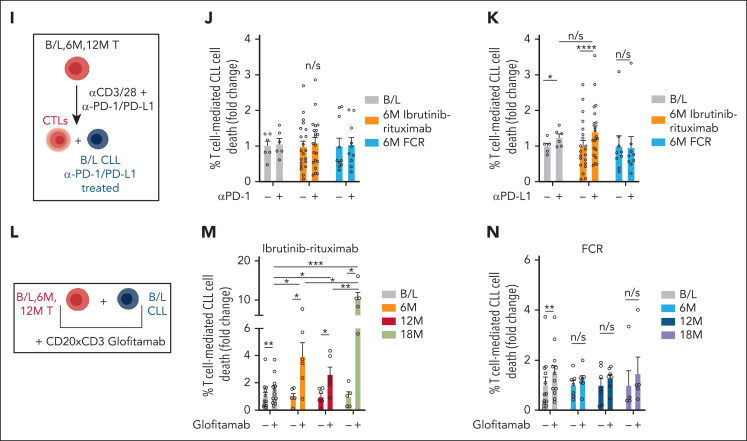
Bruton tyrosine kinase inhibitors (BTKis) that target B-cell receptor signaling have led to a paradigm shift in chronic lymphocytic leukemia (CLL) treatment. BTKis have been shown to reduce abnormally high CLL-associated T-cell counts and the expression of immune checkpoint receptors concomitantly with tumor reduction. However, the impact of BTKi therapy on T-cell function has not been fully characterized. Here, we performed longitudinal immunophenotypic and functional analysis of pretreatment and on-treatment (6 and 12 months) peripheral blood samples from patients in the phase 3 E1912 trial comparing ibrutinib-rituximab with fludarabine, cyclophosphamide, and rituximab (FCR). Intriguingly, we report that despite reduced overall T-cell counts; higher numbers of T cells, including effector CD8+ subsets at baseline and at the 6-month time point, associated with no infections; and favorable progression-free survival in the ibrutinib-rituximab arm. Assays demonstrated enhanced anti-CLL T-cell killing function during ibrutinib-rituximab treatment, including a switch from predominantly CD4+ T-cell:CLL immune synapses at baseline to increased CD8+ lytic synapses on-therapy. Conversely, in the FCR arm, higher T-cell numbers correlated with adverse clinical responses and showed no functional improvement. We further demonstrate the potential of exploiting rejuvenated T-cell cytotoxicity during ibrutinib-rituximab treatment, using the bispecific antibody glofitamab, supporting combination immunotherapy approaches.


Conflict of interest statement

Conflict-of-interest disclosure: S.H., M.B., and C.K. are employees of and declare patents and stock ownership with Roche Glycart AG. A.G.R. has received research support from Roche Glycart AG to Institution as part of a research collaboration. The remaining authors declare no competing financial interests.

Figures

None
Graphical abstract
Figure 1.
Figure 1.
Higher CD8+T-cell numbers at baseline and early on-therapy associate with favorable PFS and no infections with ibrutinib-rituxumab. (A) Schematic representation of the E1912 trial and biobanked peripheral blood mononuclear cell samples collected at baseline (B/L) and 6- (6M) and 12- (12M) month time points for correlative T-cell analysis. PFS, infection, and MRD clinical outcome data were collected. (B) Absolute numbers of CD8+ TEM cell subsets (CD45RACCR7) for ibrutinib-rituximab (n = 86 patients) and FCR (n = 50) at the time points indicated. Patient data are presented as Box and whiskers (10-90 percentile; log scale) plots. (C) Percentage of PD-1+ CD8+ TEM subsets during ibrutinib-rituximab (n = 86) or FCR (n = 50) treatments. (B-C) Data are given as the mean ± standard error of the mean; statistical analysis between time points were assessed using the Wilcoxon signed-rank test. (D) Tabular schematic summary of the significant correlations (Cox model) between higher immune subset levels (flow cytometry, median values used as cut-off point) and PFS for patients on ibrutinib-rituximab (n = 88 patients with 13 experiencing disease progression). Green rows (correlations with hazard ratio [HR] values < 1) indicate higher immune subsets associated with longer PFS, whereas higher immune subsets associating with shorter PFS (HR > 1) are highlighted in blue rows. Confidence intervals (95%) and P values are shown. (E) Schematic summary of the significant correlations (Wilcoxon test) between immune subsets and infection (any infection) during ibrutinib-rituximab treatment (n = 88 patients). Negative t statistics (t.stat) indicate higher immune subset levels in patients who did not develop infection (green rows). In contrast, correlations with a positive t.stat indicate higher immune subset levels in patients who developed infection (blue rows). (F) Kaplan-Meier curves of immune subsets associated to good prognosis for the ibrutinib-rituximab arm. Higher levels of percentage PD-L1+ CD19+ cells (high: 12 progression events per 43 patients and low: 1 progression event per 43 patients), absolute number of PD-1+CD8+ TEM (high: 3 progression events per 43 patients and low: 10 progression events per 43 patients), and PD-1+CD4+ T cells (high: 3 progression events per 43 patients and low: 10 progression events per 43 patients) at baseline associate with longer PFS. Higher percentage of CD8+ TEM (high: 3 progression events per 42 patients and low: 10 progression events per 43 patients) at the 6-month time point associate with longer PFS. Absolute number data are referred to as “ab.” P values indicated. ∗P < .05; ∗∗P < .01; ∗∗∗∗P < .0001. n/s, not significant.
Figure 2.
Figure 2.
Ibrutinib-rituximab promotes CD8+ T-cell lytic synapse activity and supports immunotherapy-triggered anti-CLL killing function. (A) Illustration of the autologous cytotoxicity assay using anti-CD3/-CD28–activated T cells (cytolytic T lymphocytes [CTLs]) from B/L, 6M, and 12M time points mixed with target B/L CLL B cells (pulsed with superantigen as a model antigen) with flow-based quantification of T-cell killing function. (B) T-cell–mediated CLL cell death comparing T cells purified from B/L, 6M, and 12M time point samples (n = 30 patients per treatment arm). Data at 6M and 12M were normalized to B/L levels to generate fold change values for each patient. (C) The association between patient’s T-cell killing function (12M ibrutinib-rituximab time point, n = 30) and infection status during ibrutinib-rituximab therapy (no infections vs grade 2 or 3 infections) (Wilcoxon test, P = .01). (D-E) Representative confocal medial optical section and 3-dimensional (3D) volume–rendered images of T-cell:CLL conjugates formed between patient T cells (B/L, 6M, and 12M on-ibrutinib-rituximab [D] or FCR [E]) interacting with autologous B/L CLL B cells (blue, CMAC dyed). Bar charts: quantitative relative recruitment index (RRI) analysis of F-actin polarization (red, rhodamine phalloidin) in T-cell:CLL conjugates (n = 50 patients per treatment arm). (F) Box and violin plots (minimum-maximum) showing the percentage of CD4+ or CD8+ T-cell:CLL conjugates formed from the total T-cell:CLL conjugates in B/L, 6M, and 12M ibrutinib-rituximab time point samples (n = 15 patients). Representative confocal images of CD8+ (white) and CD4+ (green) T-cell conjugates with CLL B cells (blue) at B/L vs on ibrutinib-rituximab therapy. (G) Representative confocal 3D volume–rendered images of granzyme B (GrB; white) expression at CD8+ T-cell synapses, comparing ibrutinib-rituximab and FCR 12M time point samples. (H) Kaplan-Meier curve showing the association between the strength of polarized F-actin CD4+ T-cell:CLL immune synapse interactions in patient B/L samples and their PFS outcomes during ibrutinib-rituximab administration. Median F-actin RRI values were used as a cut-off point to determine weak (<median RRI) vs strong (>median RRI) CD4+ T-cell synapses (n = 52 patients). Patients’ showing strong CD4+ T-cell:CLL immune synapses at B/L showed significantly adverse PFS (9 progression events per 29 patients) compared with patients showing weak CD4+ T-cell:CLL interactions (1 progression event per 23 patients). (Cox model, P = .01; HR, 9.14; 95% confidence interval, 1.15-72.47). Bar chart: F-actin RRI analysis of CD4+ T-cell:CLL conjugates at B/L and representative 3D volume–rendered confocal images comparing patients who progressed (n = 7) with those who did not (progression free, n = 7) during ibrutinib-rituximab therapy. (I) Illustration of the cytotoxicity assay after ex vivo treatment of purified T cells (B/L, 6M, and 12M time points) and B/L CLL cells with anti–PD-1 (αPD-1) or anti–PD-L1 (αPD-L1) blocking antibodies (10 μg/mL) or isotype controls. (J-K) T-cell killing function against autologous B/L CLL cells examining T cells at B/L or at the 6-month ibrutinib-rituximab (orange) or FCR (blue) time points after ex vivo treatment with (J) αPD-1 or isotype control (indicated using “−”) (B/L: n = 6, ibrutinib-rituximab: n = 13, and FCR: n = 15) or (K) αPD-L1 or isotype control (−) (B/L: n = 6, ibrutinib-rituximab: n = 23, and FCR: n = 13). (L) Illustration of the autologous cytotoxicity assay incorporating the CD20 × CD3 glofitamab or a nonbinding antibody control. (M-N) T-cell–mediated CLL cell death using purified T cells from B/L, 6M, 12M, or 18M ibrutinib-rituximab (M) or FCR (N) time points against target B/L CLL B cells after ex vivo treatment with glofitamab (0.01 μg/mL) or nonbinding antibody control (indicated as “−”) (B/L, n = 13; ibrutinib-rituximab 6M and 12M,n = 6; ibrutinib-rituximab 18M, n = 5; FCR 6M and 12M, n = 7; and FCR 18M, n = 5 patient samples). Data for all cytotoxicity assay timepoints were normalized to isotype antibody control for panels J-K or nonbinding antibody control for panels M-N treated sample levels and presented as fold change data for each immunotherapy treated patient sample. Wilcoxon signed-rank test for panels B,D-E,J-K,M-N, multiple comparisons mixed effect analysis of variance for panel F and Mann-Whitney U test for panel H. Mann-Whitney U test was used to compare cell death among CD20-TCB–treated conditions at B/L, 6M, 12M, and 18M. Original magnification ×63; scale bars, 10 μm. Bar chart data are presented as mean ± standard error of the mean. ∗P < .05; ∗∗P < .01; ∗∗∗P < .001; ∗∗∗∗P < .0001. CMAC, CellTracker Blue (7-amino-4-chloromethylcoumarin); TCB, T-cell bispecific antibody.
Figure 2.
Figure 2.
Ibrutinib-rituximab promotes CD8+ T-cell lytic synapse activity and supports immunotherapy-triggered anti-CLL killing function. (A) Illustration of the autologous cytotoxicity assay using anti-CD3/-CD28–activated T cells (cytolytic T lymphocytes [CTLs]) from B/L, 6M, and 12M time points mixed with target B/L CLL B cells (pulsed with superantigen as a model antigen) with flow-based quantification of T-cell killing function. (B) T-cell–mediated CLL cell death comparing T cells purified from B/L, 6M, and 12M time point samples (n = 30 patients per treatment arm). Data at 6M and 12M were normalized to B/L levels to generate fold change values for each patient. (C) The association between patient’s T-cell killing function (12M ibrutinib-rituximab time point, n = 30) and infection status during ibrutinib-rituximab therapy (no infections vs grade 2 or 3 infections) (Wilcoxon test, P = .01). (D-E) Representative confocal medial optical section and 3-dimensional (3D) volume–rendered images of T-cell:CLL conjugates formed between patient T cells (B/L, 6M, and 12M on-ibrutinib-rituximab [D] or FCR [E]) interacting with autologous B/L CLL B cells (blue, CMAC dyed). Bar charts: quantitative relative recruitment index (RRI) analysis of F-actin polarization (red, rhodamine phalloidin) in T-cell:CLL conjugates (n = 50 patients per treatment arm). (F) Box and violin plots (minimum-maximum) showing the percentage of CD4+ or CD8+ T-cell:CLL conjugates formed from the total T-cell:CLL conjugates in B/L, 6M, and 12M ibrutinib-rituximab time point samples (n = 15 patients). Representative confocal images of CD8+ (white) and CD4+ (green) T-cell conjugates with CLL B cells (blue) at B/L vs on ibrutinib-rituximab therapy. (G) Representative confocal 3D volume–rendered images of granzyme B (GrB; white) expression at CD8+ T-cell synapses, comparing ibrutinib-rituximab and FCR 12M time point samples. (H) Kaplan-Meier curve showing the association between the strength of polarized F-actin CD4+ T-cell:CLL immune synapse interactions in patient B/L samples and their PFS outcomes during ibrutinib-rituximab administration. Median F-actin RRI values were used as a cut-off point to determine weak (<median RRI) vs strong (>median RRI) CD4+ T-cell synapses (n = 52 patients). Patients’ showing strong CD4+ T-cell:CLL immune synapses at B/L showed significantly adverse PFS (9 progression events per 29 patients) compared with patients showing weak CD4+ T-cell:CLL interactions (1 progression event per 23 patients). (Cox model, P = .01; HR, 9.14; 95% confidence interval, 1.15-72.47). Bar chart: F-actin RRI analysis of CD4+ T-cell:CLL conjugates at B/L and representative 3D volume–rendered confocal images comparing patients who progressed (n = 7) with those who did not (progression free, n = 7) during ibrutinib-rituximab therapy. (I) Illustration of the cytotoxicity assay after ex vivo treatment of purified T cells (B/L, 6M, and 12M time points) and B/L CLL cells with anti–PD-1 (αPD-1) or anti–PD-L1 (αPD-L1) blocking antibodies (10 μg/mL) or isotype controls. (J-K) T-cell killing function against autologous B/L CLL cells examining T cells at B/L or at the 6-month ibrutinib-rituximab (orange) or FCR (blue) time points after ex vivo treatment with (J) αPD-1 or isotype control (indicated using “−”) (B/L: n = 6, ibrutinib-rituximab: n = 13, and FCR: n = 15) or (K) αPD-L1 or isotype control (−) (B/L: n = 6, ibrutinib-rituximab: n = 23, and FCR: n = 13). (L) Illustration of the autologous cytotoxicity assay incorporating the CD20 × CD3 glofitamab or a nonbinding antibody control. (M-N) T-cell–mediated CLL cell death using purified T cells from B/L, 6M, 12M, or 18M ibrutinib-rituximab (M) or FCR (N) time points against target B/L CLL B cells after ex vivo treatment with glofitamab (0.01 μg/mL) or nonbinding antibody control (indicated as “−”) (B/L, n = 13; ibrutinib-rituximab 6M and 12M,n = 6; ibrutinib-rituximab 18M, n = 5; FCR 6M and 12M, n = 7; and FCR 18M, n = 5 patient samples). Data for all cytotoxicity assay timepoints were normalized to isotype antibody control for panels J-K or nonbinding antibody control for panels M-N treated sample levels and presented as fold change data for each immunotherapy treated patient sample. Wilcoxon signed-rank test for panels B,D-E,J-K,M-N, multiple comparisons mixed effect analysis of variance for panel F and Mann-Whitney U test for panel H. Mann-Whitney U test was used to compare cell death among CD20-TCB–treated conditions at B/L, 6M, 12M, and 18M. Original magnification ×63; scale bars, 10 μm. Bar chart data are presented as mean ± standard error of the mean. ∗P < .05; ∗∗P < .01; ∗∗∗P < .001; ∗∗∗∗P < .0001. CMAC, CellTracker Blue (7-amino-4-chloromethylcoumarin); TCB, T-cell bispecific antibody.

Comment in

References

    1. Shanafelt TD, Wang XV, Kay NE, et al. Ibrutinib-rituximab or chemoimmunotherapy for chronic lymphocytic leukemia. N Engl J Med. 2019;381(5):432–443. - PMC - PubMed
    1. Shanafelt TD, Wang XV, Hanson CA, et al. Long-term outcomes for ibrutinib-rituximab and chemoimmunotherapy in CLL: updated results of the E1912 Trial. Blood. 2022;140(2):112–120. - PMC - PubMed
    1. Skånland SS, Mato AR. Overcoming resistance to targeted therapies in chronic lymphocytic leukemia. Blood Adv. 2021;5(1):334–343. - PMC - PubMed
    1. Mhibik M, Wiestner A, Sun C. Harnessing the effects of BTKi on T cells for effective immunotherapy against CLL. Int J Mol Sci. 2019;21(1):68. - PMC - PubMed
    1. Ding W, LaPlant BR, Call TG, et al. Pembrolizumab in patients with CLL and Richter transformation or with relapsed CLL. Blood. 2017;129(26):3419–3427. - PMC - PubMed