. 2023 Nov:67:102922.
doi: 10.1016/j.redox.2023.102922. Epub 2023 Oct 4.

Tobacco toxins induce osteoporosis through ferroptosis

Affiliations

Tobacco toxins induce osteoporosis through ferroptosis

Zheng Jing et al. Redox Biol. 2023 Nov.

Abstract

Clinical epidemiological studies have confirmed that tobacco smoking disrupts bone homeostasis and is an independent risk factor for the development of osteoporosis. The low viability and inferior osteogenic differentiation of bone marrow mesenchymal stem cells (BMSCs) are important etiologies of osteoporosis. However, few basic studies have elucidated the specific mechanisms that tobacco toxins devastated BMSCs and consequently induced or exacerbated osteoporosis. Herein, our clinical data showed the bone mineral density (BMD) values of femoral neck in smokers were significantly lower than non-smokers, meanwhile cigarette smoke extract (CSE) exposure led to a significant decrease of BMD in rats and dysfunction of rat BMSCs (rBMSCs). Transcriptomic analysis and phenotype experiments suggested that the ferroptosis pathway was significantly activated in CSE-treated rBMSCs. Accumulated intracellular reactive oxygen species activated AMPK signaling, furtherly promoted NCOA4-mediated ferritin-selective autophagic processes, increased labial iron pool and lipid peroxidation deposition, and ultimately led to ferroptosis in rBMSCs. Importantly, in vivo utilization of ferroptosis and ferritinophagy inhibitors significantly alleviated BMD loss in CSE-exposed rats. Our study innovatively reveals the key mechanism of smoking-related osteoporosis, and provides a possible route targeting on the perspective of BMSC ferroptosis for future prevention and treatment of smoking-related bone homeostasis imbalance.

Keywords: Bone marrow mesenchymal stem cells; Cigarette smoke extract; Ferritinophagy; Ferroptosis; Osteoporosis.


Conflict of interest statement

Declaration of competing interest The authors declare that they have no competing financial interests.

Figures

Image 1
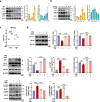
Graphical abstract
Fig. 1
Fig. 1
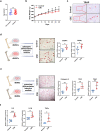
CSE exposure decreased bone mineral density in humansand rats. a. Schematic diagram illustrated the representative bone mineral density (BMD) test results (radiographs and T values of femoral neck) from a non-smoker and a smoker in clinical. b. Statistical analysis of T values of non-smokers (n = 19) and smokers (n = 42). c. Statistical and correlation analysis of human BMD and cigarette smoking habits. d. Schematic diagram illustrated the operation process in the CSE-exposed and the PBS-treated rats. e. Representative reconstruction images of Micro-CT of rat distal femurs and calculations of bone morphological parameters in the regions of interest (ROI) (n = 5), scale bar:1.0 mm. f. HE staining and Col-1 IHC staining of rat distal femurs in the Control group and the CSE-exposed group, and the calculation of relative average optical density (AOD) of Col-1 (n = 5). B: bone trabecula, red arrow indicated the positive expression area for IHC staining. g. Rat femur paraffin sections subjected to TUNEL showed dead cells and statistical analysis of TUNEL positive cells (n = 5), scale bar:100 μm. h. Alizarin red staining of rBMSCs originated from rats in the Control group and the CSE-exposed group after osteogenic differentiation induction for 14 days, OM: osteogenic differentiation induction medium, scale bar: 400 μm. qPCR analysis of osteogenesis-related genes (Runx2, Osx and Col-1) of rBMSCs originated from rats in the Control group and the CSE-exposed group after osteogenic differentiation induction for 7 days (n = 5). *P < 0.05, **P < 0.01, ***P < 0.001 versus control. (For interpretation of the references to color in this figure legend, the reader is referred to the Web version of this article.)
Fig. 2
Fig. 2
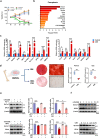
Transcriptomic analysis and phenotype verifications revealed CSE induced ferroptosis in rBMSCs in vitro. a. Schematic illustration of the experimental design and sample preparation for transcriptomic analysis. b. Heatmap showed differentially expressed genes (DEGs) between rBMSCs from the Control and the CSE group (n = 3 in each group). Red: up-regulated expression levels. Blue: down-regulated expression levels. c. Volcano map showed the DEGs. d. KEGG analysis of the DEGs was carried out, and Top 20 of the pathways with significant enrichment were shown. e. GO Chord plot according to GO enrichment analysis displayed the relationship between the significant upregulated terms and genes, including “lipid metabolic process”, “glutathione metabolic”, “iron ion transport”, “cellular iron ion homeostasis”, “response to oxidative stress”, “autophagy”, and downregulated terms including “osteoblast differentiation”, “chondrocyte differentiation”, “positive regulation of bone mineralization”. f-g. Representative microscopy images and calculation of FITC/texas-red ratio of lipid peroxidation assay in rBMSCs following PBS or 4.5 % CSE treatment for 12h combined with Fer-1 (2 μM) or DFO (1 μM) (n = 3), scale bar:100 μm. h-j. Cell viability was assessed by CCK-8 assay and cell death was evaluated by cytotoxicity using LDH assay of rBMSCs with PBS or 4.5 % CSE treatment for 12h combined with Fer-1 (2 μM), DFO (1 μM), Nec-1 (10 μM) or Z-VAD-FMK (20 μM). Relative GSH levels of rBMSCs (k), Mean fluorescence intensity (MFI) analysis of PGSK-labeled rBMSCs (l), LIP concentration of rBMSCs (m), WB showing expression level of Slc7a11 and GPx4 of rBMSCs (n) with PBS or 4.5 % CSE treatment for 12h combined with Fer-1 (2 μM) or DFO (1 μM) (n = 3). *P < 0.05, **P < 0.01, ***P < 0.001 versus control. (For interpretation of the references to color in this figure legend, the reader is referred to the Web version of this article.)
Fig. 3
Fig. 3
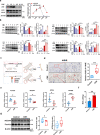
Autophagy was activated by CSE and was required for CSE-induced rBMSCs death.a. GSEA analysis showed significant difference in “autophagosome” and “secondary lysosomes” by GOCC enrichment in the CSE-treated rBMSCs compared to the Control group. b. Representative TEM images of autophagic vacuole in rBMSCs following 4.5 % CSE treatment for 3h. Yellow arrows indicated autophagic vacuole. c. WB showing expression level of LC3-II/I and p62 in rBMSCs treated with 4.5 % CSE for 0,1,3,6,9,12h (n = 3). d. WB showing expression level of LC3-II/I and p62 in rBMSCs following 4.5 % CSE treatment for 3h and 6h combined with 3-MA (20 μM), BafA1(100 nM), CQ (10 μM) and RAPA (50 nM). E. Fluorescence confocal images of mRFP-GFP-LC3 adenovirus-transfected rBMSCs treated with 4.5 % CSE. Red signal indicated autophagolysosome, green signal indicated autophagosome, and yellow signal indicated red and green superposition. Scale bar = 10 μm. Statistical graph of LC3 puncta per cell were calculated in indicated groups, n = 6. f. CCK-8 assay of rBMSCs treated with 4.5 % CSE for 6h combined with 3-MA (20 μM), BafA1(100 nM), CQ (10 μM) and RAPA (50 nM) (n = 3). g. WB showing expression level of LC3-II/I and p62 of rat distal femurs in the Control group and the CSE-exposed group (n = 5). *P < 0.05, **P < 0.01, ***P < 0.001 versus control. (For interpretation of the references to color in this figure legend, the reader is referred to the Web version of this article.)
Fig. 4
Fig. 4
Ferritinophagy was involved in CSE-induced cell death. a. WB showing expression level of Ferritin and NCOA4 in rBMSCs treated with 4.5 % CSE for 0,1,3,6,9,12h (n = 3). b. WB showing expression level of Ferritin and NCOA4 in rBMSCs following 4.5 % CSE treatment for 3h and 6h combined with 3-MA (20 μM), BafA1(100 nM), CQ (10 μM) and RAPA (50 nM). c. Co-immunoprecipitation of Ferritin-NCOA4 formation in rBMSCs treated with 4.5 % CSE for 1h (n = 3). d. Immunofluorescence colocalization of Ferritin and LC3 in rBMSCs treated with 4.5 % CSE for 6 h combined with CQ (10 μM). Green signal indicated Ferritin, red signal indicated LC3, Nuclei were counterstained with DAPI (blue signal), yellow signal indicated colocalization region of green and red, scale bar:25 μm. e. WB showing expression level of Ferritin and NCOA4 in rBMSCs after 4.5 % CSE treatment for 12h following NCOA4 knockdown (n = 3). f. WB showing expression level of Ferritin and ATG5 in rBMSCs after 4.5 % CSE treatment for 12h following ATG5 knockdown (n = 3). g. CCK-8 assay and C11-BODIPY 581/591 analysis of rBMSCs after 4.5 % CSE treatment for 12h following NCOA4 knockdown (n = 3). h. CCK-8 assay and C11-BODIPY 581/591 analysis of rBMSCs after 4.5 % CSE treatment for 12h following ATG5 knockdown. i. Schematic diagram illustrated the activated process of Ferritinophagy in rBMSCs treated with CSE, which was blocked by NCOA4/ATG5 knockdown and autophagy inhibitors. *P < 0.05, **P < 0.01, ***P < 0.001 versus control. (For interpretation of the references to color in this figure legend, the reader is referred to the Web version of this article.)
Fig. 5
Fig. 5
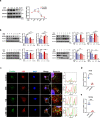
ROS and mitochondrial damage activated AMPK and furtherly promoted CSE-induced ferritinophagy in rBMSCs a. GSEA analysis presented gene expression in mTOR signaling pathway. b. WB showing expression level of p-mTOR, mTOR, p-ULK1, ULK1, p-AMPK and AMPK in rBMSCs treated with 4.5 % CSE for 0, 15, 30, 45 and 60 min. c. WB showing expression level of Ferritin, NCOA4, LC3-II/I and p62 in rBMSCs treated with 4.5 % CSE for 0,15,30,45 and 60 min. d. WB showing expression level of TFRC in rBMSCs treated with 4.5 % CSE for 0,15,30,45 and 60 min and with 0,1.5,3,4.5,6 % CSE for 1h. e. Representative microscopy images of DCFH-DA staining in rBMSCs treated with 4.5 % CSE for 1h, scale bar: 100 μm. f. WB showing expression level of AMPK, Ferritin and LC3-II/I in rBMSCs after 4.5 % CSE treatment for 12h following AMPK knockdown. g. CCK-8 assay and C11-BODIPY 581/591 analysis of rBMSCs after 4.5 % CSE treatment for 12h following AMPK knockdown. h. WB showing expression level of p-ULK1, ULK1, p-AMPK and AMPK in rBMSCs treated with 4.5 % CSE for 0,1,3,6,9,12h. i. Representative TEM images of mitochondria in rBMSC treated with 4.5 % CSE for 3h. Yellow arrows showed swollen mitochondria with severely disrupted cristae. j. Representative fluorescence confocal images of mROS with MitoSox dye in rBMSCs treated with 4.5 % CSE for 3h. Scale bar = 25 μm. k. Flow cytometry of mitochondrial membrane potential labeled by TMRE in rBMSCs treated with 4.5 % CSE for 3h and 12h (n = 3). l. ATP production detection of rBMSCs following 4.5 % CSE treatment for 3h and 12h (n = 3). m. CCK-8 assay (m) and C11-BODIPY 581/591 analysis (n) of rBMSCs treated with 4.5 % CSE for 12h combined with NAC (2 mM) or MitoQ (5 μM) (n = 3). o. Statistical analysis of mean fluorescence intensity (MFI) of TMRE-labeled rBMSCs following 4.5 % CSE treatment for 12h combined with NAC (2 mM) (n = 3) p. WB showing expression level of Slc7a11, GPx4, p62, LC3-II/I, Ferritin, p-AMPK, AMPK, p-ULK1 and ULK1 in rBMSCs treated with 4.5 % CSE combined with NAC (2 mM). q. Schematic diagram illustrated exogenous ROS and iron in CSE firstly induce AMPK-regulated autophagic dependent Fenton reaction, which attacked mitochondria furtherly boost endogenous ROS and aggravated ferroptotic death. *P < 0.05, **P < 0.01, ***P < 0.001 versus control. (For interpretation of the references to color in this figure legend, the reader is referred to the Web version of this article.)
Fig. 6
Fig. 6
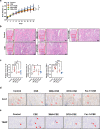
Ferritinophagy and ferroptosis inhibition ameliorated SROP in rats. a. Schematic diagram illustrated the operation process in the CSE-exposed rats, combined with 3-MA, DFO, and Fer-1 treatment. PBS-treated rats were used as the Control group. b. Three-dimensional reconstruction images of Micro-CT images of rat distal femurs, scale bar:1.0 mm. c. Calculations of bone morphological parameters in the ROI (n = 5). d. 4-HNE IHC staining of rat distal femurs in the Control, CSE, CSE+3-MA, CSE + DFO and CSE + Fer-1 group and statistical analysis of relative AOD of 4-HNE (positive areas were indicated with red arrow) (n = 5), scale bar: 100 μm (round) and 20 μm (square). MDA content assay (e), qPCR analysis of ferroptosis-related genes (Ferritin, NCOA4, GPx4 and PTGS2) (f), WB showing expression level of ferroptosis-related proteins (Ferritin and NCOA4) (g) of rat distal femurs in the Control, CSE, CSE+3-MA, CSE + DFO and CSE + Fer-1 group (n = 5). *P < 0.05, **P < 0.01, ***P < 0.001 versus control. (For interpretation of the references to color in this figure legend, the reader is referred to the Web version of this article.)
figs1
figs1
figs2
figs2
figs3
figs3
figs4
figs4
figs5
figs5
figs6
figs6
figs7
figs7

References

    1. Hollenbach K.A., et al. Cigarette smoking and bone mineral density in older men and women. Am. J. Publ. Health. 1993;83:1265–1270. doi: 10.2105/ajph.83.9.1265. - DOI - PMC - PubMed
    1. Egger P., et al. Cigarette smoking and bone mineral density in the elderly. J. Epidemiol. Community Health. 1996;50:47–50. doi: 10.1136/jech.50.1.47. - DOI - PMC - PubMed
    1. Kanis J.A., et al. Smoking and fracture risk: a meta-analysis. Osteoporos. Int. 2005;16:155–162. doi: 10.1007/s00198-004-1640-3. - DOI - PubMed
    1. World Health Organization . WHO; 2022. Tobacco.https://www.who.int/news-room/fact-sheets/detail/tobacco
    1. Saunders G.R.B., et al. Genetic diversity fuels gene discovery for tobacco and alcohol use. Nature. 2022;612:1476–4687. doi: 10.1038/s41586-022-05477-4. - DOI - PMC - PubMed

Publication types