. 2023 Dec;387(3):315-327.
doi: 10.1124/jpet.123.001826. Epub 2023 Oct 12.

Central Nervous System Distribution of Panobinostat in Preclinical Models to Guide Dosing for Pediatric Brain Tumors

Affiliations

Central Nervous System Distribution of Panobinostat in Preclinical Models to Guide Dosing for Pediatric Brain Tumors

Wenqiu Zhang et al. J Pharmacol Exp Ther. 2023 Dec.

Abstract

Achieving adequate exposure of the free therapeutic agent at the target is a critical determinant of efficacious chemotherapy. With this in mind, a major challenge in developing therapies for central nervous system (CNS) tumors is to overcome barriers to delivery, including the blood-brain barrier (BBB). Panobinostat is a nonselective pan-histone deacetylase inhibitor that is being tested in preclinical and clinical studies, including for the treatment of pediatric medulloblastoma, which has a propensity for leptomeningeal spread and diffuse midline glioma, which can infiltrate into supratentorial brain regions. In this study, we examined the rate, extent, and spatial heterogeneity of panobinostat CNS distribution in mice. Transporter-deficient mouse studies show that panobinostat is a dual substrate of P-glycoprotein (P-gp) and breast cancer resistant protein (Bcrp), which are major efflux transporters expressed at the BBB. The CNS delivery of panobinostat was moderately limited by P-gp and Bcrp, and the unbound tissue-to-plasma partition coefficient of panobinostat was 0.32 and 0.21 in the brain and spinal cord in wild-type mice. In addition, following intravenous administration, panobinostat demonstrated heterogeneous distribution among brain regions, indicating that its efficacy would be influenced by tumor location or the presence and extent of leptomeningeal spread. Simulation using a compartmental BBB model suggests inadequate exposure of free panobinostat in the brain following a recommended oral dosing regimen in patients. Therefore, alternative approaches to CNS delivery may be necessary to have adequate exposure of free panobinostat for the treatment of a broad range of pediatric brain tumors. SIGNIFICANCE STATEMENT: This study shows that the central nervous system (CNS) penetration of panobinostat is limited by P-gp and Bcrp, and its efficacy may be limited by inadequate distribution to the tumor. Panobinostat has heterogeneous distribution into various brain regions, indicating that its efficacy might depend on the anatomical location of the tumors. These distributional parameters in the mouse CNS can inform both preclinical and clinical trial study design and may guide treatment for these devastating brain tumors in children.


Figures

Fig. 1.
Fig. 1.
(A) Mechanisms of action of HDAC inhibitors and (B) CNS delivery of panobinostat following systemic administration and the blood-brain barrier limiting its CNS penetration. Figure created with BioRender.com.
Fig. 2.
Fig. 2.
Concentration-time profiles of panobinostat in the (A) plasma, (B) brain, and (C) spinal cord following a 10 mg/kg intravenous bolus dose in Friend leukemia virus strain B (FVB) wild-type, PKO (Mdr1a/b−/−), BKO (Bcrp1−/−), and TKO (Mdr1a/b−/−Bcrp1−/−) mice (n = 4, mean ± S.D.). WT, wild type.
Fig. 3.
Fig. 3.
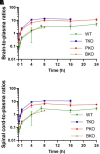
Panobinostat (A) brain-to-plasma and (B) spinal cord-to-plasma concentration ratio-time profiles following a 10 mg/kg intravenous bolus dose in Friend leukemia virus strain B (FVB) wild-type, PKO (Mdr1a/b−/−), BKO (Bcrp1−/−), and TKO (Mdr1a/b−/−Bcrp1−/−) mice (n = 4, mean ± S.D.). WT, wild type.
Fig. 4.
Fig. 4.
Panobinostat (A) total concentrations and (B) free concentrations in CNS tissues compared with the reported minimum IC50 (n = 4, mean ± S.D.). The dash lines represent the expected minimum (A) total and (B) free IC50. The minimum free IC50 was converted from total IC50 using the average unbound fraction measured in media.
Fig. 5.
Fig. 5.
Spatial distribution of panobinostat into brain regions at (A) 30 minutes, (B) 2 hours, and (C) 4 hours following a 10 mg/kg intravenous dose in Friend leukemia virus strain B (FVB) wild-type mice (n = 4, mean ± S.D., except that the medulla regions were pooled from four mice). The dash lines represent the expected minimum total IC50. *P ≤ 0.05; **P ≤ 0.01; ***P 0.001; ****P ≤ 0.0001. Statistical analysis performed by one-way ANOVA followed by Tukey test. The heatmaps show the average total panobinostat delivery to each brain region.
Fig. 6.
Fig. 6.
Spatial distribution of panobinostat into spinal cord regions at (A) 30 minutes, (B) 2 hours, and (C) 4 hours following a 10 mg/kg intravenous dose in Friend leukemia virus strain B (FVB) wild-type mice (n = 4, mean ± S.D., except that the cervical regions were pooled from four mice and excluded from the statistical test). The dash lines represent the expected minimum total IC50. Statistical analysis performed by two-tailed t test. No statistically significant difference observed. The heatmaps show the average total panobinostat delivery to each spinal cord region.
Fig. 7.
Fig. 7.
Spatial distribution of unbound panobinostat into brain regions at (A) 30 minutes, (B) 2 hours, and (C) 4 hours following a 10 mg/kg intravenous dose in Friend leukemia virus strain B (FVB) wild-type mice (n = 4, mean ± S.D., except that the medulla regions were pooled from four mice). The dash lines represent the expected minimum free IC50. *P ≤ 0.05; **P ≤ 0.01; ***P ≤ 0.001; ****P ≤ 0.0001. Statistical analysis performed by one-way ANOVA followed by Tukey test.
Fig. 8.
Fig. 8.
Spatial distribution of unbound panobinostat into spinal cord regions at (A) 30 minutes, (B) 2 hours, and (C) 4 hours following a 10 mg/kg intravenous dose in Friend leukemia virus strain B (FVB) wild-type mice (n = 4, mean ± S.D., except that the cervical regions were pooled from four mice and excluded from the statistical test). The dash lines represent the expected minimum free IC50. Statistical analysis performed by two-tailed t test. No statistically significant difference observed.
Fig. 9.
Fig. 9.
(A) A schematic of the pharmacokinetic model used to simulate the unbound panobinostat brain concentration. (B) Simulated plasma and brain total concentrations for multiple 20 mg oral doses in a 21-day cycle of treatment in humans. (C) Simulated plasma and brain unbound concentrations for multiple 20 mg oral doses in a 21-day cycle of treatment in patients. The dash lines represent the expected minimum (B) total and (C) free IC50.

References

    1. Agarwal S, Sane R, Gallardo JL, Ohlfest JR, Elmquist WF (2010) Distribution of gefitinib to the brain is limited by P-glycoprotein (ABCB1) and breast cancer resistance protein (ABCG2)-mediated active efflux. J Pharmacol Exp Ther 334:147–155. - PMC - PubMed
    1. Arvanitis CD, Ferraro GB, Jain RK (2020) The blood-brain barrier and blood-tumour barrier in brain tumours and metastases. Nat Rev Cancer 20:26–41. - PMC - PubMed
    1. Atadja P (2009) Development of the pan-DAC inhibitor panobinostat (LBH589): successes and challenges. Cancer Lett 280:233–241. - PubMed
    1. Bailer AJ (1988) Testing for the equality of area under the curves when using destructive measurement techniques. J Pharmacokinet Biopharm 16:303–309. - PubMed
    1. Buckner JC, Brown PD, O’Neill BP, Meyer FB, Wetmore CJ, Uhm JH (2007) Central nervous system tumors. Mayo Clin Proc 82:1271–1286. - PubMed

Publication types

MeSH terms

Substances

LinkOut - more resources