

Association of Blood-Based DNA Methylation Markers With Late-Onset Alzheimer Disease: A Potential Diagnostic Approach
- PMID: 37827850
- PMCID: PMC10752644
- DOI: 10.1212/WNL.0000000000207865
Association of Blood-Based DNA Methylation Markers With Late-Onset Alzheimer Disease: A Potential Diagnostic Approach
Erratum in
-
Corrections to Preprint Server Information.Neurology. 2024 Jul 9;103(1):e209573. doi: 10.1212/WNL.0000000000209573. Epub 2024 Jun 3. Neurology. 2024. PMID: 38830142 Free PMC article. No abstract available.
-
Corrections to Received Date Information.Neurology. 2024 Jul 9;103(1):e209596. doi: 10.1212/WNL.0000000000209596. Epub 2024 Jun 3. Neurology. 2024. PMID: 38830175 Free PMC article. No abstract available.
Abstract
Background and objectives: There is an urgent need to identify novel noninvasive biomarkers for Alzheimer disease (AD) diagnosis. Recent advances in blood-based measurements of phosphorylated tau (pTau) species are promising but still insufficient to address clinical needs. Epigenetics has been shown to be helpful to better understand AD pathogenesis. Epigenetic biomarkers have been successfully implemented in other medical disciplines, such as oncology. The objective of this study was to explore the diagnostic accuracy of a blood-based DNA methylation marker panel as a noninvasive tool to identify patients with late-onset Alzheimer compared with age-matched controls.
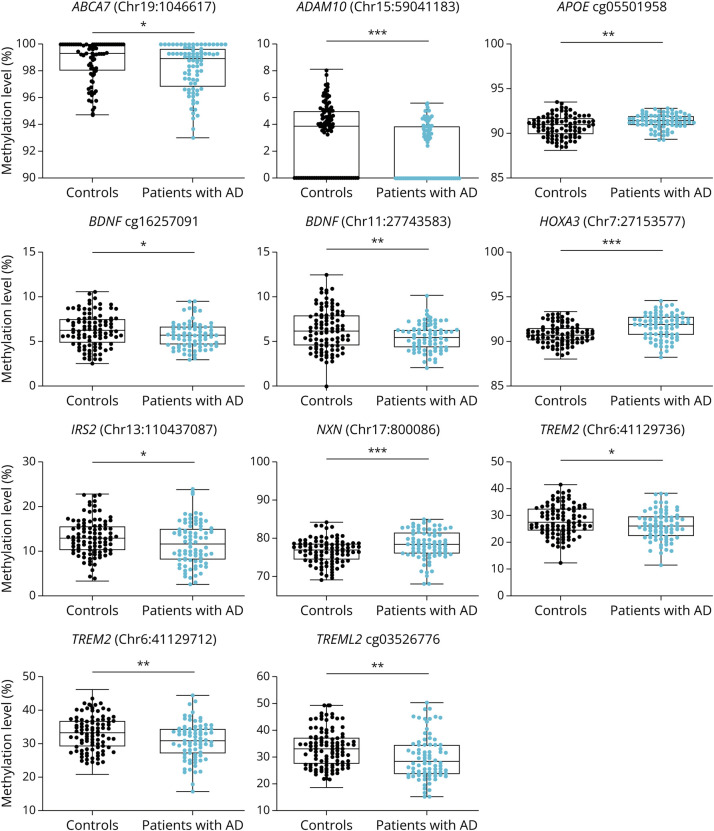
Methods: A case-control study was performed. Blood DNA methylation levels at 46 cytosine-guanine sites (21 genes selected after a comprehensive literature search) were measured by bisulfite pyrosequencing in patients with "probable AD dementia" following National Institute on Aging and the Alzheimer's Association guidelines (2011) and age-matched and sex-matched controls recruited at Neurology Department-University Hospital of Navarre, Spain, selected by convenience sampling. Plasma pTau181 levels were determined by Simoa technology. Multivariable logistic regression analysis was performed to explore the optimal model to discriminate patients with AD from controls. Furthermore, we performed a stratified analysis by sex.
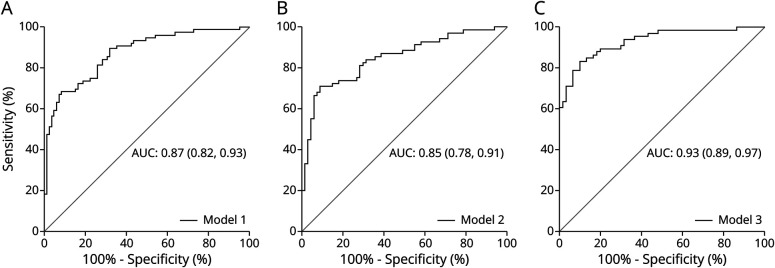
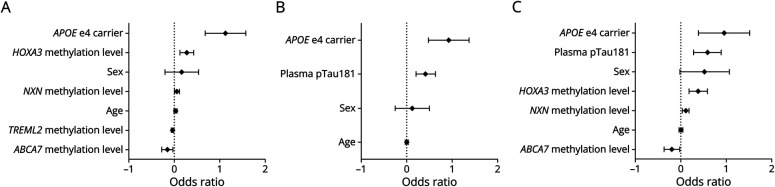
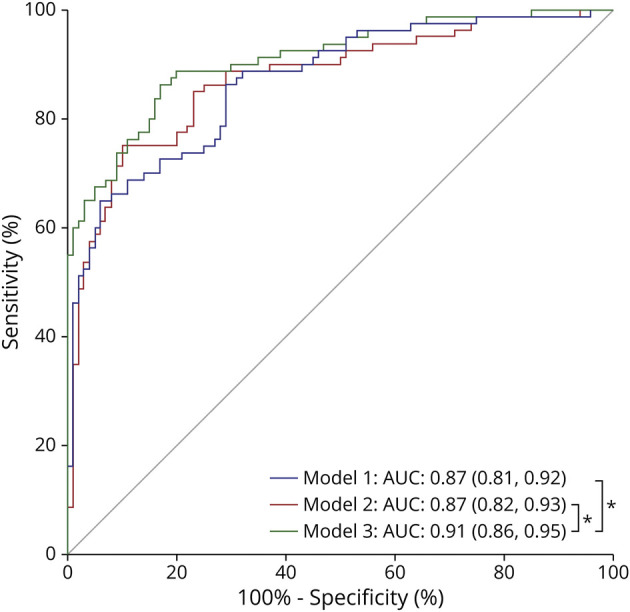
Results: The final study cohort consisted of 80 patients with AD (age: median [interquartile range] 79 [11] years; 58.8% female) and 100 cognitively healthy controls (age 77 [10] years; 58% female). A panel including DNA methylation levels at NXN, ABCA7, and HOXA3 genes and plasma pTau181 significantly improved (area under the receiver operating characteristic curve 0.93, 95% CI 0.89-0.97) the diagnostic performance of a single pTau181-based model, adjusted for age, sex, and APOE ɛ4 genotype. The sensitivity and specificity of this panel were 83.30% and 90.00%, respectively. After sex-stratified analysis, HOXA3 DNA methylation levels showed consistent association with AD.
Discussion: These results highlight the potential translational value of blood-based DNA methylation biomarkers for noninvasive diagnosis of AD.
Registration information: Research Ethics Committee of the University Hospital of Navarre (PI17/02218).
Copyright © 2023 The Author(s). Published by Wolters Kluwer Health, Inc. on behalf of the American Academy of Neurology.
Conflict of interest statement
B. Acha is supported by a PFIS fellowship from the Spanish Government (FI18/00150). M. Macías is beneficiary of a grant Río Hortega from the Spanish Government (CM20/00240). A. Urdánoz-Casado received a grant Doctorandos industriales 20182020 and a Predoctoral grant (2019) founded by the Department of Industry and Health of the Government of Navarra. D. Alcolea participated in advisory boards from Fujirebio-Europe and Roche Diagnostics and received speaker honoraria from Fujirebio-Europe, Roche Diagnostics, Nutricia, Krka Farmacéutica S.L., Zambon S.A.U. and Esteve Pharmaceuticals S.A. D. Alcolea declares a filed patent application (WO2019175379 A1 Markers of synaptopathy in neurodegenerative disease). A. Lleo has served at scientific advisory boards from Fujirebio-Europe, Nutricia, Biogen, Roche, and Grifols, and has filed a patent application of synaptic markers in neurodegenerative diseases. M. Mendioroz received a grant (LCF/PR/PR15/51100006) founded by Fundación Bancaria la Caixa and Fundación Caja-Navarra, and Contrato de intensificación from the Institute of Health Carlos III (INT19/00029). All other authors report no disclosures relevant to the manuscript. Go to
Figures
References
-
- McKhann GM, Knopman DS, Chertkow H, et al. The diagnosis of dementia due to Alzheimer's disease: recommendations from the National Institute on Aging-Alzheimer's Association workgroups on diagnostic guidelines for Alzheimer's disease. Alzheimers Dement. 2011;7(3):263-269. doi: 10.1016/j.jalz.2011.03.005 - DOI - PMC - PubMed
Publication types
MeSH terms
Substances
LinkOut - more resources
Full Text Sources
Medical
Miscellaneous