. 2023 Oct 12;14(1):6233.
doi: 10.1038/s41467-023-41910-6.

Genomic adaptation of giant viruses in polar oceans

Affiliations

Genomic adaptation of giant viruses in polar oceans

Lingjie Meng et al. Nat Commun. .

Abstract

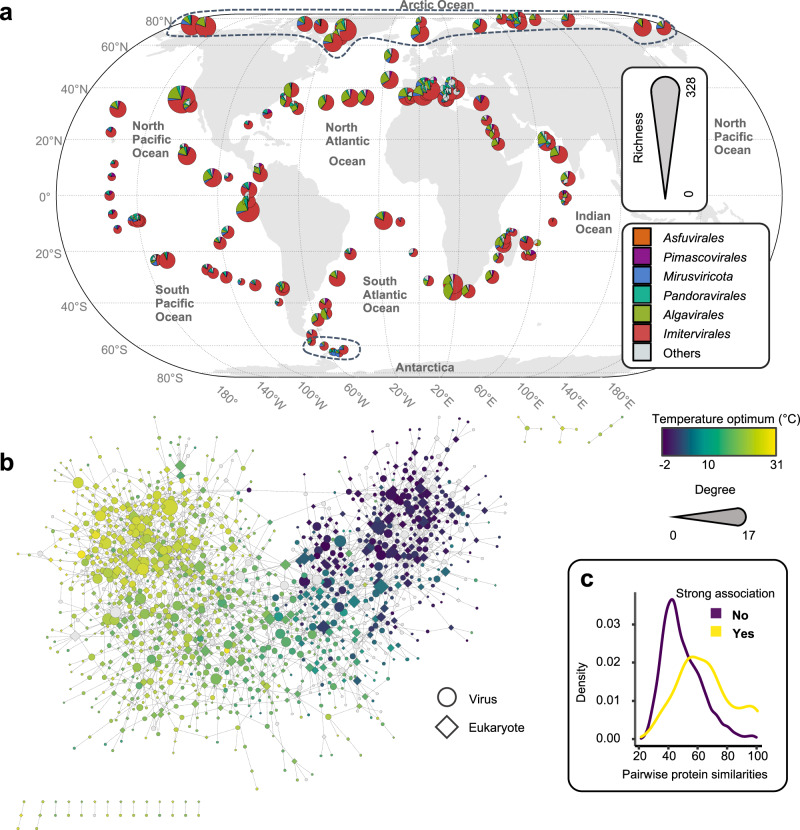
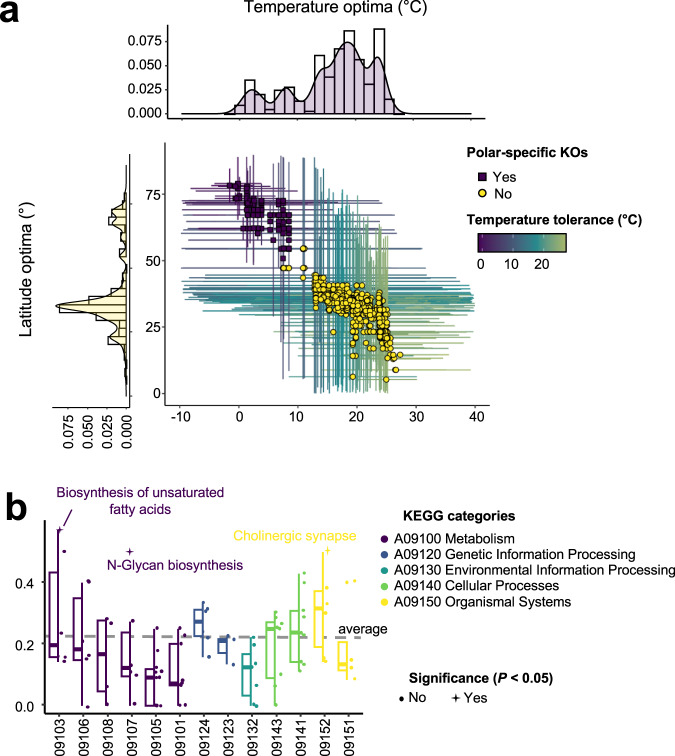
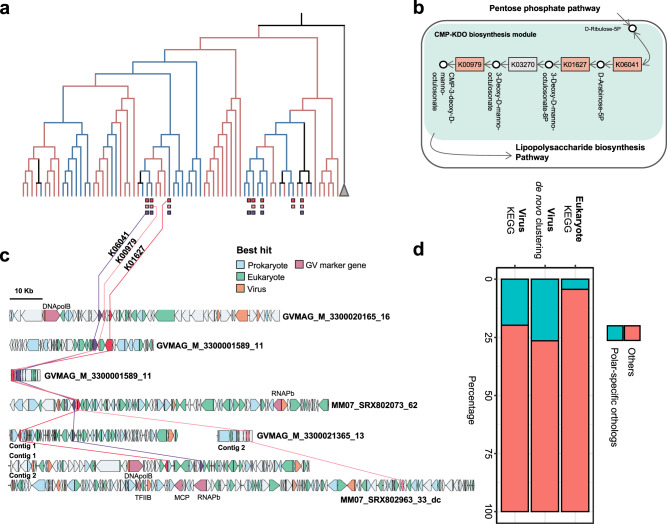
Despite being perennially frigid, polar oceans form an ecosystem hosting high and unique biodiversity. Various organisms show different adaptive strategies in this habitat, but how viruses adapt to this environment is largely unknown. Viruses of phyla Nucleocytoviricota and Mirusviricota are groups of eukaryote-infecting large and giant DNA viruses with genomes encoding a variety of functions. Here, by leveraging the Global Ocean Eukaryotic Viral database, we investigate the biogeography and functional repertoire of these viruses at a global scale. We first confirm the existence of an ecological barrier that clearly separates polar and nonpolar viral communities, and then demonstrate that temperature drives dramatic changes in the virus-host network at the polar-nonpolar boundary. Ancestral niche reconstruction suggests that adaptation of these viruses to polar conditions has occurred repeatedly over the course of evolution, with polar-adapted viruses in the modern ocean being scattered across their phylogeny. Numerous viral genes are specifically associated with polar adaptation, although most of their homologues are not identified as polar-adaptive genes in eukaryotes. These results suggest that giant viruses adapt to cold environments by changing their functional repertoire, and this viral evolutionary strategy is distinct from the polar adaptation strategy of their hosts.


Conflict of interest statement

The authors declare no competing interests.

Figures

Fig. 1
Fig. 1. A global virus–plankton interaction network shaped by latitude and temperature.
a Richness of viral communities at the stations of the Tara Oceans expedition (2009–2013). A total of 928 epipelagic metagenomes from 143 Tara Oceans stations are included in this study. Each pie chart represents the contributions to richness by six taxonomic main groups, and the size of the pie chart is proportional to the total richness at the station. The richness of two depths (Surface and Deep Chlorophyll Maximum) and different size fractions (Pico, Piconano, Nano, Micro, Macro, and Broad) are integrated into one pie chart. Dashed lines indicate the boundary of Polar samples. b A virus–plankton interaction network. Five individual networks inferred using input matrices for the relative frequencies of eukaryotes (five size fractions) and giant viruses (Pico-size fraction). The best positive or negative association (i.e., the edges with the highest absolute weights between two genomes) were selected to build the integrated interactome. Node color represents the temperature optima of each genome for viruses and eukaryotes. A total of 1347 nodes (567 eukaryotes and 780 viruses) are in the network. Of these nodes, 1191 nodes (554 eukaryotes and 637 viruses) are colored according to their temperature optima. c The distribution of pairwise sequence similarity of proteins (one protein from the eukaryotic genome and one from the viral genome). Blue line indicates the distribution for pairs with a strong virus–eukaryote association in the interactome (edge weight of ≥0.4), while the red line is for pairs lacking a strong association. The two distributions are significantly different (P = 1 × 10−13, two-sided Wilcoxon signed-rank test). Source data are provided as a Source Data file.
Fig. 2
Fig. 2. Inferred ancestral polar and nonpolar niches for viruses.
a Ancestral “Polar” and “Nonpolar” states were estimated using the phylogenetic tree based on a one-parameter equal rates model. The outermost layer shows the taxonomy of six main groups. The boxplots in the second layer show the temperature optima of the viral genomes. For each box, n = 10,000 temperature values were analyzed as outlined in the methodology section on robust ecological optimum and tolerance. Only polar and nonpolar genomes were included in the tree. b The treemap diagram shows the number of viruses assigned to Polar, Nonpolar or “Unknown” biomes. Colors indicate the main taxonomic groups. c Relative Evolutionary Divergence (RED) values for viral main groups (n = 6) and families. N stands for the phylum Nucleocytoviricota (n = 17) and M stands for Mirusviricota (n = 5). d Histograms of RED values for the nodes at which “polar” or “nonpolar” adaptation events were inferred. RED values of child nodes in adaptation events were shown. For box plots, center lines show the medians; box bounds stand for the 25th and 75th percentiles; whiskers extend 1.5 times the interquartile range from the 25th and 75th percentiles; outliers are represented by dots. Source data are provided as a Source Data file.
Fig. 3
Fig. 3. Ecological niche of KEGG Orthologs (KOs) and polar-enriched pathways.
a Distribution of the temperature optima and latitude optima for KEGG Orthologs (KOs) found in viral genomes. Colors of dots represent the Polar or Nonpolar niche for each KO. Bars indicate the tolerance ranges of temperature (horizontal) and latitude (vertical). Histograms show the distributions of temperature and latitude optima. b A boxplot with jitter of ratio of Polar KOs in each pathway. Totally, n = 84 pathways were examined. Stars and labels correspond to pathways in which Polar KOs were significantly enriched (P < 0.05, one-sided Fisher’s exact test) while circles stand for the non-significant pathways. P values of Biosynthesis of unsaturated fatty acids, N-Glycan biosynthesis, Cholinergic synapse are 0.03, 0.02, 0.04, respectively. Colors indicate the top categories of pathways in the KEGG database. For box plots, center lines show the medians; box bounds stand for the 25th and 75th percentiles; whiskers extend 1.5 times the interquartile range from the 25th and 75th percentiles. The overall ratio of Polar KOs to all KOs is indicated by a dotted line. The x axis shows the second-level categories: Lipid metabolism (09103); Metabolism of other amino acids (09106); Metabolism of cofactors and vitamins (09108); Glycan biosynthesis and metabolism (09107); Amino acid metabolism (09105); Carbohydrate metabolism (09101); Replication and repair (09124); Folding, sorting and degradation (09123); Signal transduction (09132); Cell growth and death (09143); Transport and catabolism (09141); Endocrine system (09152); Immune system (09151). Source data are provided as a Source Data file.
Fig. 4
Fig. 4. Independent genomic adaptation of giant viruses.
244 functions (KOs) were enriched at individual lineages. One example was given in (a), Three KOs that were present exclusively in more than five Polar genomes in a selected Mesomimiviridae clade. Three of them (K01627, K00979, K06041) were encoded in the same genomes and formed a near-complete CMP−KDO biosynthesis module shown in (b), Schematic of the three Polar enzymatic steps in the CMP–KDO biosynthesis module. c Genome maps of MAGs encoding three CMP-KDO KOs. Best matched taxonomies of genes are shown using the same colors, with the key provided at the top right. Colored lines connect detected CMP-KDO KOs between every two contigs. “contig1” and “contig2” indicate two contigs come from the same MAG. d Proportion of Polar and Nonpolar specific functions (KOs and GCCs) in viruses and eukaryotes.

References

    1. Alfredo J, Castruita S, Westbury MV. Analyses of key genes involved in Arctic adaptation in polar bears suggest selection on both standing variation and de novo mutations played an important role. BMC Genom. 2020;21:543. - PMC - PubMed
    1. DeVries AL, Cheng CHC. Antifreeze proteins and organismal freezing avoidance in polar fishes. Fish. Physiol. 2005;22:155–201.
    1. Kim BM, et al. Antarctic blackfin icefish genome reveals adaptations to extreme environments. Nat. Ecol. Evol. 2019;3:469–478. - PMC - PubMed
    1. Methé BA, et al. The psychrophilic lifestyle as revealed by the genome sequence of Colwellia psychrerythraea 34H through genomic and proteomic analyses. Proc. Natl Acad. Sci. USA. 2005;102:10913–10918. - PMC - PubMed
    1. Hassan N, et al. Temperature driven membrane lipid adaptation in glacial psychrophilic bacteria. Front Microbiol. 2020;11:1–10. - PMC - PubMed

Publication types