. 2023 Oct 12;14(1):6422.
doi: 10.1038/s41467-023-42156-y.

Oncogenic context shapes the fitness landscape of tumor suppression

Affiliations

Oncogenic context shapes the fitness landscape of tumor suppression

Lily M Blair et al. Nat Commun. .

Abstract

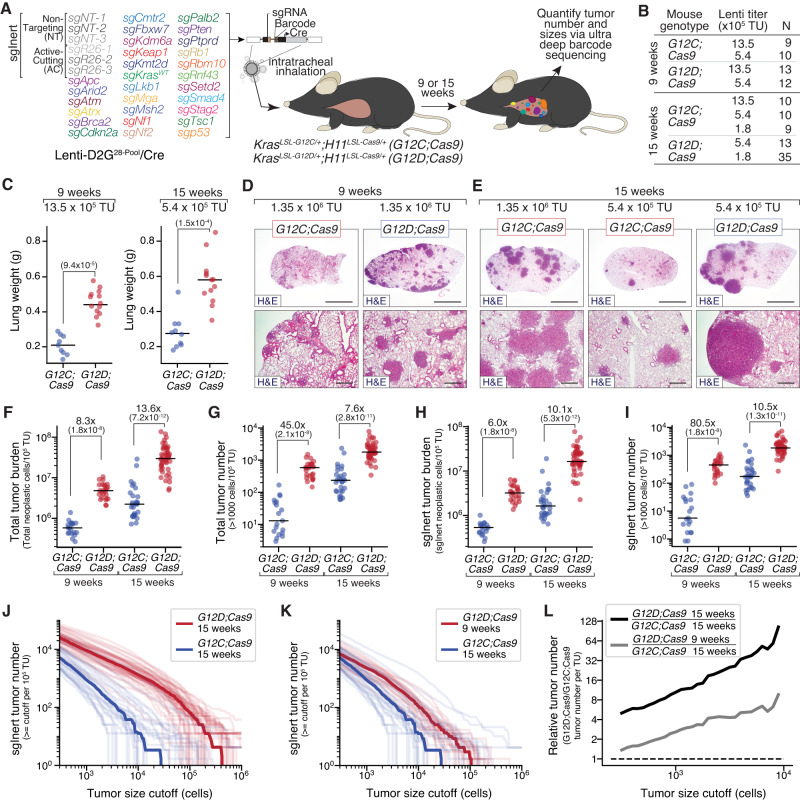
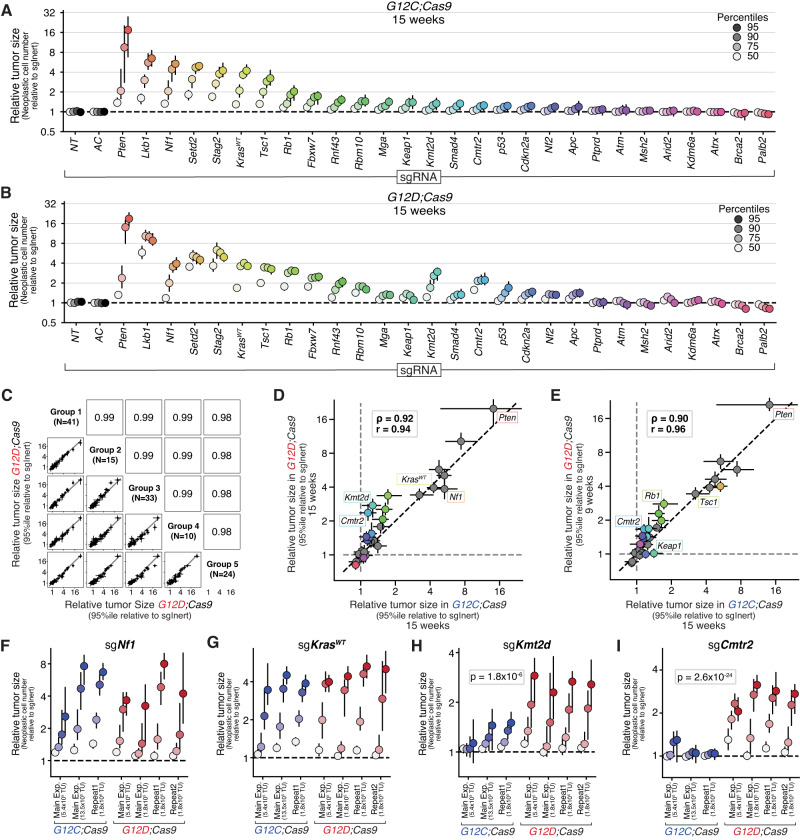
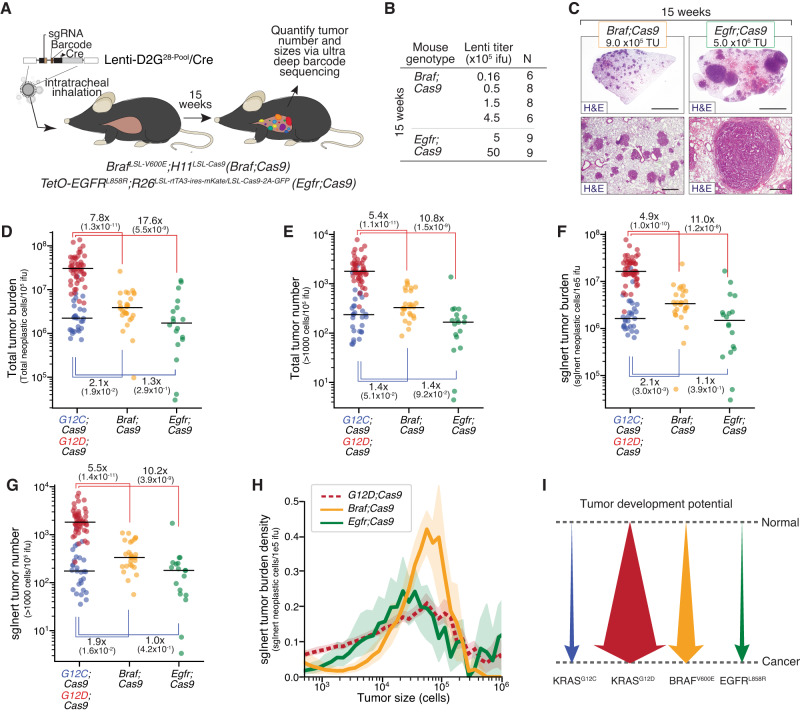
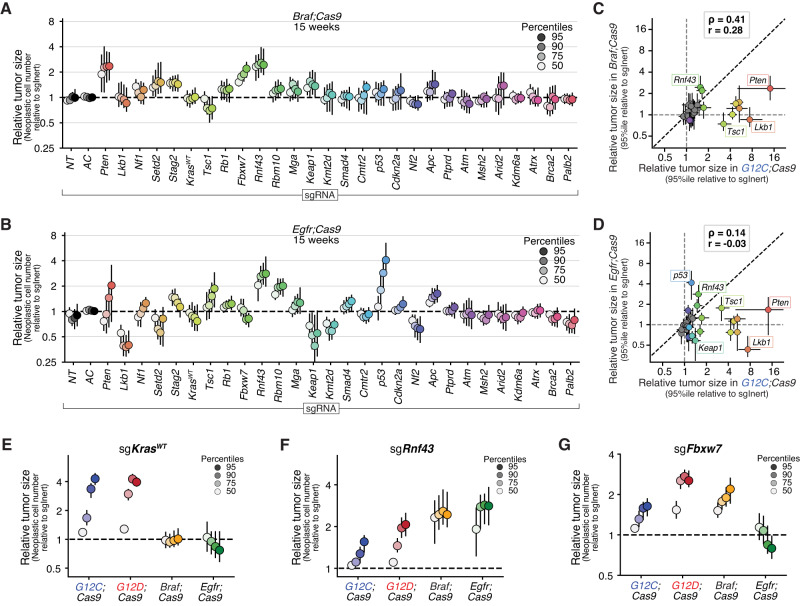
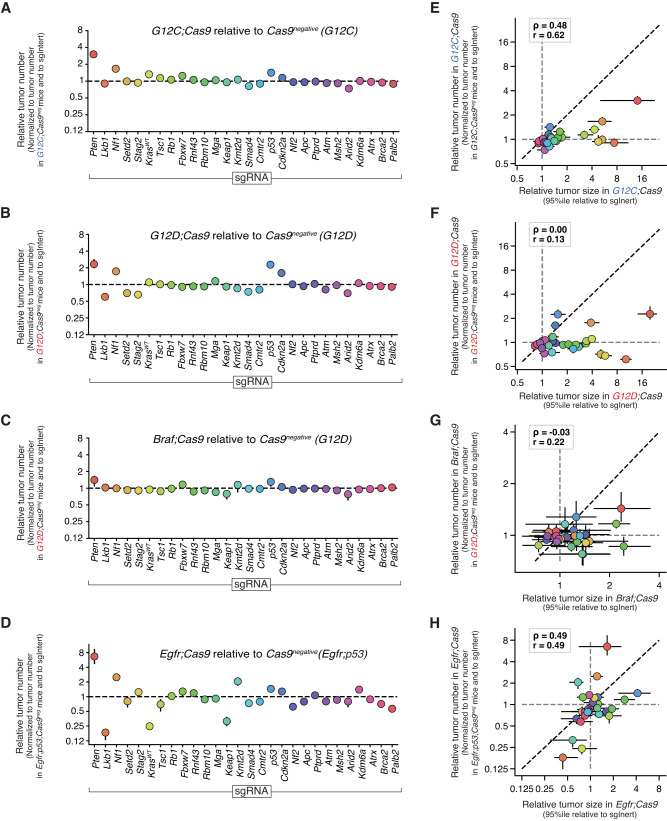
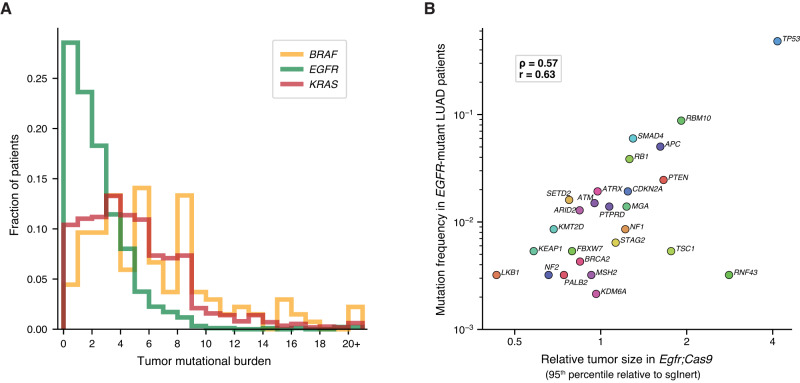
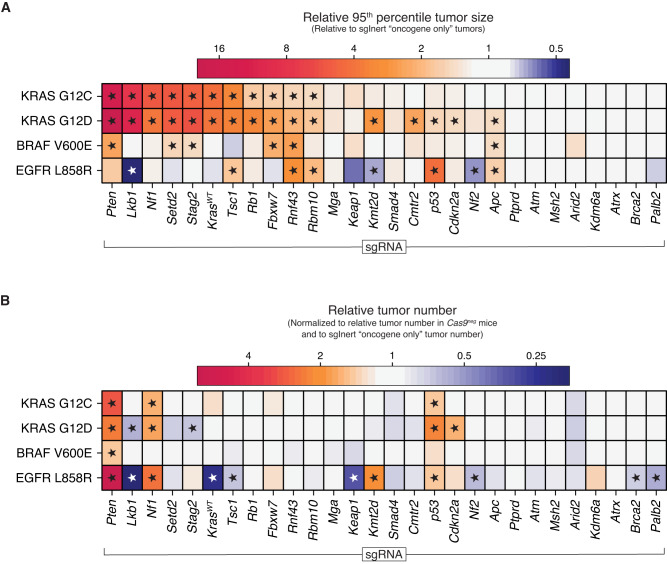
Tumors acquire alterations in oncogenes and tumor suppressor genes in an adaptive walk through the fitness landscape of tumorigenesis. However, the interactions between oncogenes and tumor suppressor genes that shape this landscape remain poorly resolved and cannot be revealed by human cancer genomics alone. Here, we use a multiplexed, autochthonous mouse platform to model and quantify the initiation and growth of more than one hundred genotypes of lung tumors across four oncogenic contexts: KRAS G12D, KRAS G12C, BRAF V600E, and EGFR L858R. We show that the fitness landscape is rugged-the effect of tumor suppressor inactivation often switches between beneficial and deleterious depending on the oncogenic context-and shows no evidence of diminishing-returns epistasis within variants of the same oncogene. These findings argue against a simple linear signaling relationship amongst these three oncogenes and imply a critical role for off-axis signaling in determining the fitness effects of inactivating tumor suppressors.


Conflict of interest statement

L.M.B., J.M.J., L.S., V.B.T., G.D.W., M.G., I.K.L., E.A.A., G.G., D.A., J.J.M., and M.J.R. are current or former employees and shareholders of D2G Oncology. I.P.W. is a co-founder, employee, and shareholder of D2G Oncology. D.A.P. and M.M.W. are co-founders, shareholders, members of the board of directors, and compensated scientific advisors of D2G Oncology. I.P.W., D.A.P., and M.M.W. are co-inventors of patents relating to technologies for autochthonous mouse models of human cancer, which D2G Oncology has exclusively licensed from Stanford University. D.D. and A.C. are employees and shareholders of Cellecta. L.E.D. is a scientific advisor and holds equity in Mirimus. L.E.D., M.P.Z., and Cornell University have licensed the technology described in this manuscript. K.P. is co-inventor on a patent related to EGFR T790M mutation testing issued, licensed, and with royalties paid from MSKCC/MolecularMD. K.P. reports grants to her institution from Boehringer Ingelheim, AstraZeneca, Roche/Genentech, and D2G Oncology, and consulting fees from AstraZeneca and Janssen. The remaining authors declare no competing financial interests.

Figures

Fig. 1
Fig. 1. Oncogenic KRAS G12C has a reduced ability to drive initiation and growth of lung tumors in vivo relative to oncogenic KRAS G12D.
A Experimental schematic depicting the composition of the pool of barcoded Lenti-sgRNA/Cre vectors (Lenti-D2G28-Pool/Cre), mouse genotypes, analysis time points, and readouts. B Genotype, time point, lentiviral titer, and number of mice in each group. C Lung weights of mice transduced with the indicated titers of Lenti-D2G28-Pool/Cre. Genotype and time post-tumor initiation are indicated. Each dot represents a mouse, and the bar is the median. Fold difference between medians and significance calculated using a two-sided Wilcoxon rank-sum test (P values = number in parentheses) are shown. n = 22 biologically independent animals used to calculate significance in each plot. D, E Representative histology of lungs from mice (from n = 3 mice for each timepoint-genotype pair). Mouse genotype, virus titer delivered to each mouse, and time post-tumor initiation are shown. Top scale bars = 3 mm; bottom scale bars = 500 μM. FI Total number of neoplastic cells (F) and total number of tumors greater than 1000 cells in size (G) across all Lenti-sgRNA/Cre vectors, normalized to viral titer. Total number of neoplastic cells (H) and total number of tumors greater than 1000 cells in size (I) only for Lenti-sgInert/Cre vectors (tumors driven by oncogenic Kras alone), normalized to viral titer. Mouse genotypes and time points are indicated. Each dot represents a mouse, and the bar is the median. Fold difference and significance calculated using a two-sided Wilcoxon rank-sum test (P values = number in parentheses) are shown. n = 44 (9-week comparison) and n = 77 (15-week comparison) biologically independent animals were used to calculate significance. J, K Number of tumors at or above the tumor size cutoff in G12D;Cas9 mice at 15 weeks and G12C;Cas9 mice at 15 weeks (J) or G12D;Cas9 at 9 weeks and G12C;Cas9 at 15 weeks post-tumor initiation (K). Each transparent line represents a mouse, and the solid line is the median tumor number. L Fold change in median tumor number between G12D;Cas9 and G12C;Cas9 at 15 weeks (black line) and G12D;Cas9 at 9 weeks versus G12C;Cas9 at 15 weeks (gray line) post-tumor initiation.
Fig. 2
Fig. 2. Tumor suppressor genes have strikingly similar effects on the initiation and growth of KRAS G12C- and G12D-driven lung tumors.
A, B Relative size (neoplastic cells) of the tumor at the indicated percentiles of the tumor size distributions for barcoded Lenti-sgRNA/Cre vectors targeting each gene, relative to the size of the sgInert tumor at the same percentile, in G12C;Cas9 mice (n = 29 biologically independent animals) (A) and G12D;Cas9 mice (n = 48 biologically independent animals) (B) at 15 weeks post-tumor initiation. The point represents the value calculated from the initial data, and 95% confidence intervals from bootstrapping are shown. C 95th percentile relative tumor sizes (relative to sgInert) for 5 of the G12D;Cas9 study groups (see Supplementary Fig. 5A, B for comparisons between additional study groups). Each point represents the tumors initiated with one Lenti-sgRNA/Cre vector and the bars are the 95th percent confidence intervals determined by bootstrapping. Gray line indicates equal effect. Pearson r is indicated. D, E Relative size of the tumor at the 95th percentile of the tumor size distributions in G12D;Cas9 mice at 15 weeks (D) or G12D;Cas9 mice at 9 weeks (n = 25 biologically independent animals) (E) versus in G12C;Cas9 mice at 15 weeks post-tumor initiation. Each dot represents the tumors initiated from one Lenti-sgRNA/Cre vector and the bars are the 95th percent confidence intervals. Genes where the 95% CI excluded no effect in G12C;Cas9 and G12D;Cas9 mice are shown in color and some key genes are labeled. The black dotted line indicates equal effect. Spearman rank-order correlation (ρ) and Pearson correlation (r) are indicated. FI Relative size of the tumor at the indicated percentiles (see legend in (A, B)) of the tumor size distributions for barcoded Lenti-sgRNA/Cre vectors targeting Nf1 (F), KrasWT (G), Kmt2d (H), and Cmtr2 (I) across multiple arms of our main experiment and repeat studies in G12C;Cas9 and G12D;Cas9 mice. The significance of oncogene differences at the 95th percentile were calculated by combining the study groups for each oncogene using inverse variance weighting and comparing the resulting means and variances under a normally distributed null. Bonferroni-corrected, one-sided P values are shown for significant genes. For each study group from left to right along the x axes, data include n = 10, n = 10, n = 18, n = 13, n = 35, n = 23, and n = 33 biologically independent animals. Note that the two study groups from repeat studies in G12D;Cas9 correspond to Group 8 and Group 3 in Supplementary Fig. 5.
Fig. 3
Fig. 3. Oncogenic BRAF, EGFR, and KRAS have different abilities to initiate lung tumorigenesis and drive tumor growth.
A Experimental schematic showing the design of barcoded Lenti-sgRNA/Cre vectors (Lenti-D2G28-Pool/Cre), mouse genotypes, and analysis timepoints. B Mouse genotype, time point, lentiviral titer, and number of mice in each experimental group. C Representative histology of lungs from mice. Mouse genotype, viral titer, and time point post-tumor initiation are shown. Top scale bars = 3 mm; bottom scale bars = 500 μM. Titer represented in the Braf;Cas9 image was 900,000 TU, from a mouse in a separate titering experiment that used a similar virus pool. Titer represented in the Egfr;Cas9 image was 5,000,000 TU. DG Total number of neoplastic cells (D) and total number of tumors greater than 1000 cells in size (E) across all Lenti-sgRNA/Cre vectors, normalized to viral titer. Total number of neoplastic tumors cells (F) and total number of tumors greater than 1000 cells in size (G) only for Lenti-sgInert/Cre vectors (tumors driven by oncogene alone), normalized to viral titer. Mouse genotypes are indicated. Each dot represents a mouse, and the bar is the median. Fold differences between medians and significance calculated using a two-sided Wilcoxon rank-sum test (P values = number in parentheses) are shown. Fold differences are ratios of the following pairs, moving clockwise from the upper left: G12D;Cas9/Braf;Cas9, G12D;Cas9/Egfr;Cas9, G12C;Cas9/Egfr;Cas9, Braf;Cas9/G12C;Cas9. H The density function of sgInert tumor burden as a function of log(tumor size) at 15 weeks for G12D;Cas9, Braf;Cas9, and Egfr;Cas9. Comparison to G12C;Cas9 can be found in Supplementary Fig. 3F, G. Error bands represent the 95% confidence interval determined from bootstrapping. For all panels, Egfr;Cas9 mice are represented by n = 18 biologically independent animals, Braf;Cas9 mice are represented by n = 28 biologically independent animals, G12D;Cas9 mice are represented by n = 48 biologically independent animals, and G12C;Cas9 mice are represented by n = 29 biologically independent animals. I Schematic representation of the ability of each indicated oncogenic allele to drive in vivo lung tumor formation.
Fig. 4
Fig. 4. Oncogenic driver defines the landscape of tumor growth suppression in lung cancer.
A, B Relative size (neoplastic cells) of the tumor at the indicated percentiles of the tumor size distributions for barcoded Lenti-sgRNA/Cre vectors targeting each gene, relative to the size of the sgInert tumor at the same percentile, in Braf;Cas9 mice (A) and Egfr;Cas9 mice (B) at 15 weeks post-tumor initiation. Each dot represents the relative tumor size of tumors initiated from one Lenti-sgRNA/Cre vector at a given percentile and the bars are the 95% confidence intervals. C, D Relative size of the tumor at the 95th percentile of the tumor size distributions in G12C;Cas9 versus Braf;Cas9 mice (C) and Egfr;Cas9 mice (D). Each dot represents the tumors initiated from one Lenti-sgRNA/Cre vector and the bars are the 95% confidence intervals. Genes where the 95% confidence interval excluded no effect are shown in color and some key genes are labeled. Black dotted line indicates equal effect. Spearman rank-order correlation (ρ) and Pearson correlation (r) are indicated. EG Relative size of the tumor at the indicated percentiles of the tumor size distributions for Lenti-sgRNA/Cre vectors targeting KrasWT (E), Rnf43 (F), and Fbxw7 (G) and in tumors in the indicated genotypes of mice. Each dot represents the tumors initiated from one Lenti-sgRNA/Cre vector at a given percentile and the bars are the 95% confidence intervals. For all panels in this figure, Egfr;Cas9 mice are represented by n = 18 biologically independent animals, Braf;Cas9 mice are represented by n = 28 biologically independent animals, G12D;Cas9 mice are represented by n = 48 biologically independent animals, and G12C;Cas9 mice are represented by n = 29 biologically independent animals.
Fig. 5
Fig. 5. The impact of different tumor suppressors on lung tumor number is dependent on oncogenic context and largely independent of effects on tumor growth.
AD Impact of inactivating each gene on relative tumor number in the indicated genotypes of mice. Error bars represent the 95% confidence interval determined by bootstrapping the tumors and mice. EH Relative size of the tumor at the 95th percentile of the tumor size distributions versus relative tumor number in the indicated genotypes of mice. The impact of inactivation tumor suppressor genes on tumor number enrichment and tumor size are not correlated. Each dot represents the tumors initiated from one Lenti-sgRNA/Cre vector in the context of the oncogene indicated on the x- and y- axes. For relative tumor number metrics in all panels in this figure, Egfr;Cas9 mice are represented by n = 18 biologically independent animals, Braf;Cas9 mice are represented by n = 28 biologically independent animals, G12D;Cas9 mice are represented by n = 33 biologically independent animals, and G12C;Cas9 mice are represented by n = 18 biologically independent animals.
Fig. 6
Fig. 6. Causal effects predicted in mouse models correlate with the frequency of alterations in EGFR-driven human lung adenocarcinoma, where most patients have low tumor mutational burden.
A Total number of mutations per patient per megabase in the LUAD cohort of the AACR Project GENIE database. Analysis was restricted to samples sequenced with the MSK-IMPACT468 panel. Missense, stop, and frameshift variants were included, and any mutations predicted by Polyphen as “benign” or by Sift as “tolerated” were excluded. Patient sample sizes were: KRAS n = 1134, EGFR n = 935, and BRAF n = 135. The same patients were used for all following human analysis panels. B Correlation of relative tumor size at the 95th percentile to co-mutation rate of each gene tested in our model with EGFR in LUAD patients. CMTR2 was the only gene tested in our model that was not present in the MSK-IMPACT468 panel and therefore not included in this analysis. Spearman rank-order correlation (ρ) and Pearson correlation (r) are indicated.
Fig. 7
Fig. 7. The impact of tumor suppressor pathways on tumorigenesis largely depends on which oncogene is activated and is not predicted by the underlying strength of the oncogene alone.
A, B Relative tumor size ratio at the 95th percentile (A) and relative tumor number (B) for tumors with the indicated Lenti-sgRNA/Cre vector on the x-axis and oncogenic allele on the y-axis. Asterisks indicate effects that are significant with FDR at 0.05 and half a log2-fold change from neutral.

References

    1. Santos-Lopez A, et al. The roles of history, chance, and natural selection in the evolution of antibiotic resistance. eLife. 2021;10:e70676. - PMC - PubMed
    1. Gerlinger M, Swanton C. How Darwinian models inform therapeutic failure initiated by clonal heterogeneity in cancer medicine. Br. J. Cancer. 2010;103:1139–1143. - PMC - PubMed
    1. Fortunato A, et al. Natural selection in cancer biology: from molecular snowflakes to trait hallmarks. Cold Spring Harb. Perspect. Med. 2017;7:a029652. - PMC - PubMed
    1. Wright S. The roles of mutation, inbreeding, crossbreeding, and selection in evolution. Proc. XI Int. Congr. Genet. 1932;8:209–222.
    1. Aita T, Husimi Y. Fitness spectrum among random mutants on Mt. Fuji-type fitness landscape. J. Theor. Biol. 1996;182:469–485. - PubMed

Publication types

Substances