. 2023 Oct 12;14(1):6370.
doi: 10.1038/s41467-023-42170-0.

Palmitoylation-driven PHF2 ubiquitination remodels lipid metabolism through the SREBP1c axis in hepatocellular carcinoma

Affiliations

Palmitoylation-driven PHF2 ubiquitination remodels lipid metabolism through the SREBP1c axis in hepatocellular carcinoma

Do-Won Jeong et al. Nat Commun. .

Abstract

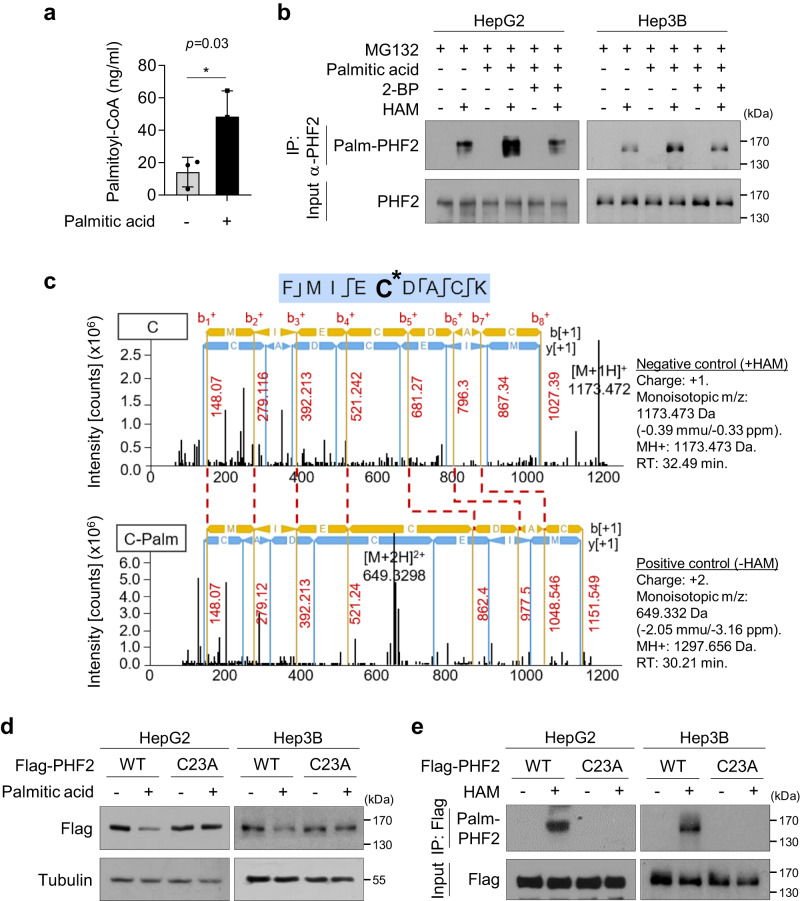
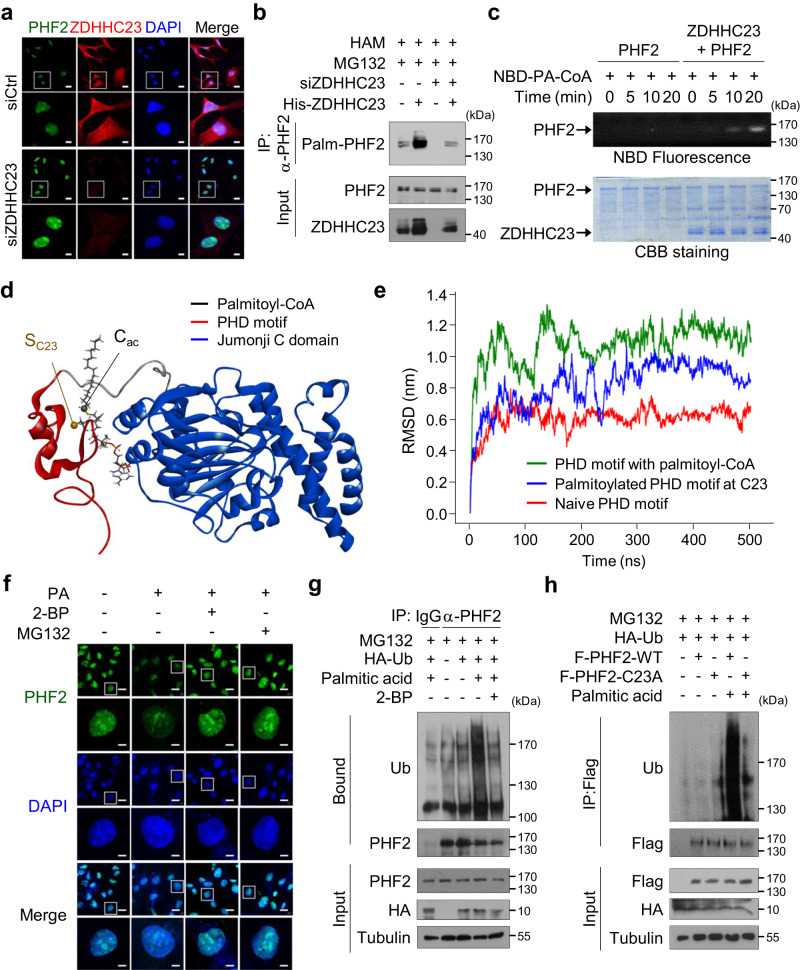
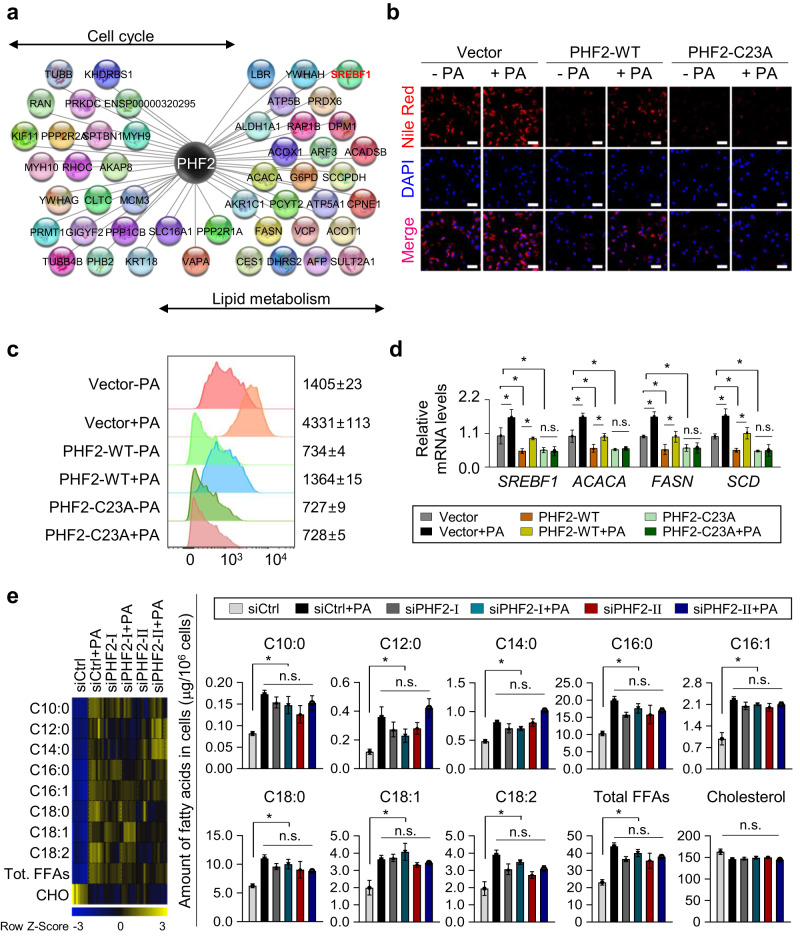
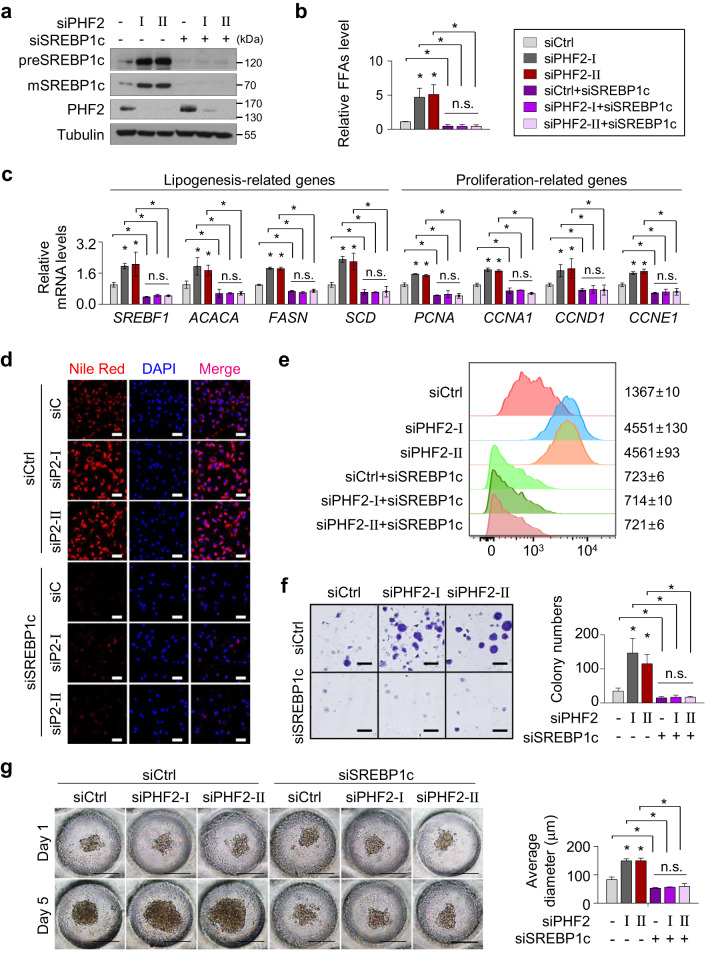
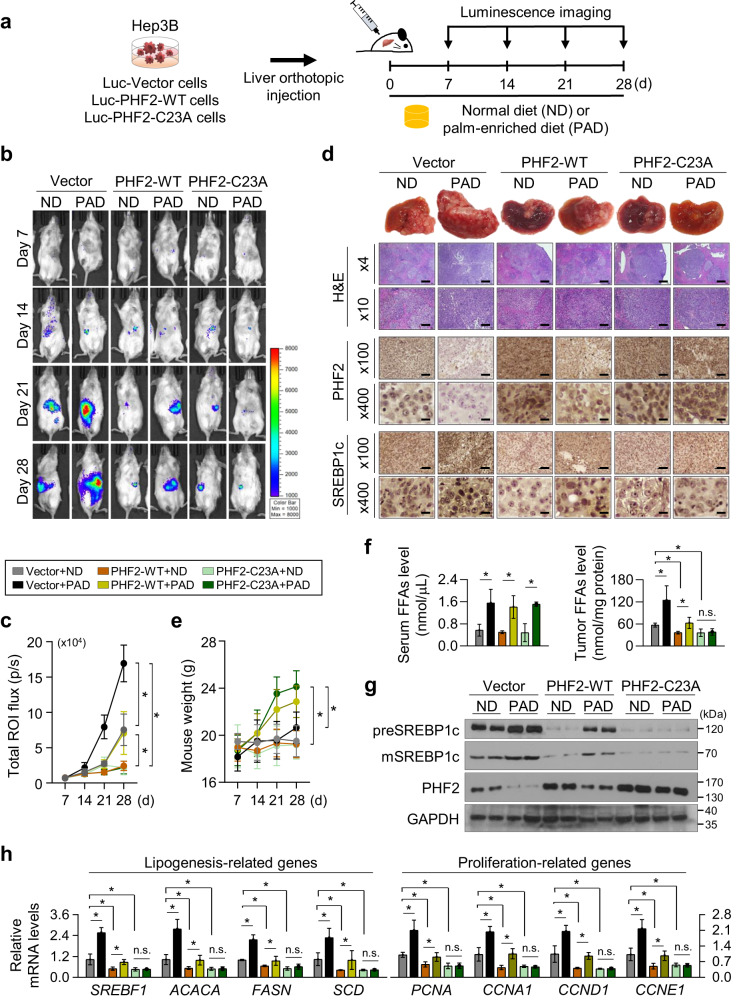
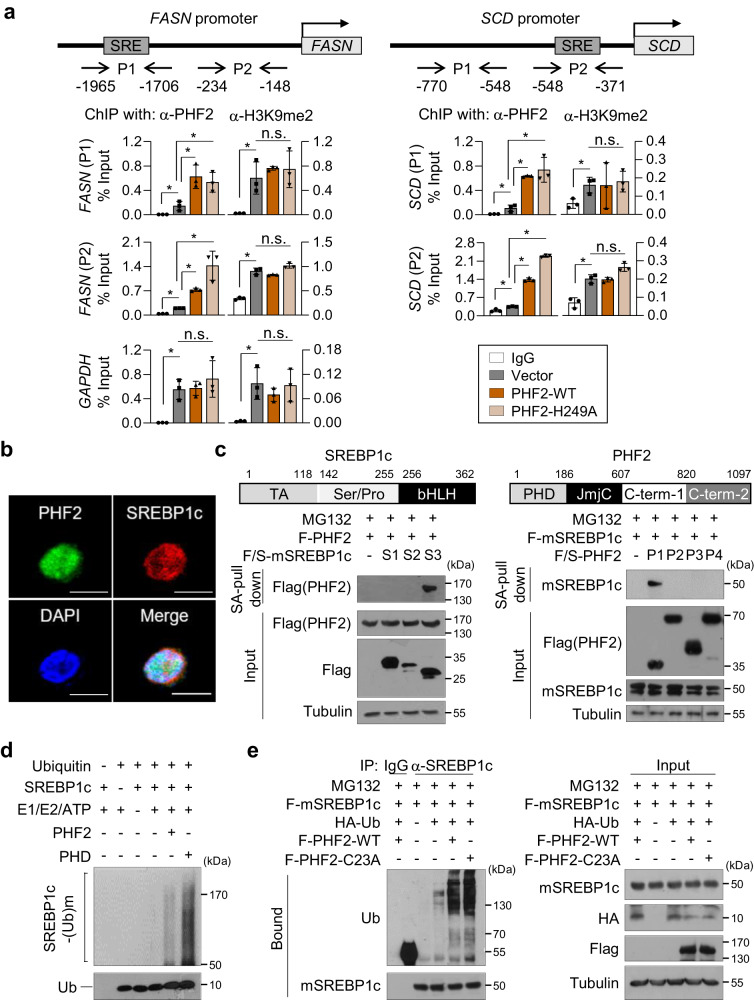
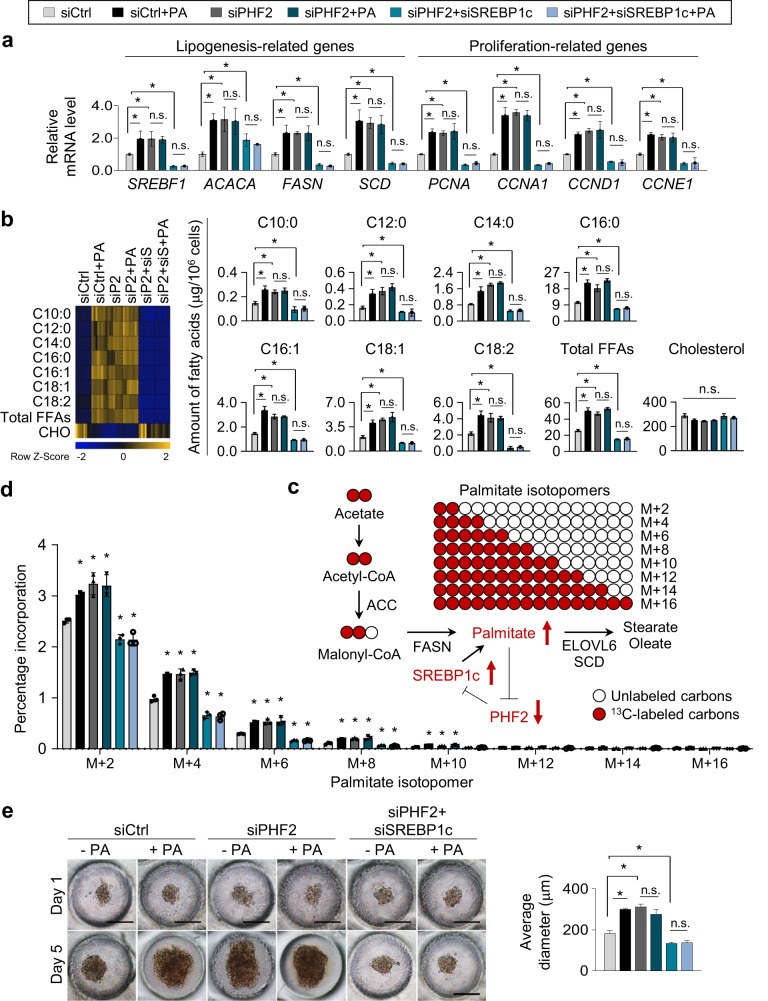
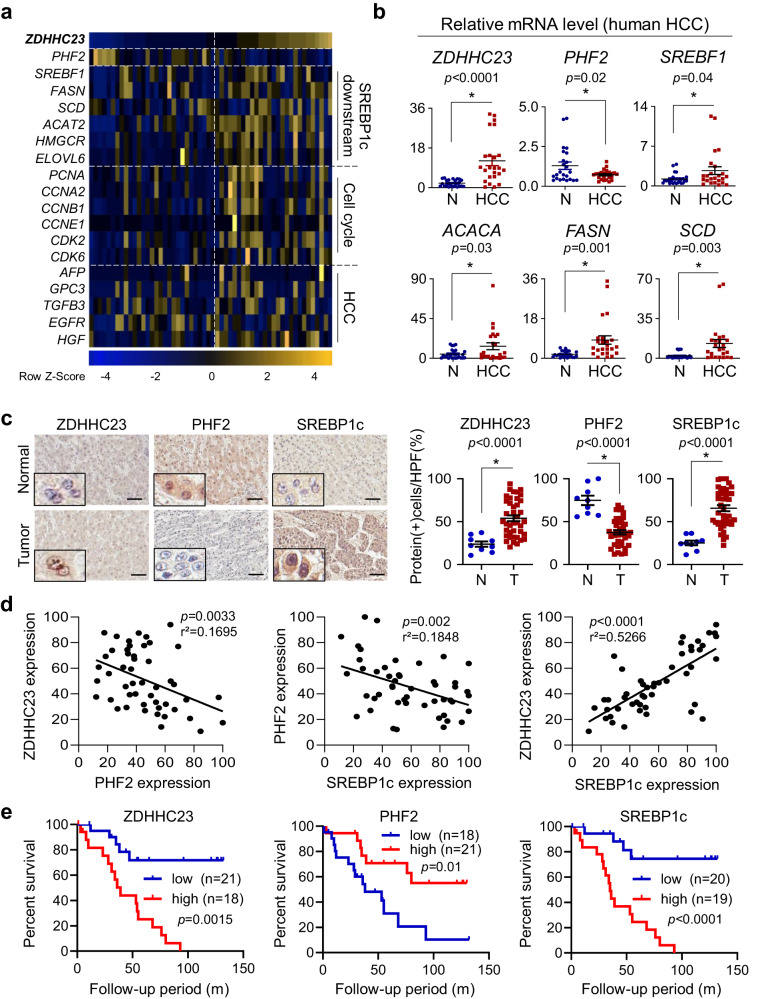
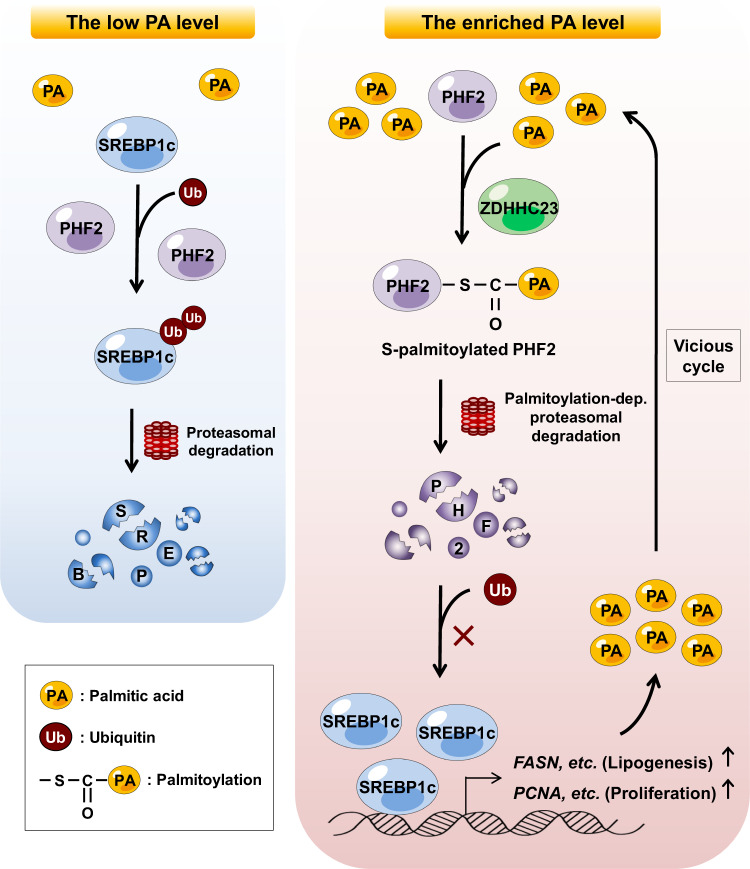
Palmitic acid (PA) is the most common fatty acid in humans and mediates palmitoylation through its conversion into palmitoyl coenzyme A. Although palmitoylation affects many proteins, its pathophysiological functions are only partially understood. Here we demonstrate that PA acts as a molecular checkpoint of lipid reprogramming in HepG2 and Hep3B cells. The zinc finger DHHC-type palmitoyltransferase 23 (ZDHHC23) mediates the palmitoylation of plant homeodomain finger protein 2 (PHF2), subsequently enhancing ubiquitin-dependent degradation of PHF2. This study also reveals that PHF2 functions as a tumor suppressor by acting as an E3 ubiquitin ligase of sterol regulatory element-binding protein 1c (SREBP1c), a master transcription factor of lipogenesis. PHF2 directly destabilizes SREBP1c and reduces SREBP1c-dependent lipogenesis. Notably, SREBP1c increases free fatty acids in hepatocellular carcinoma (HCC) cells, and the consequent PA induction triggers the PHF2/SREBP1c axis. Since PA seems central to activating this axis, we suggest that levels of dietary PA should be carefully monitored in patients with HCC.


Conflict of interest statement

The authors declare no competing interests.

Figures

Fig. 1
Fig. 1. PHF2 is palmitoylated at cysteine 23.
a Levels of palmitoyl-coenzyme A (palmitoyl-CoA) were quantified using liquid chromatography-mass spectrometry (LC-MS) in HepG2 cells treated by palmitic acid (PA) treatment for 24 h. Mean ± SD (n = 3 independent samples); *P < 0.05. Statistical analyses were based on a two-tailed unpaired t test. The exact p-values are presented in Supplementary Data 2. b Hepatocellular carcinoma (HCC) cells were pre-treated with 2-bromopalmitate (2-BP, 50 µM) or dimethyl sulfoxide (DMSO) for 24 h and incubated with PA for 24 h, followed by MG132 (10 µM) for 8 h. Immunoprecipitation was performed using an anti-PHF2 antibody. The precipitated proteins were subjected to an acyl-biotin exchange (ABE) assay using hydroxylamine (HAM) treatment to remove PA from palmitoylated cysteine residues. Free cysteines were labeled with BMCC-Biotin. Finally, palmitoylated proteins were detected using streptavidin-HRP. n = 3 independent experiments. IP: immunoprecipitation; Palm-PHF2: palmitoylated PHF2. c The palmitoylation site within PHF2 was identified using LC-MS analysis. The y and b fragments detected are as indicated in the sequence. The palmitoylation of cysteine 23 residue (C23) in PHF2 was identified based on the shift of peptide peaks. d After transfection with wild-type (WT) PHF2 or C23A-mutated PHF2 plasmids, HCC cells lysates were subjected to western blotting. n = 3 independent experiments. e HCC cells were transfected with Flag-PHF2-WT or Flag-PHF2-C23A mutant. The expressed proteins were immunoprecipitated with Flag affinity beads and subjected to ABE assay. The palmitoylated proteins were detected using western blotting. n = 3 independent experiments. Source data are provided as a Source Data file.
Fig. 2
Fig. 2. ZDHHC23-mediated PHF2 palmitoylation at cysteine 23 enhances its ubiquitination.
a Hep3B cells were transfected with siZDHHC23 and immunofluorescence analysis was performed using indicated antibodies. Scale bar = 20 (low magnification) and 6 µm (high magnification). b HepG2 cells were transfected with siZDHHC23 or His-ZDHHC23, and treated with MG132. After immunoprecipitation with an anti-PHF2 antibody, the palmitoylated PHF2 was detected using ABE assay. n = 3 independent experiments. c An in vitro palmitoylation assay was performed using purified PHF2 and ZDHHC23 proteins. PHF2 palmitoylation was detected using a fluorescence-labeled palmitoyl-CoA analog. The proteins used in the assay were stained using Coomassie Brilliant Blue staining. n = 3 independent experiments. NBD-PA-CoA: (N-[(7-nitro-2-1,3-benzoxadiazol-4-yl)-methyl] amino) palmitoyl-coenzyme A. d 3D structure of PHF2 when the palmitoyl-CoA is in close proximity to C23 of the PHD domain (d = 5 Å). Red and blue ribbons represent the plant homeodomain (PHD) and Jumonji C domain, respectively, and sticks represent palmitoyl-CoA. e The time evolution of root mean square deviation (RMSD) for the PHD motif in the presence of palmitoyl-CoA (d = 5 Å), the PHD motif in the absence of palmitoyl-CoA, and the palmitoylated PHD domain in target to those of native particulate methane monooxygenase (pMMO) as a reference structure. f Hep3B cells were pre-treated with 2-BP and incubated with PA, followed by treatment with MG132. The level of PHF2 protein was determined using immunofluorescence. Scale bar = 20 (low magnification) and 5 µm (high magnification). g HepG2 cells were transfected with the indicated plasmids and treated with 2-BP and PA. After treatment of MG132 for 8 h, cells were immunoprecipitated using an anti-PHF2 antibody and subjected to immunoblotting. n = 3 independent experiments. h Flag-PHF2-WT or Flag-PHF2-C23A transfected cells were treated with PA and MG132. Immunoprecipitation was performed using Flag affinity beads. n = 3 independent experiments. F: Flag. Source data are provided as a Source Data file.
Fig. 3
Fig. 3. PHF2 is a determinant of PA-induced lipogenesis in HCC cells.
a HepG2 cells were transfected with Flag/SBP-PHF2 plasmid. The proteins purified by Flag or SA affinity beads were subjected to LC-MS and then co-expressed proteins were analyzed. Systemic networks generated by Cytoscape presented the functions of PHF2-interacting proteins. Hep3B cells were transfected with the indicated plasmids and treated with or without PA. b Cells were fixed with formaldehyde, stained with Nile Red and DAPI, and visualized using a fluorescence microscope. Scale bar = 60 µm. n = 3 independent experiments. c FACS analysis of Nile Red stained cells. Numbers indicate the mean fluorescence intensity. d Total RNAs were isolated from the transfected Hep3B cells with the indicated plasmids. The expression of lipogenesis-related genes was quantified by RT-qPCR relative to 18S RNA. Mean ± SD (n = 3 independent experiments); *P < 0.05. Statistical analyses were based on a two-tailed unpaired t-test. e siControl or siPHF2s transfected HepG2 cells were treated with or without PA. Each free fatty acid (FFA) of cells (µg/106 cells) was analyzed by GC-TOF/MS. The color scale bar represents relative expression values ranging from low (blue) to high (yellow). Mean ± SD (n = 8 independent samples); *P < 0.05 by a two-tailed unpaired t test. Tot. total; CHO cholesterol. The exact p values are provided in Supplementary Data 2.
Fig. 4
Fig. 4. SREBP1c is essential for PHF2 loss-induced lipogenesis and cell proliferation.
ag Hep3B cells were transfected with the indicated siRNAs. a Proteins were analyzed using western blotting. n = 3 independent experiments. Source data are provided as a Source Data file. b Total FFA levels of cells were measured; mean ± SD (n = 3 independent samples). *P < 0.05. c The expression of lipogenesis- and proliferation-related genes were analyzed by RT-qPCR. mRNA levels were quantified relative to 18S RNA levels; mean ± SD (n = 3 independent experiments). *P < 0.05. d Representative images of Nile Red stained cells. Hep3B cells stained by Nile Red and DAPI were visualized by fluorescence microscopy. n = 3 independent experiments. Scale bar = 60 µm. siP2: siPHF2. e FACS analysis of Nile Red stained cells. Numbers indicate the mean fluorescence intensity. f The colony formation assay of Hep3B cells. Hep3B cells (1 × 104 cells/well) were seeded in six-well plates. Images were acquired after fixation with methanol and staining with 0.5% crystal violet. Scale bar = 4 mm. Colony numbers were counted; mean ± SD (n = 3 independent samples); *P < 0.05. g Representative light micrographs of spheroid formation of Hep3B cells cultured on oxygen-permeable chips for 1 and 5 days after seeding. Scale bar = 200 µm. The average spheroid diameter on Oxy chips was quantified using ImageJ. Mean ± SD (n = 3 independent experiments); *P < 0.05. For the analyses in (b, c, f, g), an unpaired two-tailed Student′s t test was conducted. The exact p values are shown in Supplementary Data 2.
Fig. 5
Fig. 5. A palmitic acid-enriched diet increases, but PHF2 decreases mice tumor growth.
a Schematic diagram of the in vivo model. Hep3B cells were transfected with luciferase-IRES-GFP-pcDNA (Vector), luciferase-IRES-GFP-WT-PHF2, or luciferase-IRES-GFP-PHF2-C23A. The cells from a single colony (5 × 105) by G418 selection were transplanted by orthotopic injection into the livers of the immunodeficient NOD.Cg-PrkdcscidIl2rgtm1Wjl/SzJ (NSG) mice. Mice were fed a PA-enriched diet (PAD) or normal diet (ND) for 28 days (n = 7 independent animals in each group). b Bioluminescence images of mice obtained every 7 days after transplantation using the Xenogen IVIS® Lumina Spectrum. Color scale bars represent luminescence intensity ranging from low (purple) to high (red). c Total flux (photons/s/cm2/sr) was measured and growth curves were plotted based on the bioluminescence intensities. Mean ± SD (n = 7 independent animals in each group); *P < 0.05. d (Top) Representative images of liver morphology. (Bottom) Hematoxylin and Eosin (H&E) staining and immunohistochemical analysis of tumor sections using the indicated antibodies and DAB staining. The scale bar represents 400, 100, and 25 µm in images taken at ×4, ×100, and ×400 magnifications, respectively. e The body weight of mice was measured at the indicated time point; mean ± SD (n = 7 independent animals for each group); *P < 0.05. f Total FFAs levels in mice serum and tumor tissues were presented; mean ± SD (n = 3 independent samples); *P < 0.05. g The expression levels of the indicated proteins in tumors of mice were analyzed using western blotting. n = 3 independent experiments. h mRNA levels of lipogenesis- and proliferation-related genes in tumors were quantified relative to 18S mRNA; mean ± SD (n = 3 independent experiments); *P < 0.05. For the analyses in (c, e, f, h), statistical significance was evaluated by a two-tailed Student’s t test. The exact p values are presented in Supplementary Data 2. Source data are provided as a Source Data file.
Fig. 6
Fig. 6. PHF2 destroys SREBP1c as an E3 ubiquitin ligase.
a HepG2 cells were transfected with the indicated plasmids. Cell lysates were subjected to ChIP-qPCR assays using anti-H3K9me2 or anti-PHF2 antibodies at the FASN or SCD promoters. GAPDH was used as a negative control; mean ± SD (n = 3 independent experiments); *P < 0.05. Statistical analyses were based on a two-tailed unpaired t-test. The exact p-values are shown in Supplementary Data 2. P1, P2: promoter 1, 2; H3K9me2: histone H3 lysine 9 dimethylation. b Immunofluorescence analysis was performed using the indicated antibodies in Hep3B cells. n = 3 independent experiments. Scale bar = 10 µm. c (Top) Schematic diagram of the segments of SREBP1c or PHF2. The indicated plasmids were transfected into HepG2 cells (Bottom, left) or 293 T cells (Bottom, right). Then, cells were subjected to immunoprecipitation and immunoblotting after MG132 treatment for 8 h. Western blotting using the indicated antibodies evaluated the purified proteins using SA affinity beads. n = 3 independent experiments. TA: a transcription-activation domain; Ser/Pro: a serine- and proline-rich region; bHLH: a basic helix-loop-helix domain; PHD: a plant homeodomain; JmjC: a Jumonji C domain; C-term: C-terminus. d An in vitro ubiquitination assay was performed. The enzymatic reaction was stopped by adding a sample buffer and proteins were analyzed by western blotting. n = 3 independent experiments. e HepG2 cells were transfected with the indicated plasmids and then incubated with MG132 for 8 h. Cell lysates were pull-downed with the anti-SREBP1 antibody, and the pull-downed proteins were analyzed by western blotting using the indicated antibodies. n = 3 independent experiments. Source data are provided as a Source Data file.
Fig. 7
Fig. 7. The PA/PHF2/SREBP1c loop rewires lipogenesis and proliferation in HCC cells.
a Hep3B cells were transfected with the indicated siRNAs and incubated with PA for 24 h. The expressions of lipogenesis- and proliferation-related genes in Hep3B cells were quantified by RT-qPCR relative to 18S RNA; mean ± SD (n = 3 independent experiments); *P < 0.05. b Each FFA of HepG2 cells was calculated using GC-TOF/MS. The color scale bar represents relative expression values; blue shows a low expression score; yellow shows a high expression score. Mean ± SD (n = 8 independent samples); *P < 0.05. siS siSREBP1c. c Schematic diagram showing incorporation of 2-carbon units from 13C-labeled acetate into PA. d The de novo distribution of 13C-labeled even isotopomers of palmitate in HepG2 cells was measured using LC-MS. Mean ± SD (n = 3 independent samples); *P < 0.05. e Representative photographs of spheroid-formed cells on oxygen-permeable chips on 1 and 5 day. Scale bar = 200 µm. The right panel shows the average diameter of the spheroids quantified using ImageJ. Mean ± SD (n = 3 independent samples); *P < 0.05. For the analyses in (a, b, d, e), an unpaired two-tailed Student′s t test was conducted. The exact p values are presented in Supplementary Data 2.
Fig. 8
Fig. 8. PHF2, ZDHHC23, and SREBP1c expression are reciprocally associated with clinical outcomes in HCC.
a The profile of gene expressions of liver tissues obtained from the NCBI GEO dataset (GSE54238). A heatmap of gene expressions was displayed based on ZDHHC23 expression values. The color scale bar represents relative expression values ranging from low (blue) to high (yellow). b The mRNA levels were measured in HCC tissues and adjacent normal liver tissues from 30 HCC patients. Comparisons were performed by the unpaired t-test; mean ± SD (n = 30 independent liver tissues). Statistical analyses were based on a two-tailed unpaired t-test. ce Analysis of a human HCC tissue array containing 38 pairs of clinical HCC with corresponding nine normal tissues (SuperBioChips Lab, Seoul, South Korea). c (Left) Representative images of HCC tissues immunostained with the indicated antibodies. Scale bar = 60 µm. (Right) The staining scores were calculated based on immune-positive cell numbers; mean ± SD; P values were calculated by a two-tailed unpaired t-test. HPF a high-power field; N adjacent normal tissues; T HCC tissues. d A simple linear regression analysis examined correlations between proteins in HCC tissues. r2, a measure of goodness-of-fit, is calculated by comparing the sum-of-squares from the regression line with the sum-of-squares. e Kaplan–Meier analysis of the survival of HCC patients. Blue and red lines represent the indicated proteins’ low- and high-expression groups, respectively. P values were calculated using the log-rank test.
Fig. 9
Fig. 9. Diagram of the regulatory loop formed by the PA/PHF2/SREBP1c axis.
Low PA cellular levels cause PHF2-mediated SREBP1c degradation (left panel). PA-enriched conditions enhance ZDHHC23-dependent PHF2 palmitoylation, resulting in the proteasomal degradation of PHF2. Following PHF2 degradation, SREBP1c becomes stable and induces PA levels in HCC cells (right panel). Finally, the vicious cycle of PA/PHF2/SREBP1c results in a poor HCC prognosis.

References

    1. Fortschegger K, Shiekhattar R. Plant homeodomain fingers form a helping hand for transcription. Epigenetics. 2011;6:4–8. - PMC - PubMed
    1. Sinha S, et al. Alterations in candidate genes PHF2, FANCC, PTCH1 and XPA at chromosomal 9q22.3 region: pathological significance in early- and late-onset breast carcinoma. Mol. Cancer. 2008;7:84. - PMC - PubMed
    1. Ghosh A, et al. Association of FANCC and PTCH1 with the development of early dysplastic lesions of the head and neck. Ann. Surg. Oncol. 2012;19:S528–538. - PubMed
    1. Lee KH, et al. PHF2 histone demethylase acts as a tumor suppressor in association with p53 in cancer. Oncogene. 2015;34:2897–2909. - PubMed
    1. Fu Y, et al. MiR-221 promotes hepatocellular carcinoma cells migration via targeting PHF2. Biomed. Res. Int. 2019;2019:4371405. - PMC - PubMed

Publication types

MeSH terms

Substances