. 2023 Nov;24(11):1908-1920.
doi: 10.1038/s41590-023-01645-4. Epub 2023 Oct 12.

Targeting PGLYRP1 promotes antitumor immunity while inhibiting autoimmune neuroinflammation

Affiliations

Targeting PGLYRP1 promotes antitumor immunity while inhibiting autoimmune neuroinflammation

Alexandra Schnell et al. Nat Immunol. 2023 Nov.

Abstract

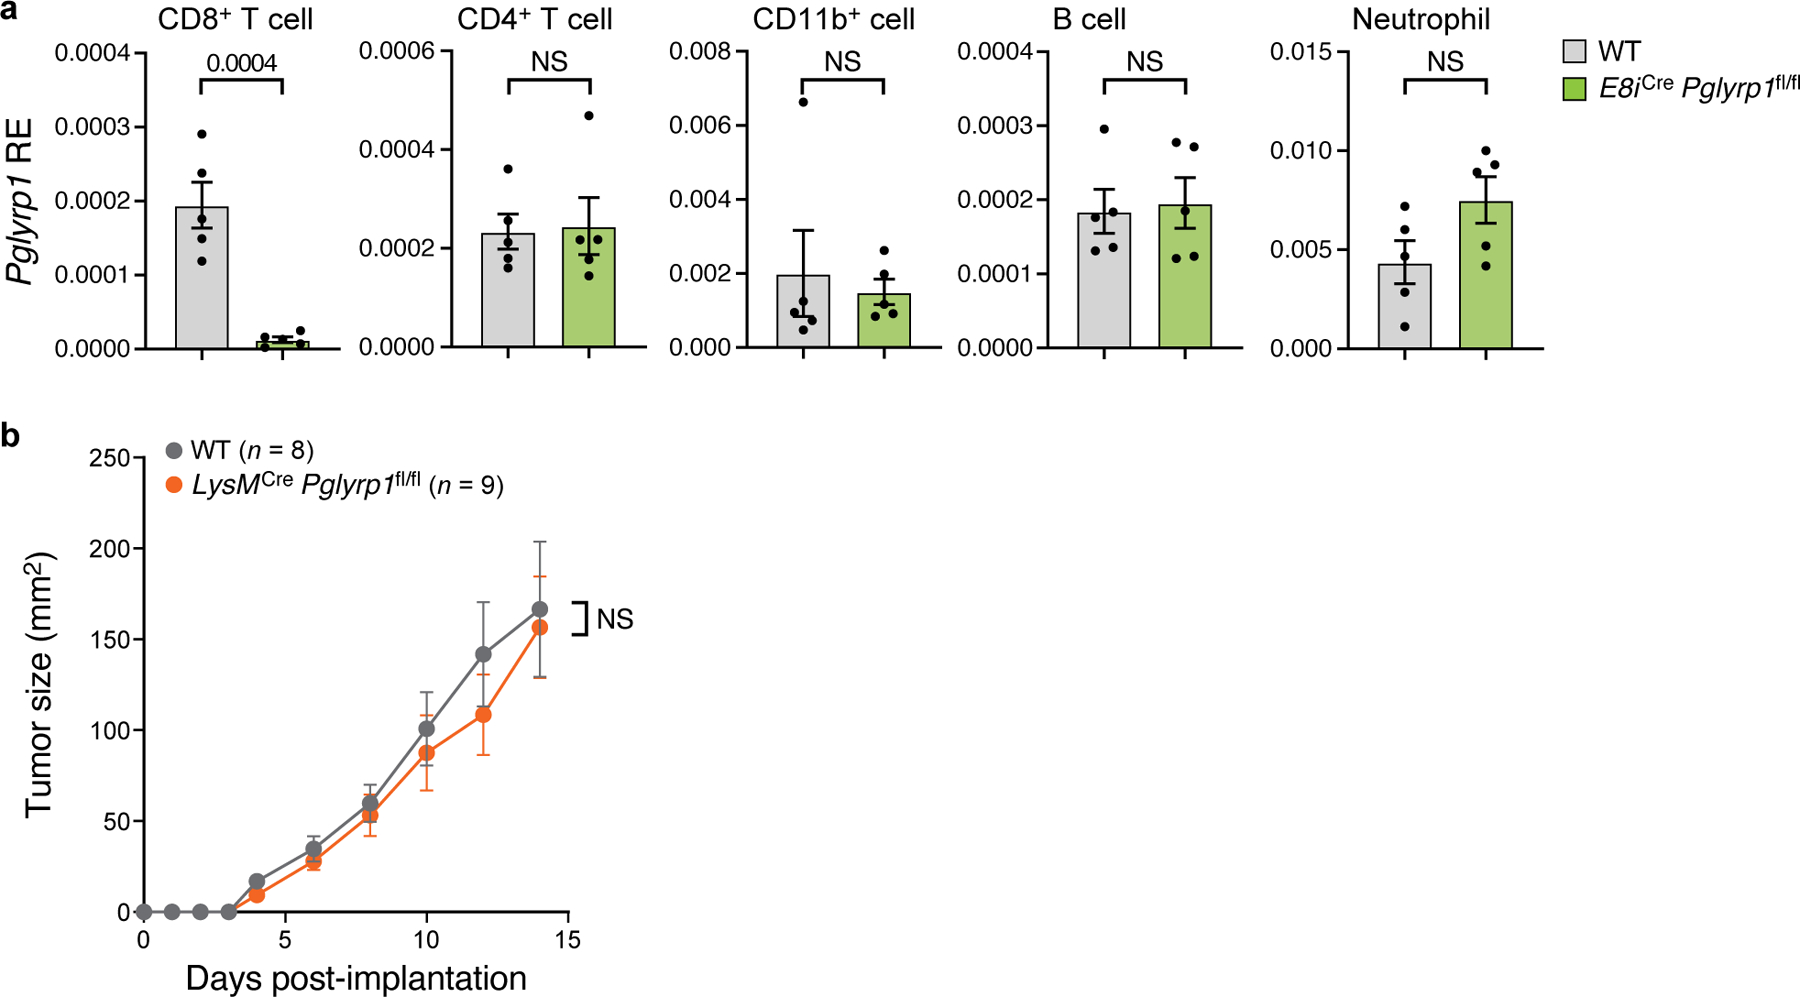
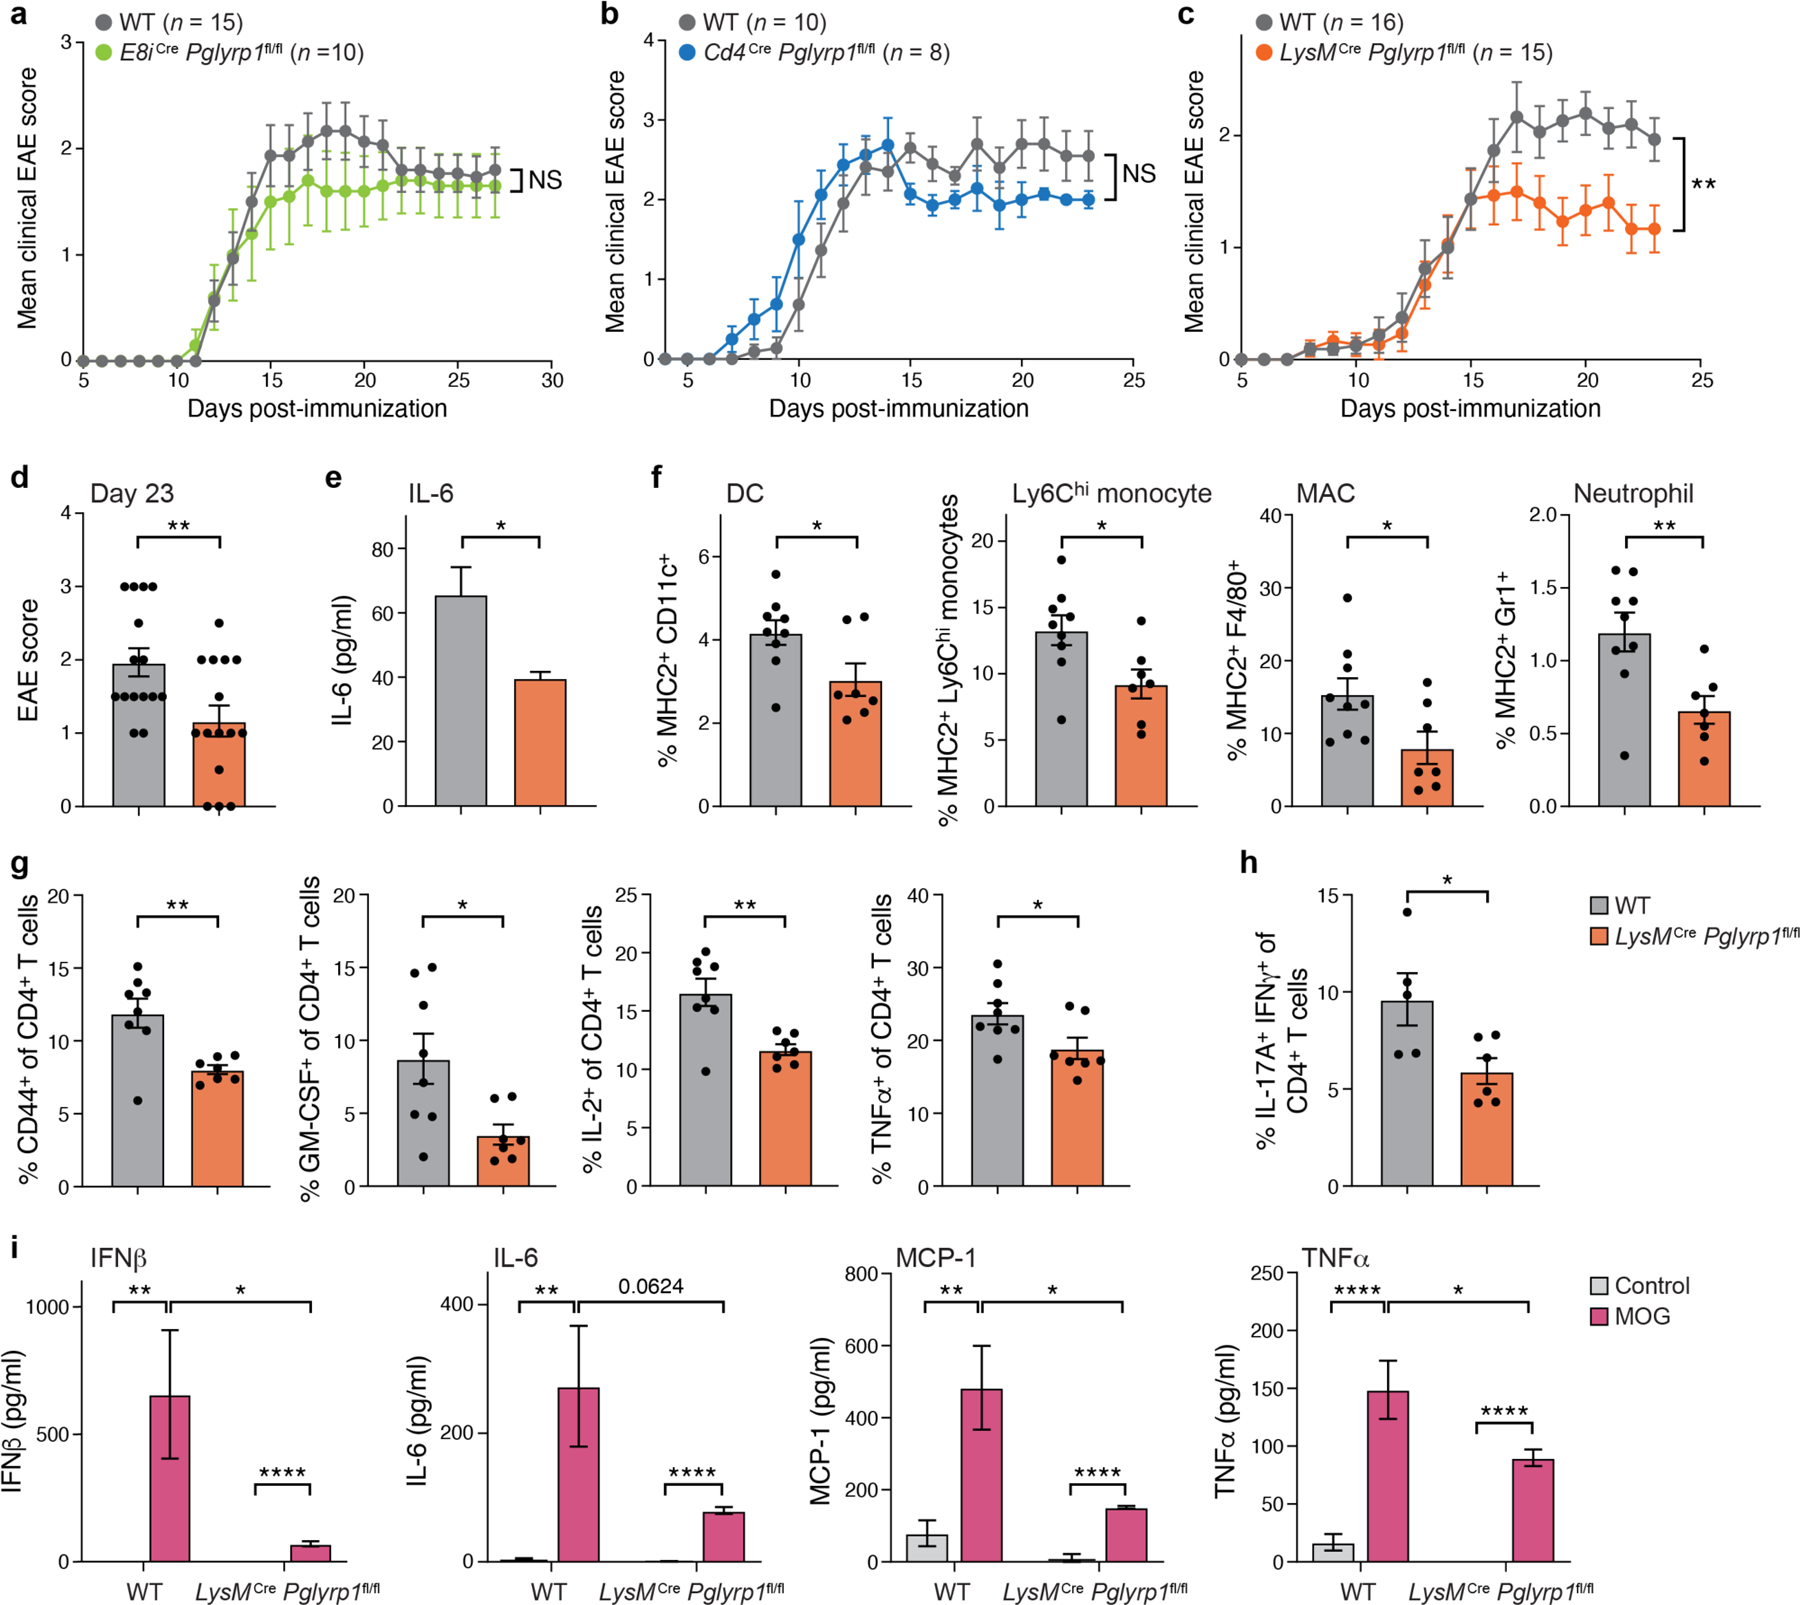
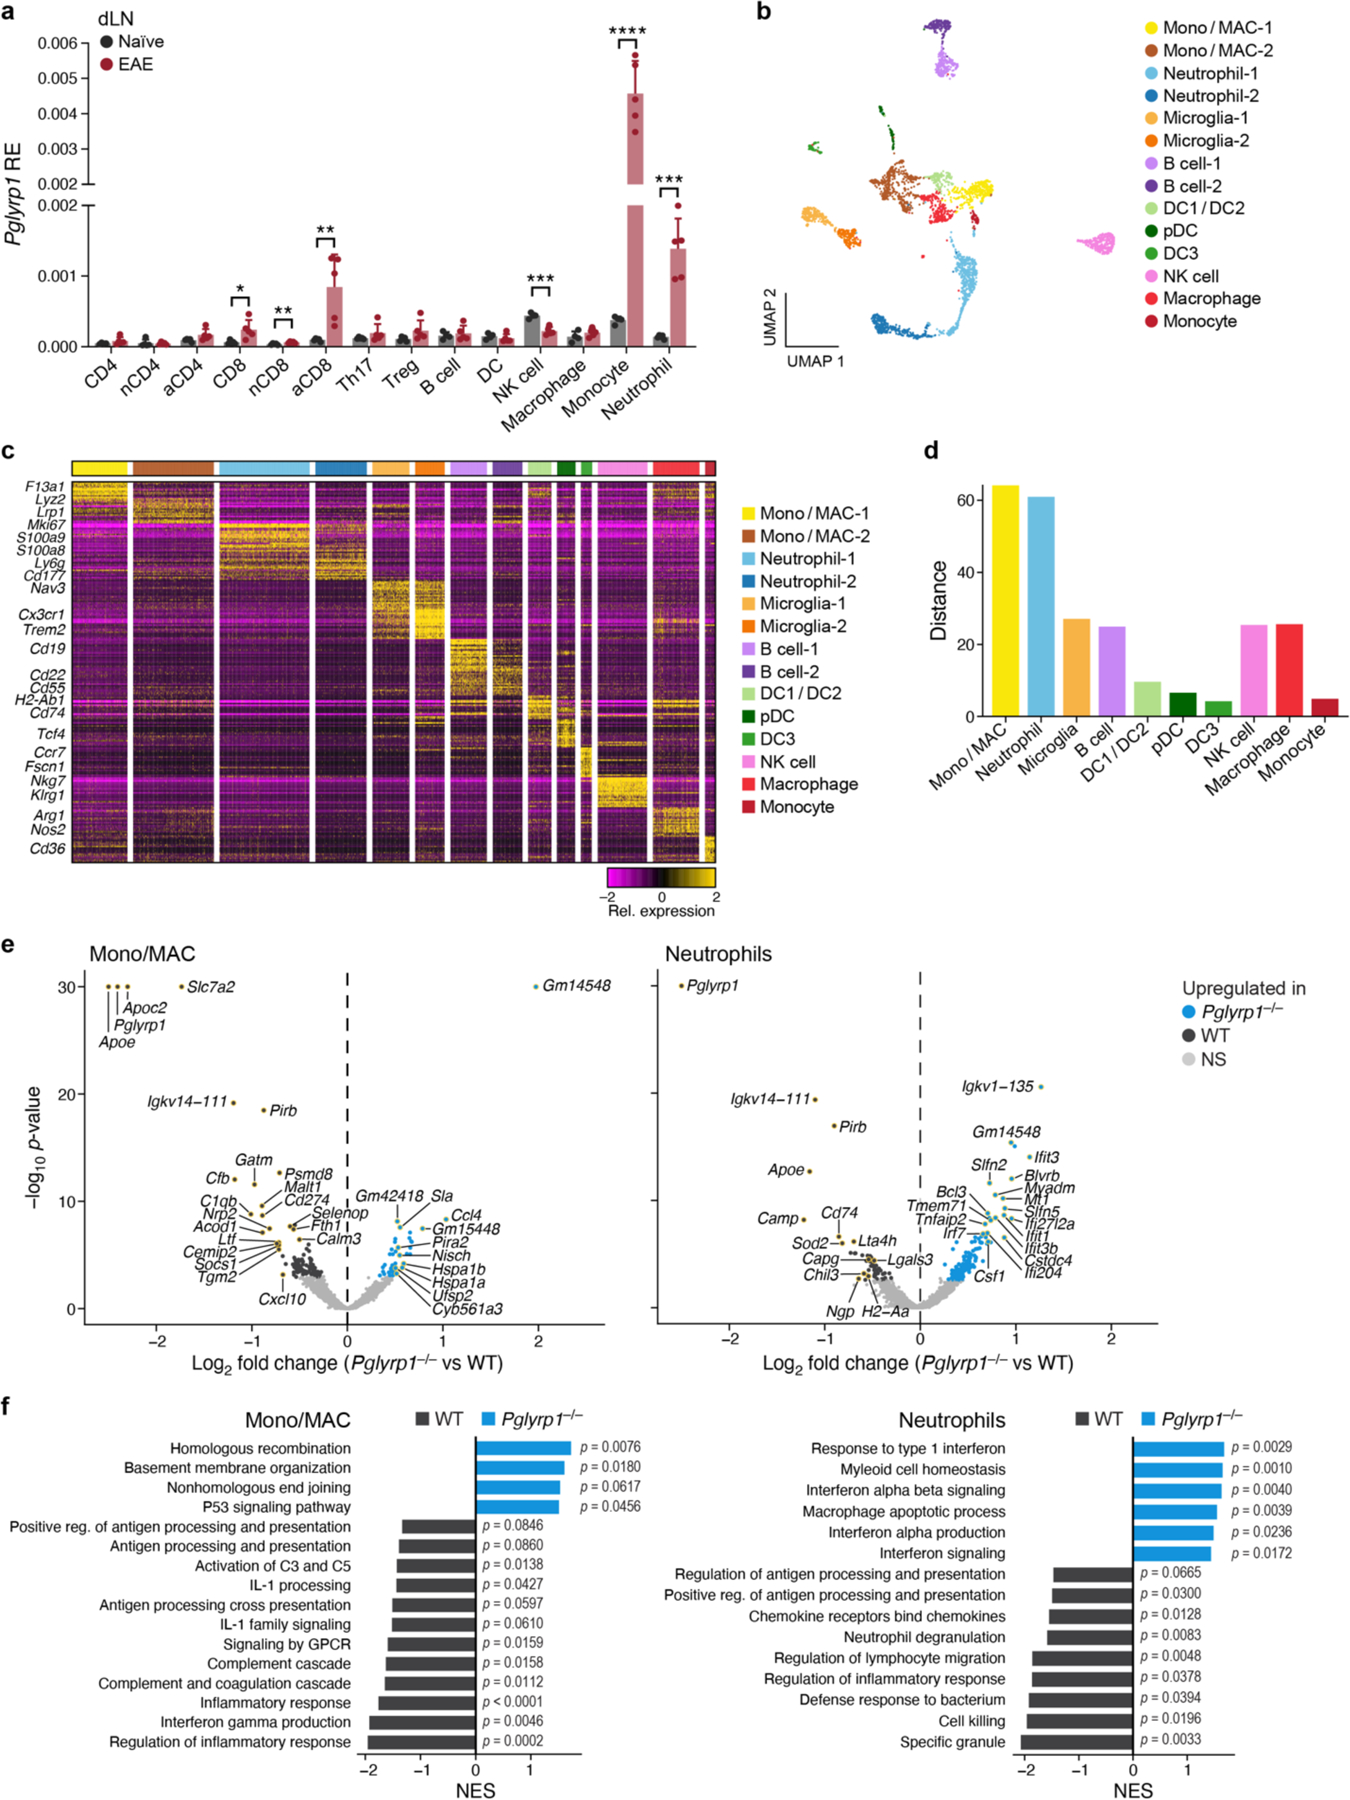
Co-inhibitory and checkpoint molecules suppress T cell function in the tumor microenvironment, thereby rendering T cells dysfunctional. Although immune checkpoint blockade is a successful treatment option for multiple human cancers, severe autoimmune-like adverse effects can limit its application. Here, we show that the gene encoding peptidoglycan recognition protein 1 (PGLYRP1) is highly coexpressed with genes encoding co-inhibitory molecules, indicating that it might be a promising target for cancer immunotherapy. Genetic deletion of Pglyrp1 in mice led to decreased tumor growth and an increased activation/effector phenotype in CD8+ T cells, suggesting an inhibitory function of PGLYRP1 in CD8+ T cells. Surprisingly, genetic deletion of Pglyrp1 protected against the development of experimental autoimmune encephalomyelitis, a model of autoimmune disease in the central nervous system. PGLYRP1-deficient myeloid cells had a defect in antigen presentation and T cell activation, indicating that PGLYRP1 might function as a proinflammatory molecule in myeloid cells during autoimmunity. These results highlight PGLYRP1 as a promising target for immunotherapy that, when targeted, elicits a potent antitumor immune response while protecting against some forms of tissue inflammation and autoimmunity.


Conflict of interest statement

Competing interests statement

A.C.A. is a member of the SAB for Tizona Therapeutics, Trishula Therapeutics, Compass Therapeutics, Zumutor Biologics, ImmuneOncia, and Excepgen, which have interests in cancer immunotherapy. A.C.A. is also a paid consultant for iTeos Therapeutics and Larkspur Biosciences. V.K.K. is cofounder of Celsius Therapeutics, Tizona Therapeutics, Larkspur Biosciences and Bicara Therapeutics. A.C.A.’s and V.K.K.’s interests are reviewed and managed by the Brigham and Women’s Hospital and Partners Healthcare in accordance with their conflict-of-interest policies. A.R. is a co-founder and equity holder of Celsius Therapeutics, an equity holder in Immunitas, and was an SAB member of ThermoFisher Scientific, Syros Pharmaceuticals, Neogene Therapeutics and Asimov until July 31, 2020. A.R. is an employee of Genentech (member of the Roche Group) since August 2020, and has equity in Roche. All other authors declare no competing interests.

Figures

Extended Data Fig. 1
Extended Data Fig. 1. Pglyrp1 is expressed on exhausted T cells in human cancer.
Expression of Pglyrp1 and co-inhibitory receptors in single immune cells of human melanoma samples23. Plotted are the percent of cells with UMI count 1. Annotation as defined in publication.
Extended Data Fig. 2
Extended Data Fig. 2. Association between the expression levels of Pglyrp1 and survival rate in different human cancers.
Overall survival of patients with breast cancer (BRCA) (n = 1,100), HER2-positive BRCA (BRCA-Her2) (n = 82), colon adenocarcinoma (COAD) (n = 458), and lung squamous cell carcinoma (LUSC) (n = 501) grouped by PGLRYP1 expression through TIMER2 database70. Split expression percentage of patients: 20%. Analyses were performed with log-rank Mantel-Cox test. Hazard ratio (HR) and p-value are provided.
Extended Data Fig. 3
Extended Data Fig. 3. Immune-profiling of tumors in Pglyrp1-deficient mice.
(a) Pglyrp1−/− mouse validation. Relative expression (RE) of Pglyrp1 transcript in WT, Pglyrp1−/+, and Pglyrp1−/− CD8+ T cells from the spleen by qPCR (n = 2–3). The expression is depicted as relative to WT cells. The bar indicates the mean. (b–d) Analysis of the immune system in the colon of 7-week-old Pglyrp1−/− mice and WT littermates by flow cytometry (n = 3). General immune system composition (b), and intra-cellular cytokine staining in CD4+ T cells (c) and CD8+ T cells (d) are displayed. (e, f) B16-OVA tumors were implanted into WT and Pglyrp1−/− mice (n = 7). (e) Mean tumor growth and (f) tumor sizes on day 16 are shown. (g) MC38-OVA tumors were implanted into WT and Pglyrp1−/− mice and mice were treated with anti-PD-1 antibody on days 6, 8, and 10 post tumor-implantation. The control group included WT mice injected with control immunoglobulin (Rat IgG2a). (h) Relative expression of Pglyrp1 transcript in different immune populations isolated from MC38-OVA tumors grown in WT mice by qPCR (n = 4). (i) Frequency of different immune populations in MC38-OVA tumors grown in WT and Pglyrp1−/− mice (n = 9) by flow cytometry. In (b-i) data are presented as the mean with ±SEM. Unpaired two-tailed t-tests were performed. NS, not significant.
Extended Data Fig. 4
Extended Data Fig. 4. Immune populations in the dLN and spleen of tumor-bearing Pglyrp1-deficient mice.
(a) Frequency of Treg cells (CD45+ TCRβ+ CD4+ FOXP3+) in the spleen of naïve mice (n = 3). (b, d–g) MC38-OVA tumors were implanted into WT and Pglyrp1−/− mice and TILs were harvested for flow cytometry. (b) Summary plots of the frequency of Treg cells (CD45+ TCRβ+ CD4+ FOXP3+) in the dLN (WT n = 9, Pglyrp1−/− n = 8) (left) and spleen (WT n = 10, Pglyrp1−/− n = 8) (right). (c) Gating strategy for CD8+ T cells in the tumor. (d) Summary plots of the frequency of indicated cytokines in CD8+ T cells in the dLN (WT n = 9, Pglyrp1−/− n = 8) (top) and spleen (WT n = 10, Pglyrp1−/− n = 8) (bottom). (e) Summary plots of the frequency of indicated cytokines in CD4+ T cells in the tumor (WT n = 12, Pglyrp1−/− n = 8) (top), dLN (WT n = 10, Pglyrp1−/− n = 8) (middle) and spleen (WT n = 12, Pglyrp1−/− n = 8) (bottom). (f) Summary plots of the frequency of PD-1- and TIM-3-expressing CD8+ T cells in the dLN (n = 8) (top) and spleen (WT n = 10, Pglyrp1−/− n = 8) (bottom). (g) Summary plots of the frequency of PD-1- and TIM-3-expressing CD4+ T cells in the tumor (WT n = 10, Pglyrp1−/− n = 8). In all panels, data are presented as the mean with ±SEM. Unpaired two-tailed t-tests were performed. NS, not significant.
Extended Data Fig. 5
Extended Data Fig. 5. Characterization of tumor-infiltrating T cells in Pglyrp1-deficient mice.
(a) Heatmap representing cluster-specific upregulated genes (FDR <0.05, log2 fold change > log2(1.5)). If a gene was upregulated in multiple clusters, it is only shown once in the cluster block where it has the biggest fold change. (b) Gene set enrichment analysis of selected Gene Ontology (GO) terms and KEGG and Reactome pathways (top) and published CD8+ T cell signatures (bottom) enriched in CD8+ T cell-1 (stem-like) cluster vs. CD8+ T cell-2 (effector/exhausted) cluster. Only WT cells were included in the analysis. Naïve CD8–1 (Supplementary Table 7); naïve CD8–2 (Supplementary Table 7); terminally exhausted-156; transitory vs. stem-like54; terminally exhausted-253; transitory vs. exhausted54; exhausted T cells75; effector-like56. P-values were computed with the empirical phenotype-based permutation tests (GSEA) and the values shown in the figures were not adjusted for multiple comparisons. (c) RNA velocity analysis was performed on the CD8+ T cell clusters (Fig. 3a) using scVelo31. The velocity vector field is displayed as streamlines (top) and at single-cell level with each arrow showing the direction and speed (thickness) of movement of an individual cell (bottom). (d) Volcano plot of differentially expressed genes comparing WT vs. Pglyrp1−/− cells in the Treg cluster (Fig. 3a). Differential genes were computed as FDR < 0.05 and |log2 fold change| > 0.25. Positive log2 fold change corresponds to upregulation in Pglyrp1−/− cells and vice versa. Log2 fold changes and -log10 p-values were capped within [−1.5, 1.5] and [0, 20] respectively for visualization purposes. P-values were computed with the empirical Bayes quasi-likelihood F-tests in edgeR, then adjusted for multiple comparisons using the Benjamini & Hochberg method (FDR).
Extended Data Fig. 6
Extended Data Fig. 6. Analysis of the tumor phenotype in Pglyrp1fl/fl mice.
(a) Relative expression (RE) of Pglyrp1 in CD8+ T cells, CD4+ T cells, CD11b+ cells, B cells and neutrophils by qPCR (n = 5). MC38-OVA tumors were implanted into WT and E8iCrePglyrp1fl/fl mice. (b) Mean tumor growth of MC38-OVA tumors implanted into WT and LysMCrePglyrp1fl/fl mice (n = 8–9). In (a,b) data are presented as the mean with ± SEM. Unpaired two-tailed t-tests were performed. NS: not significant.
Extended Data Fig. 7
Extended Data Fig. 7. Analysis of CD8+ T cell phenotype and antigen-presentation of LysMCre Pglyrp1fl/fl splenocytes.
(a) Gating strategy of CD4+ T cells in the CNS. (b) On day 18 after immunization, CNS-infiltrating lymphocytes were extracted and analyzed for the expression of intracellular cytokines in CD8+ T cells by flow cytometry (n = 5). (c) Antigen-presentation assay with splenocytes from LysMCre Pglyrp1fl/fl or WT littermate controls with 2D2 naïve CD4+ T cells with or without MOG peptide (n = 4). Cell proliferation was measured by CellTrace Violet (CTV) staining. Quantification (left) and representative plots (right). (d) Cytokine concentration in the culture medium during antigen-presentation assay as in a, measured by legendplex (n = 4). In (b-d) data are presented as the mean with + SEM. Unpaired two-tailed t-tests were performed. NS: not significant.
Extended Data Fig. 8
Extended Data Fig. 8. scRNA-seq of CNS-infiltrated myeloid cells in Pglyrp1−/− mice during EAE.
(a) UMAP of CNS-infiltrating myeloid cells (3,698 cells). EAE was induced in Pglyrp1−/− and WT littermate controls and CNS-infiltrating myeloid cells were sorted (CD45+ CD3− CD19−) for scRNA-seq at disease onset (day 10). (b) Venn diagram depicting the overlap in upregulated genes (FDR < 0.05, |log2 fold change| > 0.25) in WT cells (top) and Pglyrp1−/− cells (bottom) both in mono/MAC and neutrophil clusters as defined in (Fig. 6b). (c) Monocyte treatment with PGN, PGLYRP1, or PGN + PGLYRP1 (n = 3). Bar plot depicting the TNF concentration in the culture medium. Data are presented as the mean with ±SEM. Dotted line indicates the detection limit. Unpaired two-tailed t-tests were performed.
Fig. 1:
Fig. 1:. Co-expression of Pglyrp1 with co-inhibitory receptors in T cells
(a-c) Pglyrp1 is co-expressed with co-inhibitory receptors in B16 tumor-infiltrating CD8+ T cells based on scRNA-seq data . (a) Spearman correlation coefficients of genes with known co-inhibitory genes (Pdcd1, Tigit, Ctla4, Havcr2, Lag3) vs. with stemness genes (Ccr7, Cxcr5, Tcf7, Sell) across single cells. Genes significantly correlated with co-inhibitory genes (FDR < 0.05) and anti-correlated with stem-like genes (FDR < 0.05) were marked in red, and the counterpart in blue. P-values were computed with computed with two-sided Spearman’s asymptotic t-tests and then adjusted for multiple comparisons using the Benjamini & Hochberg method (FDR). (b) Heatmap displaying the expression of Pglyrp1 and selected co-inhibitory genes (top, rows) and selected stem-like genes (bottom, rows) in CD8+ T single cells (columns). The color indicates the cell-wise z-normalized expression level. Genes and cells were ordered by hierarchical clustering using Euclidean distance and Ward’s clustering criterion . (c) UMAP plot showing the rank-normalized expression of the CD8+ T cell dysfunction signature and Pglyrp1, Pdcd1, Havcr2, Lag3, and Tigit in tumor-infiltrating single CD8+ T cells . (d) Relative expression (RE) of Pglyrp1 in CD8+ T cells isolated from MC38-OVA tumors to CD8+ T cells isolated from the spleen by qPCR (n=3–4). (e) Relative expression (RE) of Pglyrp1 in CD4+ (left) and CD8+ (right) T cells in vitro differentiated with IL-27 to cells differentiated without IL-27 by qPCR (n=3). (f) Relative expression (RE) of Pglyrp1 in CD4+ T cells from wildtype (WT) or Maf−/−Prdm1−/− mice in vitro differentiated +/− IL-27 by qPCR (n=3). The expression was calculated relative to WT cells at day 0. (g,h) Influence of IL-27-signaling on the expression of Pglyrp1 in vivo. Expression of Pglyrp1 (normalized TPM) in CD8+ T cells isolated from B16 melanoma tumors of wildtype (WT) and Il27ra−/− mice (g) (n=4–5) or Maf−/−Prdm1−/− mice (h) (n=3–7) by bulk RNA-seq . In (d-h) data are presented as the mean with ± SEM. In (d-f,h) unpaired two-tailed t-tests were performed. In (g) a two-tailed Mann-Whitney test was performed. *, P <0.05; **, P <0.01; ***, P <0.001; ****, P <0.0001.
Fig. 2:
Fig. 2:. Pglyrp1-deficient mice show enhanced antitumor immunity
(a-c) MC38-OVA tumors were implanted into WT and Pglyrp1−/− mice. (a) Mean tumor growth (n=9), (b) tumor sizes (n=9) and (c) tumor weights on day 15 (WT n=15, Pglyrp1−/− n= 13) are shown. (d-k) TILs were harvested from mice bearing MC38-OVA tumors. (d) Representative flow cytometry data and summary plots of the frequency of Treg cells (CD45+ TCRβ+ CD4+ FOXP3+) (WT n=10, Pglyrp1−/− n= 7). (e) Representative flow cytometry data and summary plots of the frequency of indicated cytokines in CD8+ T cells (WT n=10, Pglyrp1−/− n= 8), TNF (WT n=10, Pglyrp1−/− n= 11). (f,g) Representative flow cytometry data and summary plots of the frequency of PD-1+ and TIM-3+ (f) and PD-1+ TIM-3+ double-positive (g) CD8+ T cells (WT n=10, Pglyrp1−/− n= 8). (h) Volcano plot of differentially expressed genes comparing WT vs. Pglyrp1−/− CD8+ T cells (n=4). Differential genes were computed as FDR < 0.15, |log2 fold change| > 1. Positive log2 fold change corresponds to upregulation in Pglyrp1−/− CD8+ T cells and vice versa. -log10 p-values were capped within [0, 6] for visualization purposes. The dots matching the gene names are highlighted in yellow. P-values were computed with likelihood ratio tests in edgeR, then adjusted for multiple comparisons using the Benjamini & Hochberg method (FDR). (i) Heatmap of selected differentially expressed genes (columns; FDR < 0.15, |log2 fold change| > 1) comparing WT vs. Pglyrp1−/− CD8+ T cells (n=4; rows). The color represents the sample-wise z-normalized expression level. (j,k) Gene set enrichment analysis of selected Gene Ontology (GO) terms (j) and published CD8+ T cell signatures (k) enriched in Pglyrp1−/− vs. WT CD8+ T cells. Wherry exhaustion ; effector vs. memory, exhausted vs. memory ; effector vs. memory LCMV, effector vs. exhausted ; effector memory vs. naïve ; human exhaustion . P-values were computed with the empirical phenotype-based permutation tests (GSEA) and the values shown in the figures were not adjusted for multiple comparisons. In (a,d-g) data are presented as the mean with ± SEM. In (b,c) data are presented as the mean. Unpaired two-tailed t-tests were performed. *, P <0.05; **, P <0.01.
Fig. 3:
Fig. 3:. ScRNA-seq of tumor-infiltrating T cells in Pglyrp1-deficient mice
(a) UMAP of tumor-infiltrating T cells (1,820 cells) in Pglyrp1−/− and WT mice. (b) Violin plot (top) and dot plot (bottom) depicting the expression of Pglyrp1 in WT T cell clusters. P-values were computed using Wilcoxon rank-sum tests and not adjusted for multiple comparisons. (c) Differentially expressed genes (FDR < 0.05 and |log2 fold change| > 0.25; p-values computed with the empirical Bayes quasi-likelihood F-tests in edgeR, then adjusted for multiple comparisons using the Benjamini & Hochberg method (FDR)) (top) and the distance (bottom, Methods) between Pglyrp1−/− and WT cells. (d) Genotype-specific composition of the T cell clusters. Relative frequencies (left) and log2 odds ratios and Bonferroni adjusted p-values of two-sided chi-square tests comparing Pglyrp1−/− vs. WT (right) are shown. A positive log2 odds ratio corresponds to a higher relative frequency in Pglyrp1−/− cells and vice versa. CD8+ T cell includes both CD8+ T cell clusters. (e) UMAP by genotype of tumor-infiltrating T single cells. (f) Volcano plot of differentially expressed genes (FDR < 0.05 and |log2 fold change| > 0.25) in the stem-like CD8+ T cell cluster. Log2 fold changes and -log10 p-values were capped within [−1.5, 1.5] and [0, 20] respectively for visualization purposes. P-values were computed with the empirical Bayes quasi-likelihood F-tests in edgeR, then adjusted for multiple comparisons using the Benjamini & Hochberg method (FDR). (g) Gene set enrichment analysis of selected Gene Ontology (GO) terms and KEGG and Reactome pathways (left) and published CD8+ T cell signatures (right) enriched in the CD8+ T cell-1 cluster. IL-27 signature ; exhaustion (Supplementary Table 7); terminally exhausted ; exhaustion CD8 T cells ; transitory vs. stem-like , self-renewing ; progenitor exhausted ; RNA processing . P-values computed with empirical phenotype-based permutation tests (GSEA) and not adjusted for multiple comparisons. (h,i) MC38-OVA tumors were implanted into WT and E8iCrePglyrp1fl/fl mice (n=7). (h) Mean tumor growth is shown. (i) Summary plots of the frequency of CD8+ T cells, PD-1+, and TIGIT+ CD8+ T cells by flow cytometry (n=6–7). In (h,i) data are presented as the mean with ± SEM. Unpaired two-tailed t-tests were performed. *, P <0.05.
Fig. 4:
Fig. 4:. Pglyrp1 deficiency results in protection from EAE
(a,b,c) EAE was induced by CFA/MOG in WT and Pglyrp1−/− mice (n=13–14). The mean clinical score (a), the disease course summary table (b), and the mean clinical score (n=8–14; mean ± standard deviation was shown for each statistic) (c) are shown (WT n=14, Pglyrp1−/− n=8). Data are merged from two independent experiments. (d,e) On day 24 after immunization, histology was performed of the CNS parenchyma and meninges (d) and the optic nerve (e) (WT n=9, Pglyrp1−/− n=8). WM: white matter, GM: grey matter. Gr L: granular layer. (f,g) On day 18 after immunization, CNS-infiltrating lymphocytes were extracted and the number of different immune populations (f) and the expression of intracellular cytokines in CD4+ T cells (g) were analyzed by flow cytometry (n=5). In (a,c,f,g) data are presented as the mean with ± SEM. Unpaired two-tailed t-tests were performed. *, P <0.05; **, P <0.01; ****, P <0.0001.
Fig. 5:
Fig. 5:. Pglyrp1 expression in myeloid cells contributes to EAE disease
(a,b,c) EAE was induced by CFA/MOG. The mean clinical score of EAE in E8iCre Pglyrp1fl/fl (n=10) and WT littermate controls (n=15) (a), in Cd4Cre Pglyrp1fl/fl (n=8) and WT littermate controls (n=10) (b), and in LysMCre Pglyrp1fl/fl (n=15) and WT littermate controls (n=16) (c) are shown. In the LysMCre experiment data are merged from two independent experiments. (d) Bar plot depicting the mean clinical score on day 23 of EAE in LysMCre Pglyrp1fl/fl and WT littermate controls (n=15). (e) Concentration of IL-6 in the blood of EAE mice at peak of disease (day 15) by legendplex (n=4). (f) MHC2 expression on different myeloid cell populations in the CNS in EAE mice at disease onset (day 10) by flow cytometry (WT n=9, LysMCre Pglyrp1fl/fl n=7). (g) Phenotypic characterization of T cells in the dLN in EAE mice at disease onset (day 10) by flow cytometry (n=7–8). (i) Cytokine concentration in the culture medium during recall assay, measured by legendplex (n=7, WT control n=9). In all plots data are presented as the mean with ± SEM. Unpaired two-tailed t-tests were performed. *, P <0.05; **, P <0.01; ****, P <0.0001.
Fig. 6:
Fig. 6:. ScRNA-seq reveals changes in monocytes and neutrophils in Pglyrp1-deficient mice during EAE
(a) Expression of Pglyrp1 in immune populations in the dLNs at EAE onset (day 10) by qPCR (n=5). nCD4= naïve CD4+ T cells, aCD4= activated CD4+ T cells, nCD8= naïve CD8+ T cells, aCD8= activated CD8+ T cells. Data are presented as the mean with + SEM. Unpaired two-tailed t-tests were performed. *, P <0.05; **, P <0.01; ***, P <0.001; ****, P <0.0001. (b) UMAP of CNS-infiltrating myeloid cells (3,698 cells). EAE was induced in Pglyrp1−/− and WT littermate controls and CNS-infiltrating myeloid cells were sorted (CD45+ CD3 CD19) for scRNA-seq at disease onset (day 10). (c) Heatmap representing cluster-specific upregulated genes (FDR <0.05, log2 fold change > log2(1.5)). If more than 20 genes met the cut-off criteria in a cluster, plotted the top 20 genes with the largest fold changes (if a gene was ranked top 20 in multiple clusters, it is only shown once in the cluster block where it has the biggest fold change). (d) Bar plots comparing the distance (Methods) between Pglyrp1−/− and WT cells. (e) Volcano plot of differentially expressed genes comparing WT vs. Pglyrp1−/− cells in the mono/MAC and neutrophil clusters. Differential genes were computed as FDR < 0.05, |log2 fold change| > 0.25. Positive log2 fold change corresponds to upregulation in Pglyrp1−/− cells and vice versa. Log2 fold changes and -log10 p-values were capped within [−2.5, 2.5] and [0, 30] respectively for visualization purposes. The dots matching the gene names are highlighted in yellow. P-values were computed with the empirical Bayes quasi-likelihood F-tests in edgeR, then adjusted for multiple comparisons using the Benjamini & Hochberg method (FDR). (f) Gene set enrichment analysis of selected Gene Ontology (GO) terms and KEGG/Reactome pathways in WT vs. Pglyrp1−/− cells in the mono/MACS (left) and neutrophils (right). P-values were computed with the empirical phenotype-based permutation tests (GSEA) and the values shown in the figures were not adjusted for multiple comparisons.

References

    1. Ribas A, and Wolchok JD (2018). Cancer immunotherapy using checkpoint blockade. Science 359, 1350–1355. 10.1126/science.aar4060. - DOI - PMC - PubMed
    1. Pauken KE, Dougan M, Rose NR, Lichtman AH, and Sharpe AH (2019). Adverse Events Following Cancer Immunotherapy: Obstacles and Opportunities. Trends Immunol 40, 511–523. 10.1016/j.it.2019.04.002. - DOI - PMC - PubMed
    1. Schnell A, Bod L, Madi A, and Kuchroo VK (2020). The yin and yang of co-inhibitory receptors: toward anti-tumor immunity without autoimmunity. Cell Res 30, 285–299. 10.1038/s41422-020-0277-x. - DOI - PMC - PubMed
    1. Khan Z, Hammer C, Carroll J, Di Nucci F, Acosta SL, Maiya V, Bhangale T, Hunkapiller J, Mellman I, Albert ML, et al. (2021). Genetic variation associated with thyroid autoimmunity shapes the systemic immune response to PD-1 checkpoint blockade. Nat Commun 12, 3355. 10.1038/s41467-021-23661-4. - DOI - PMC - PubMed
    1. Dziarski R, and Gupta D (2006). The peptidoglycan recognition proteins (PGRPs). Genome Biol 7, 232. 10.1186/gb-2006-7-8-232. - DOI - PMC - PubMed

Methods-only references

    1. Jager A, Dardalhon V, Sobel RA, Bettelli E, and Kuchroo VK (2009). Th1, Th17, and Th9 effector cells induce experimental autoimmune encephalomyelitis with different pathological phenotypes. J Immunol 183, 7169–7177. 10.4049/jimmunol.0901906. - DOI - PMC - PubMed
    1. Schnell A, Huang L, Singer M, Singaraju A, Barilla RM, Regan BML, Bollhagen A, Thakore PI, Dionne D, Delorey TM, et al. (2021). Stem-like intestinal Th17 cells give rise to pathogenic effector T cells during autoimmunity. Cell 184, 6281–6298 e6223. 10.1016/j.cell.2021.11.018. - DOI - PMC - PubMed
    1. Satija R, Farrell JA, Gennert D, Schier AF, and Regev A (2015). Spatial reconstruction of single-cell gene expression data. Nat Biotechnol 33, 495–502. 10.1038/nbt.3192. - DOI - PMC - PubMed
    1. Picelli S, Faridani OR, Bjorklund AK, Winberg G, Sagasser S, and Sandberg R (2014). Full-length RNA-seq from single cells using Smart-seq2. Nat Protoc 9, 171–181. 10.1038/nprot.2014.006. - DOI - PubMed
    1. Li B, Gould J, Yang Y, Sarkizova S, Tabaka M, Ashenberg O, Rosen Y, Slyper M, Kowalczyk MS, Villani AC, et al. (2020). Cumulus provides cloud-based data analysis for large-scale single-cell and single-nucleus RNA-seq. Nat Methods 17, 793–798. 10.1038/s41592-020-0905-x. - DOI - PMC - PubMed