. 2023 Dec;10(35):e2305550.
doi: 10.1002/advs.202305550. Epub 2023 Oct 12.

A Ubiquitin-Dependent Switch on MEF2D Senses Pro-Metastatic Niche Signals to Facilitate Intrahepatic Metastasis of Liver Cancer

Affiliations

A Ubiquitin-Dependent Switch on MEF2D Senses Pro-Metastatic Niche Signals to Facilitate Intrahepatic Metastasis of Liver Cancer

Junyu Xiang et al. Adv Sci (Weinh). 2023 Dec.

Abstract

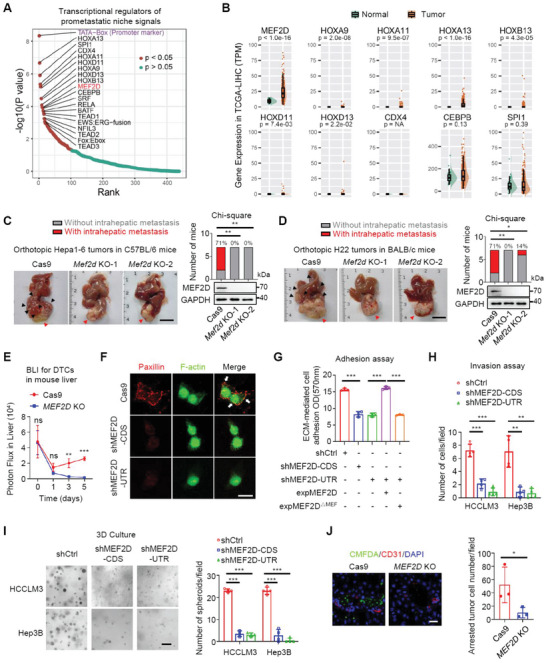
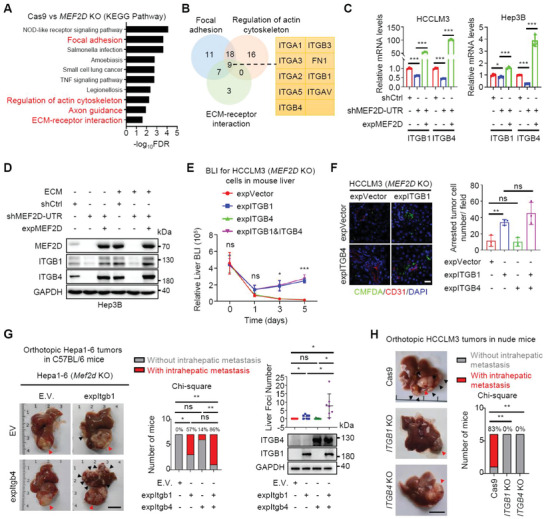
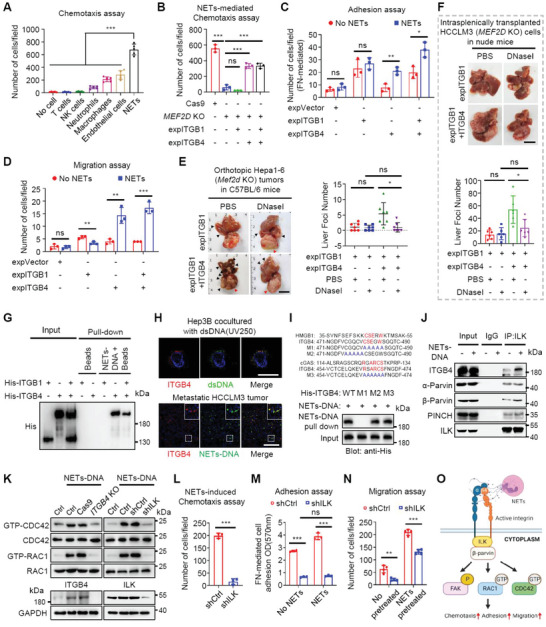
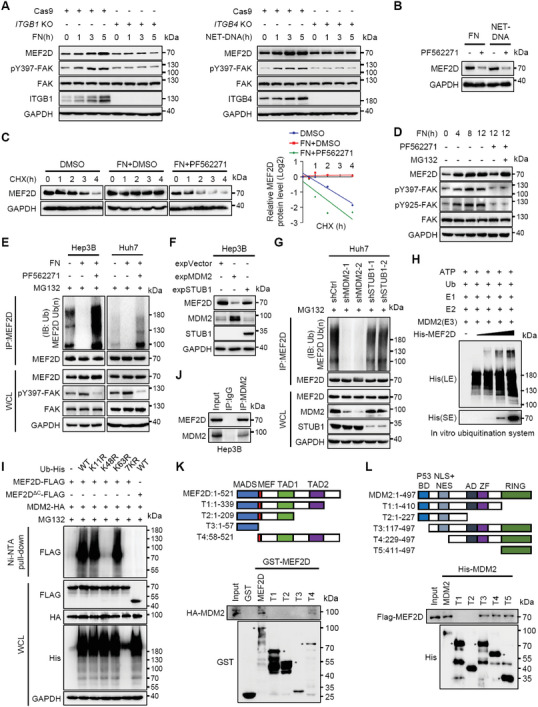
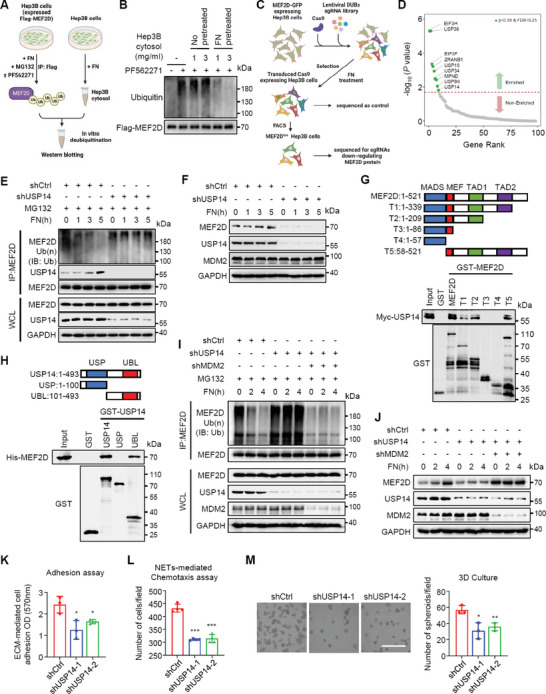
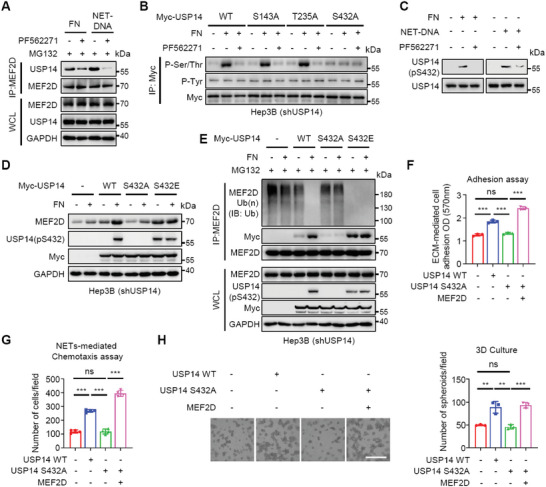
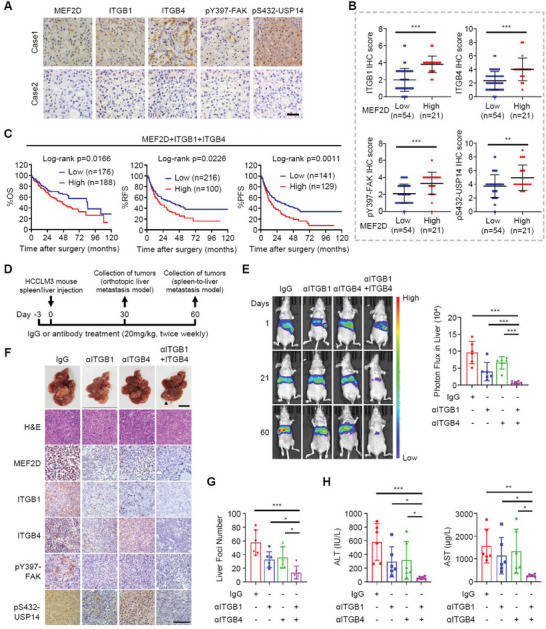
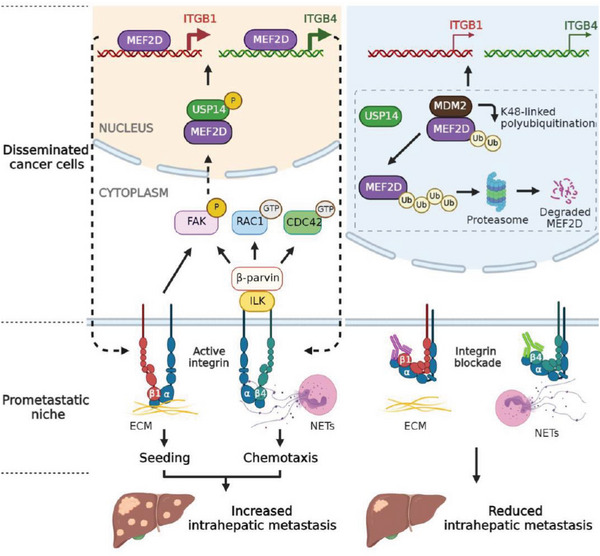
Effective treatment for metastasis, a leading cause of cancer-associated death, is still lacking. To seed on a distal organ, disseminated cancer cells (DCCs) must adapt to the local tissue microenvironment. However, it remains elusive how DCCs respond the pro-metastatic niche signals. Here, systemic motif-enrichment identified myocyte enhancer factor 2D (MEF2D) as a critical sensor of niche signals to regulate DCCs adhesion and colonization, leading to intrahepatic metastasis and recurrence of liver cancer. In this context, MEF2D transactivates Itgb1 (coding β1-integrin) and Itgb4 (coding β4-integrin) to execute temporally unique functions, where ITGB1 recognizes extracellular matrix for early seeding, and ITGB4 acts as a novel sensor of neutrophil extracellular traps-DNA (NETs-DNA) for subsequent chemotaxis and colonization. In turn, an integrin-FAK circuit promotes a phosphorylation-dependent USP14-orchastrated deubiquitination switch to stabilize MEF2D via circumventing degradation by the E3-ubiquitin-ligase MDM2. Clinically, the USP14(pS432)-MEF2D-ITGB1/4 feedback loop is often hyper-active and indicative of inferior outcomes in human malignancies, while its blockade abrogated intrahepatic metastasis of DCCs. Together, DCCs exploit a deubiquitination-dependent switch on MEF2D to integrate niche signals in the liver mesenchyme, thereby amplifying the pro-metastatic integrin-FAK signaling. Disruption of this feedback loop is clinically applicable with fast-track potential to block microenvironmental cues driving metastasis.

Keywords: MEF2D; disseminated cancer cells; integrin; neutrophil extracellular traps; pro-metastatic niche.


Conflict of interest statement

The authors declare no conflict of interest.

Figures

Figure 1
Figure 1
An unbiased screen identifies MEF2D as a core transcription factor integrating pro‐metastatic niche signals to promote intrahepatic metastasis of disseminated HCC cells. A) The top 20 TF motifs enriched at the promoter of signature genes among various pro‐metastatic niche signaling pathways. B) Differential expression of the top 10 enriched TFs in (A) between normal and tumor samples from TCGA‐LIHC project. C,D) Intrahepatic metastases generated by the orthotopically inoculated Mef2d‐depleted and control Hepa1‐6 cells in livers from syngeneic C57BL/6 mice (C), and H22 cells in livers from syngeneic BALB/c mice (D) (n = 7). Red arrow indicates primary tumor, while black arrow indicates metastases. Scale bars, 1 cm. The knockout efficiency of Mef2d in each line were analyzed by immunoblotting as shown in each panel. E) BLI at 0–5 days after splenic injection of Mef2d‐depleted and control HCCLM3 cells (n = 5‐6). F) Redistribution of focal adhesions and cytoskeletal remodelling in shMef2d and control Hep3B cells on the ECM were examined by double immunostaining for paxillin (red) and F‐actin (green). Yellow staining in merged images represents colocalization of paxillin with actin filaments. White arrows indicate focal adhesions. shMef2d‐CDS or shMef2d‐UTR are shRNAs targeting the CDS or UTR region of Mef2d mRNA, respectively. Scale bars, 20 µm. G) Crystal violet staining‐based quantification of cell adhesion assay using shMEF2D or control Hep3B cells, or Mef2d‐depleted cells transfected with wild‐type or a mutant MEF2D lacking MEF domain (MEF2D△MEF). H) Quantitation of invaded cells in an ECM‐coated transwell assay. I) 3D growth of wild‐type or MEF2D‐depleted cells in ECM. Scale bar, 200 µm. J) Intrahepatic seeding of wild‐type or Mef2d‐depleted HCCLM3 cells. CMFDA (green)‐labelled cells were injected into the spleen of mice for 48 h. Liver slices were stained for immunofluorescence with CD31 (red) (n = 3). Numbers of seeded cells were quantified from 10 random fields of each liver. Scale bars, 20 µm. All immunoblots are representative experiments of three independent replicates. For all panels, * p < 0.05, ** p < 0.01, *** p < 0.001, and ns, no significance.
Figure 2
Figure 2
ITGB1 and ITGB4 play distinct regulatory roles at early seeding and late colonization stages of MEF2D‐driven dissemination of DCCs in the liver. A) Kyoto Encyclopedia of Genes and Genomes (KEGG) enrichment analysis of downregulated pathways in Mef2d‐depleted cells compared to control cells. B) Venn diagram of differentially expressed genes (DEGs) in (A) that were associated with the pathways of focal adhesion, regulation of actin cytoskeleton, and ECM‐receptor interaction. C) qRT‐PCR analysis of Itgb1 and Itgb4 expression in control, Mef2d‐depleted, and shMef2d cells reconstituted with Mef2d (HCCLM3 or Hep3B). D) Immunoblot analysis of ITGB1 and ITGB4 levels in shMef2d and control Hep3B cells, and shMef2d cells reconstituted with Mef2d. Culture plates were coated with or without ECM. Panel is representative of three independent replicates. E) BLI at 0–5 days after splenic injection of Mef2d‐depleted HCCLM3 cells that were reconstituted with either Itgb1 or Itgb4, or both (n = 5‐6). F) Intrahepatic seeding of the indicated HCCLM3 cells as visualized by immunofluorescence staining. CMFDA (green)‐labelled cells were injected into the spleen and liver with seeding monitored 48 h later. Scale bars, 20 µm. G) Intrahepatic metastases of the orthotopically injected Mef2d‐depleted Hepa1‐6 cells that were ectopically expressing either Itgb1 or Itgb4, or both (n = 7). Red arrow, primary tumor; black arrow, metastases. Scale bars, 1 cm. The expression efficiency of Itgb1 and Itgb4 were analyzed by immunoblot. H) Intrahepatic metastases of the orthotopically injected Itgb1‐ or Itgb4‐depleted HCCLM3 cells in nude mice (n = 6). Red arrow, primary tumor; black arrow, metastases. Scale bars, 1 cm. All immunoblots are representative experiments of three independent replicates. For all panels, * p < 0.05, ** p < 0.01; *** p < 0.001, and ns, no significance.
Figure 3
Figure 3
ITGB4, a transcriptional target of MEF2D, recognizes NETs‐DNA to sustain metastatic colonization. A) Chemotaxis assays with Hepa1‐6 cells in the upper chambers and culture media and indicated murine cell components of the pro‐metastatic niche in the lower chambers of transwell assays. Tumor cells:other cells = 1:5. B) Chemotaxis assay with Mef2d‐depleted Hep3B cells reconstituted with either Itgb1, or Itgb4, or both, in the in upper chambers and NETs added to the culture media in the lower chambers. Tumor cells:NETs = 1:5. C,D) Adhesion (C) and migration (D) assays for various Mef2d‐depleted Hep3B cells stimulated with or without 5 µg mL−1 NETs. E) Intrahepatic metastases of the orthotopically injected Mef2d‐depleted Hepa1‐6 cells that were reconstituted with either Itgb1, or both Itgb1 and Itgb4 in C57BL/6 mice and subsequently treated with DNase I (5 mg k−1 g) (n = 7). Red arrow, primary tumor; black arrow, metastases; Scale bars, 1 cm. F) Representative images of liver metastases of Mef2d‐depleted HCCLM3 cells reconstituted with either Itgb1, or both Itgb1 and Itgb4. The cells were injected into spleens of nude mice and subsequently treated with DNase I. The numbers of liver metastases were counted (n = 6). Scale bar, 1 cm. G) Purified His‐tagged ITGB1 and/or His‐tagged ITGB4 proteins were incubated in the presence or absence of biotinylated NETs‐DNA. The bound proteins were immunoprecipitated with streptavidin microbeads and immunoblotted with an anti‐His antibody. H) Representative immunofluorescence images staining for ITGB4 and dsDNA or NETs‐DNA in Hep3B cocultured with dsDNA (top) or in metastatic HCCLM3 tumors (bottom). Yellow staining in merged images represents the areas of NETs‐DNA colocalization with ITGB4. Scale bars, 25 µm (top), 100 µm (bottom). I) Sequence alignment of the extracellular domain of ITGB4 with the DNA‐binding domains of two classical DNA sensors HMGB1 and cGAS. The interaction between His‐tagged full‐length ITGB4 (WT), the AA481‐485 mutant (M1), the AA476‐480 mutant (M2), or the AA464‐469 mutant (M3) with NETs‐DNA. NETs‐DNA was precipitated and immunoblotted using anti‐His antibody. J) Immunoblotting of ILK, β4‐integrin, α‐Parvin, β‐Parvin and PINCH in lysates (input) or anti‐ILK immunoprecipitates from Hep3B cells treated with or without NETs. IgG serves as an isotype control for IP assay. K) Hep3B cells were depleted of either ITGB4 or ILK, and then stimulated with or without NETs. GTP‐bound or total RAC1 and CDC42 levels were examined in the cell lysates. Ctrl, wild‐type cells without transfection. L) Chemotaxis assay for ILK‐depleted or control Hep3B cells in (K) in the upper chambers and NETs added to the culture media in the lower chambers of transwell assays. Tumor cells:NETs = 1:5. M,N) Adhesion (M) and migration (N) assays using ILK‐depleted or control Hep3B cells in (K) that were stimulated with or without 5 µg mL−1 NETs. O) A schematic model of ITGB4‐mediated recognition of NETs‐DNA and its downstream signalling pathways. All immunoprecipitation and immunoblots are representative experiments of three independent replicates. For all panels * p < 0.05, ** p < 0.01, *** p < 0.001, and ns, no significance.
Figure 4
Figure 4
Signals from the pro‐metastatic niche inhibit MDM2‐mediated ubiquitination and proteasomal degradation of MEF2D via an integrin‐FAK feedback loop. A) Immunoblot analysis of pY397‐FAK and MEF2D protein levels in ITGB1‐ or ITGB4‐depleted Hep3B cells that were treated with FN (bottom coated, 10 µg ml−1) or NETs‐DNA (5 µg ml−1), respectively, for the indicated times. B) Immunoblot analysis of MEF2D protein levels in Hep3B cells incubated with FN or NETs‐DNA in the presence or absence of the FAK inhibitor PF562271 (10 µM) for 12 h. C) Cycloheximide chase assay to measure the stability of MEF2D protein. Hep3B cells were pre‐treated with DMSO, FN, and FAK inhibitor PF562271 (10 µm) for 24 h, then incubated with 20 µg mL−1 cycloheximide and cell lysates collected at the indicated time points. D) Immunoblot analysis of FAK phosphorylation and MEF2D protein levels in Hep3B cells treated with FN for the indicated times, followed by incubation with PF562271 and MG132 (10 µm). E) MEF2D polyubiquitination and FAK phosphorylation in cells treated with MG132 in the presence or absence of FN and PF562271. F) Immunoblot of MEF2D protein levels in Hep3B cells expressing either MDM2 or STUB1. G) MEF2D polyubiquitination levels in MDM2‐ or STUB1‐depleted or control Huh7 cells. H) MEF2D polyubiquitination in an in vitro ubiquitination assay using purified His‐MEF2D protein. MDM2 was independently purified from 293T cells, and E1, E2 and ubiquitin (Ub) are recombinant proteins. I) Ni‐NTA pull‐down assay to measure MEF2D polyubiquitination levels in HEK293T cells transfected with Flag‐MEF2D or Flag‐MEF2DΔC (lacking AA 339–521), and HA‐MDM2 together with wild‐type (WT) ubiquitin or ubiquitin mutants containing K11R, K48R, K63R, or all lysine mutated to arginine (7KR). J) Co‐IP analysis of interaction of endogenous MEF2D and MDM2 in Hep3B cells. K) GST pull‐down analysis of the interaction between GST‐MEF2D deletion mutants and full‐length HA‐MDM2 in Hep3B cells. Schematic diagrams of MEF2D and its deletion constructs are shown. MADS, minichromosome maintenance 1 homolog, agamous, deficient, and serum response factor: TAD, transcriptional activation domain. * Marks the band corresponding to the indicated protein. L) His pull‐down analysis of His‐MDM2 deletion mutants and full‐length Flag‐MEF2D in Hep3B cells. Schematic diagrams of MDM2 and its deletion constructs are shown. BD, p53 binding domain; NES, nuclear export signal; AD, acidic domain; ZF, zinc finger. * Marks the band corresponding to the indicated protein. All immunoprecipitation and immunoblots are representative experiments of three independent replicates.
Figure 5
Figure 5
USP14 is activated by various pro‐metastatic niche signals to interact, deubiquitinate, and stabilize MEF2D, thereby promoting adhesion and chemotaxis of DCCs. A) Schematic representation of an in vitro deubiquitination assay. B) Ubiquitinated Flag‐MEF2D immunoprecipitated from Hep3B cells treated with FN (bottom coated, 10 µg mL−1), MG132 (10 µm), and FAK inhibitor PF562271 (10 µm). The purified Flag‐MEF2D protein was incubated with cytosolic fractions from Hep3B cells treated as indicated and analyzed by immunoblotting. C) CRISPR screening pipeline to identify DUBs for MEF2D in Hep3B cells expressing GFP‐tagged MEF2D, using a library of single‐guide RNAs (sgRNAs) targeting all DUBs in the human genome. D) Sequencing results from screen of sgRNAs targeting DUBs were sorted by the enrichment score based on the Log2 (fold change) ratio between MEF2Dlow and control cells. The significantly enriched genes (green plots) are highlighted. E) Co‐IP analysis of MEF2D polyubiquitination, and USP14‐MEF2D interaction, in USP14‐depleted and control Hep3B cells that were treated with FN for the indicated times. F) Immunoblot analysis of MEF2D protein levels in USP14‐depleted and control Hep3B cells cultured on FN‐coated plates for the indicated times. G,H) GST pull‐down analysis of GST‐MEF2D (G) or GST‐USP14 (H) deletion mutants that were incubated with lysates of FN‐treated Hep3B cells expressing Myc‐USP14 or His‐MEF2D, respectively. Schematic diagrams of wild‐type proteins and their deletion mutants are shown. I) MEF2D polyubiquitination levels in FN‐treated Hep3B cells that were USP14‐depleted, or USP14‐ and MDM2 double depleted. J) MEF2D protein levels were detected by immunoblotting. K) Crystal violet staining‐based quantification of USP14‐depleted and control Hep3B cells adhered to ECM. L) Chemotaxis assay for USP14‐depleted and control Hep3B cells add to the upper chambers and NETs added to the culture media in the lower chambers of transwell assay. Tumor cells:NETs = 1:5. M) 3D growth of USP14‐depleted and control Hep3B cells in ECM. Scale bars, 10 µm. All immunoprecipitation and immunoblots are representative experiments of three independent replicates. For all panels, * p < 0.05, ** p < 0.01, *** p < 0.001.
Figure 6
Figure 6
Integrin‐FAK signalling‐mediated USP14‐S432 phosphorylation triggers USP14 interaction with MEF2D, acting as a molecular switch to upregulate MEF2D and generate pro‐metastatic feedback signaling loop. A) Co‐IP analysis of MEF2D with USP14 in FN or NETs‐DNA‐treated Hep3B cells that were further incubated in the presence or absence of the FAK inhibitor PF562271 (10 µM). B) IP analysis of pSer/Thr residues in wild‐type (WT) or mutant USP14 proteins (S143A, T235A and S432A) purified from Hep3B cells that were treated with FN alone or together with PF562271. C) IP analysis of pS432 levels in endogenous USP14 proteins purified from Hep3B cells treated with FN or NETs‐DNA, together with PF562271. D) Immunoblot analysis of MEF2D protein and its pS432 levels in USP14‐depleted Hep3B cells expressing WT‐USP14 or USP14 mutants (S432A and S432E) proteins that were treated with or without FN. E) Co‐IP analysis of MEF2D polyubiquitination levels and UPS14 interaction with MEF2D in USP14‐depleted Hep3B cells expressing WT‐USP14 or USP14 mutants that were treated with or without FN. F,G) Analysis of ECM‐mediated adhesion (F) or NETs‐induced chemotaxis (G) of USP14‐depleted Hep3B cells expressing WT‐USP14 or USP14 S432A mutants that were rescued with ectopic expression of Mef2d. Tumor cells:NETs = 1:5. H) 3D growth of USP14‐depleted Hep3B cells reconstituted with indicated USP14 in ECM. Scale bars, 10 µm. All immunoprecipitation and immunoblots are representative experiments of three independent replicates. For all panels, ** p < 0.01, *** p < 0.001, and ns, no significance.
Figure 7
Figure 7
Combined targeting both ITGB1 and ITGB4 inhibits pUSP14‐MEF2D‐ITGB1/4 signaling and intrahepatic metastasis of disseminated HCC cells. A,B) IHC staining (A) of MEF2D, ITGB1, ITGB4, pY397‐FAK or pS432‐USP14 and quantitative analysis of their staining scores (B) in HCC tissues from 75 patients (Cohort II). Representative IHC images from two samples are shown. Scale bar: 50 µm. C) HCC patients were stratified for Kaplan‐Meier analysis of overall survival (OS), relapse‐free survival (RFS) and progression‐free survival (PFS) according to the co‐expression levels of MEF2D, ITGB1 and ITGB4 in tumour tissues using data from the TCGA dataset. D) Schematic of anti‐ITGB1, anti‐ITGB4, or combination treatment strategy of mice implanted with HCCLM3 cells through splenic or intrahepatic injection (n = 6). E) BLI at 1, 21, and 60 days post splenic injection of HCCLM3 cells. F) Livers resected from the spleen‐to‐liver metastasis mouse model. Tissues were photographed, fixed, and stained with haematoxylin and eosin (H&E), or immunostained for the levels of MEF2D, ITGB1, ITGB4, pY397‐FAK, and pS432‐USP14 as indicated (n = 6). Black arrow, liver metastases. Scale bar, 1 cm (top), 100 µm (bottom). G‐H) Liver metastases were counted (G) and plasma ALT and AST levels were measured (H) for mice. For all panels, * p < 0.05, ** p < 0.01, *** p < 0.001, and ns, no significance.
Figure 8
Figure 8
Schematic summary of the main findings in this study.

Similar articles

Cited by

References

    1. Celià‐Terrassa T., Kang Y., Nat. Cell Biol. 2018, 20, 868. - PubMed
    1. Gong Z., Li Q., Shi J., Wei J., Li P., Chang C.‐H., Shultz L. D., Ren G., Immunity 2022, 55, 1483. - PMC - PubMed
    1. Fane M. E., Chhabra Y., Alicea G. M., Maranto D. A., Douglass S. M., Webster M. R., Rebecca V. W., Marino G. E., Almeida F., Ecker B. L., Zabransky D. J., Hüser L., Beer T., Tang H.‐Y., Kossenkov A., Herlyn M., Speicher D. W., Xu W., Xu X., Jaffee E. M., Aguirre‐Ghiso J. A., Weeraratna A. T., Nature 2022, 606, 396. - PMC - PubMed
    1. Lee J. W., Stone M. L., Porrett P. M., Thomas S. K., Komar C. A., Li J. H., Delman D., Graham K., Gladney W. L., Hua X., Black T. A., Chien A. L., Majmundar K. S., Thompson J. C., Yee S. S., O'Hara M. H., Aggarwal C., Xin D., Shaked A., Gao M., Liu D., Borad M. J., Ramanathan R. K., Carpenter E. L., Ji A., de Beer M. C., de Beer F. C., Webb N. R., Beatty G. L., Nature 2019, 567, 249. - PMC - PubMed
    1. Esposito M., Mondal N., Greco T. M., Wei Y., Spadazzi C., Lin S.‐C., Zheng H., Cheung C., Magnani J. L., Lin S.‐H., Cristea I. M., Sackstein R., Kang Y., Nat. Cell Biol. 2019, 21, 627. - PMC - PubMed

Publication types