. 2024 Feb;20(2):954-974.
doi: 10.1002/alz.13502. Epub 2023 Oct 12.

Alzheimer's disease-induced phagocytic microglia express a specific profile of coding and non-coding RNAs

Affiliations

Alzheimer's disease-induced phagocytic microglia express a specific profile of coding and non-coding RNAs

Flavia Scoyni et al. Alzheimers Dement. 2024 Feb.

Abstract

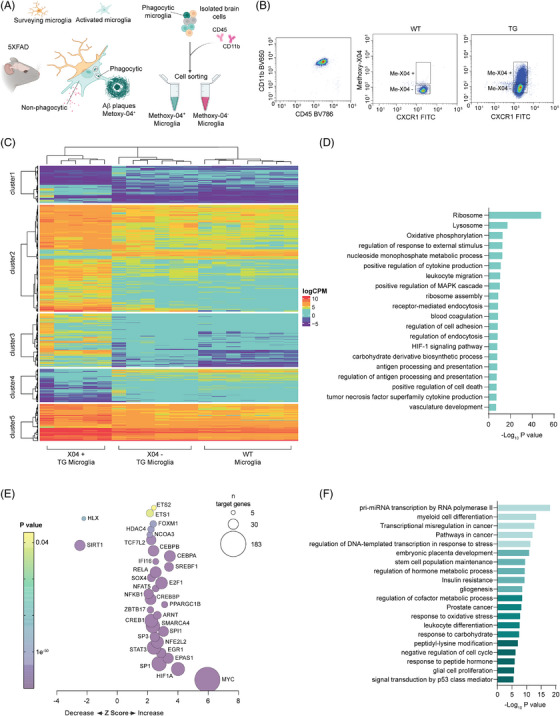
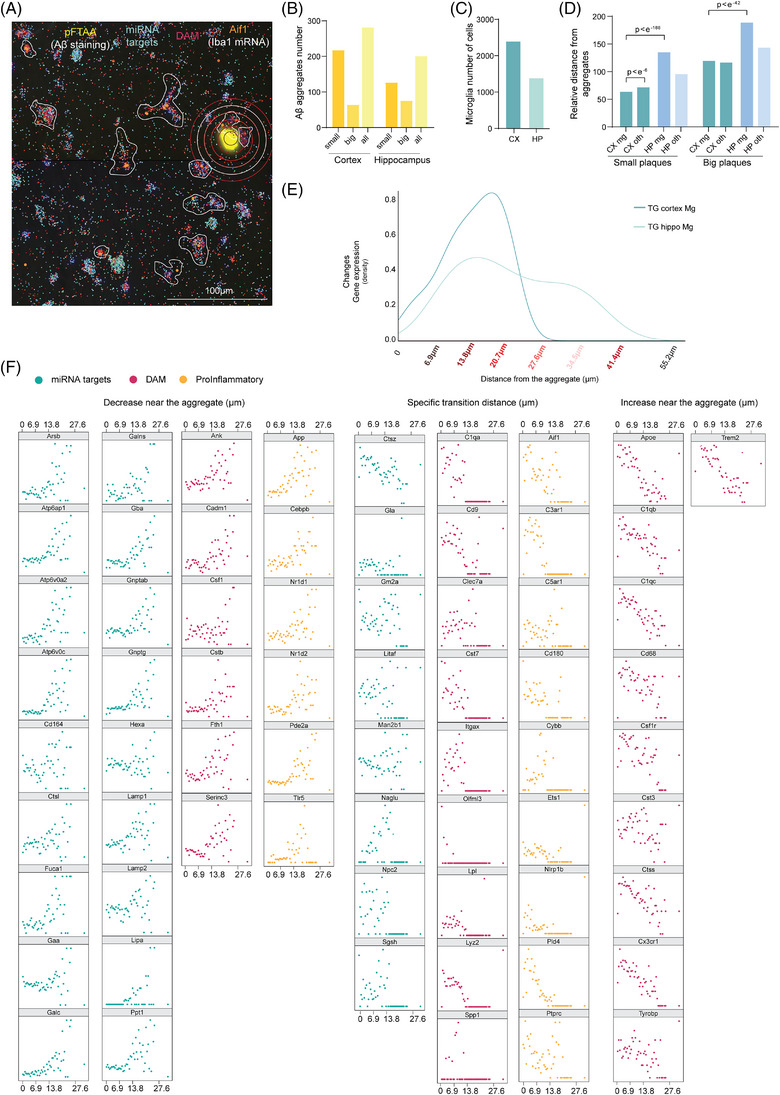
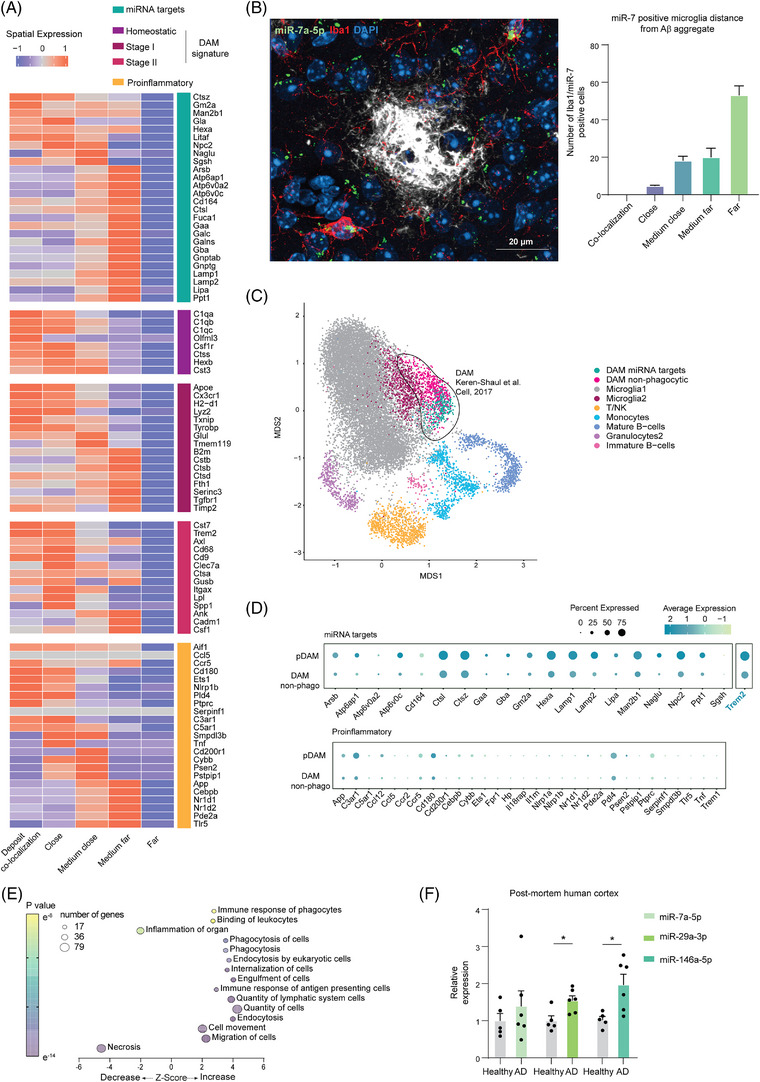
Introduction: Alzheimer's disease (AD) is a neurodegenerative disease and the main cause of dementia in the elderly. AD pathology is characterized by accumulation of microglia around the beta-amyloid (Aβ) plaques which assumes disease-specific transcriptional signatures, as for the disease-associated microglia (DAM). However, the regulators of microglial phagocytosis are still unknown.

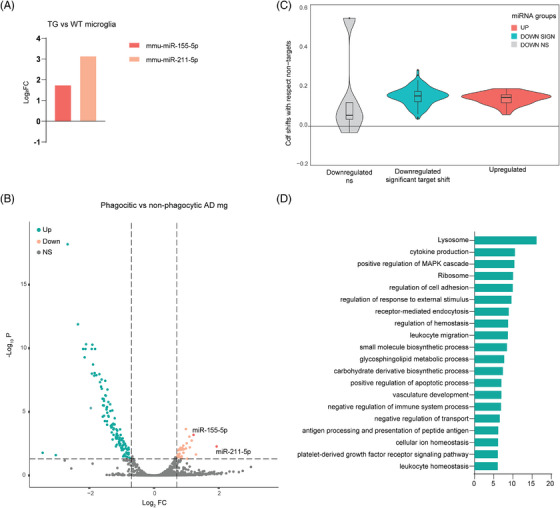
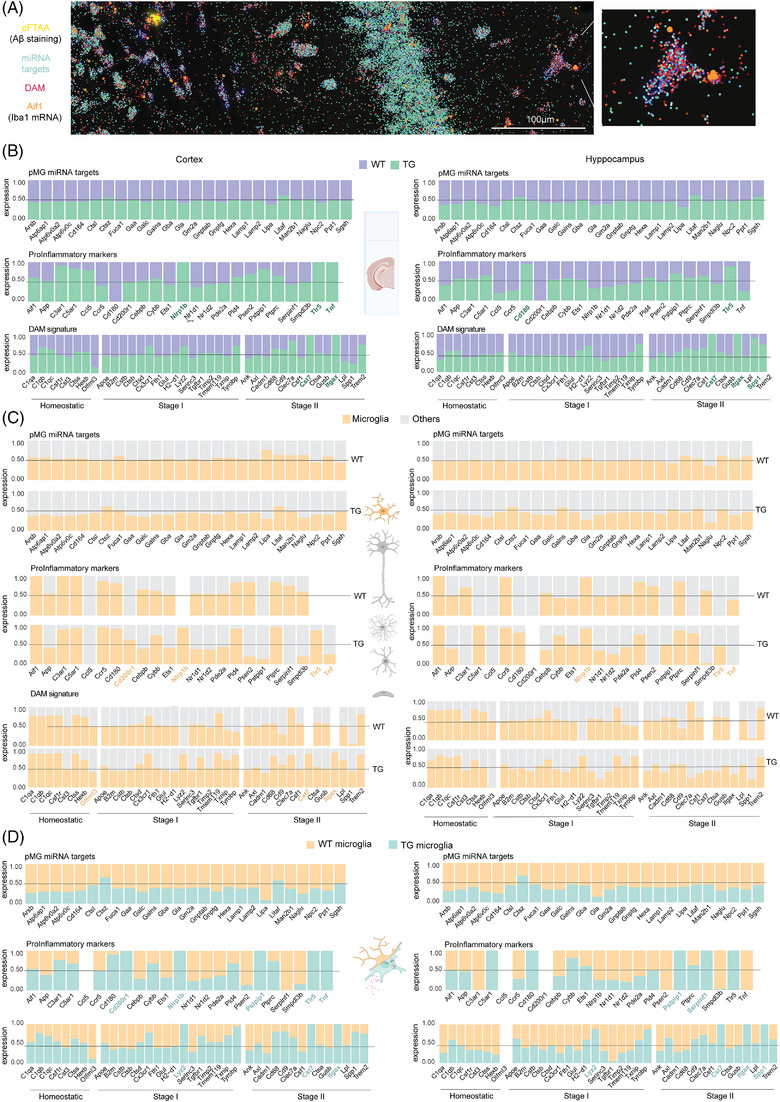
Methods: We isolated Aβ-laden microglia from the brain of 5xFAD mice for RNA sequencing to characterize the transcriptional signature in phagocytic microglia and to identify the key non-coding RNAs capable of regulating microglial phagocytosis. Through spatial sequencing, we show the transcriptional changes of microglia in the AD mouse brain in relation to Aβ proximity.

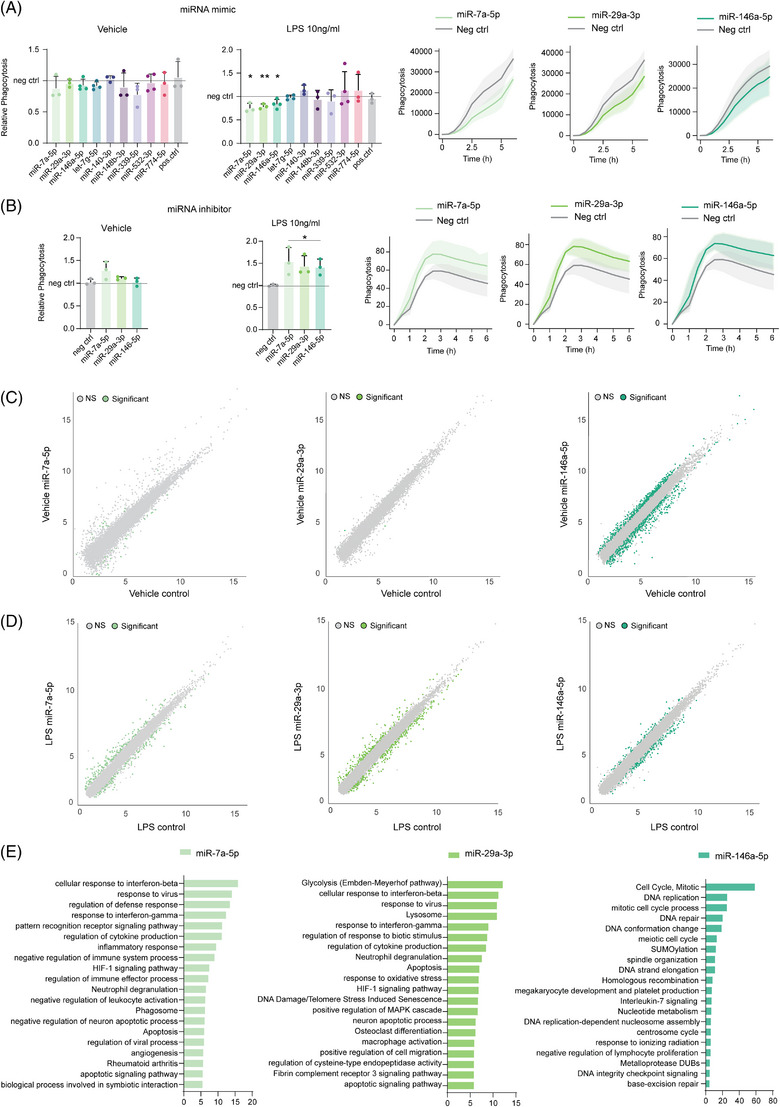
Results: Finally, we show that phagocytic messenger RNAs are regulated by miR-7a-5p, miR-29a-3p and miR-146a-5p microRNAs and segregate the DAM population into phagocytic and non-phagocytic states.

Discussion: Our study pinpoints key regulators of microglial Aβ clearing capacity suggesting new targets for future therapeutic approaches.

Keywords: Alzheimer's disease; microRNAs; microglia; phagocytosis; post-transcriptional regulation.


Conflict of interest statement

The authors declare no conflicts of interest. Author disclosures are available in the supporting information.

Figures

FIGURE 1
FIGURE 1
Phagocytic microglial activation primes changes in gene expression in Alzheimer's mice. (A) Schematic representation of the experimental design. Six‐month old Alzheimer's disease (AD) 5xFAD mice were injected with permeable amyloid deposit staining fluorescent probe Methoxy‐X04 (Me‐X04) before microglia fluorescent activated cell sorting (FACS) cell sorting with Cd11b and Cd45 markers. Phagocytic microglia (Me‐X04 positive) were separated by non‐phagocytic (Me‐X04 negative) and sequenced to detect differential expression of transcripts. (B) Representative plot of FACS sorting of 10.000 events of the microglia double positive population (Cd11b, Cd45) divided for Me‐X04 positivity. (C) Heat map of logCPM of detected transcripts between murine Alzheimer's phagocytic microglia ( TG Me‐X04+), Alzheimer's non‐phagocytic (TG Me‐X04) and wild‐type (WT) (n = 6 TG and 7 WT animals as biological replicates, hierarchal clustering performed using Ward's least absolute error with Manhattan distance). (D) Bar plot of functional enrichment analysis top 20 significant Metascape clusters performed on differentially expressed transcripts in phagocytic versus non‐phagocytic AD microglia. (E) Bubble plot of Ingenuity pathway analysis (IPA) of upstream regulators (transcription factors) based on differentially expressed genes between phagocytic versus non‐phagocytic AD microglia obtained through RNA‐seq. Z‐score indicates IPA prediction of pathway activation (positive value) or inhibition (negative value) in phagocytic microglia. Color bar expresses p‐value significancy (yellow to purple), size expresses the number of genes contained in the pathway (|z | > 2 is considered significant, pathway containing > 10 genes were included). (F) Bar plot of functional enrichment analysis top 20 significant Metascape clusters performed on differentially expressed transcription factors in phagocytic AD versus non‐phagocytic microglia.
FIGURE 2
FIGURE 2
MicroRNAs (miRNAs) are involved in the Alzheimer's induced microglia phagocytic phenotype. (A) Bar plot of log2FC of the only two differentially expressed miRNAs in Alzheimer's disease (AD) non‐phagocytic microglia versus wild‐type (WT) microglia mmu‐miR‐155‐5p (dark orange) and mmu‐miR‐211‐5p (light orange) obtained from RNA‐seq of 5xFAD fluorescent activated cell sorting (FACS) sorted microglia (n = 6 transgenic [TG] and 7 WT animals as biological replicates; FDR < 0.01 and |log2FC | > 1). (B) Volcano plot of differentially expressed miRNAs in AD phagocytic versus non‐phagocytic microglia. Highlighted significantly upregulated (light orange) and downregulated (green) miRNAs, miRNAs upregulated in non‐phagocytic AD microglia versus WT (dark orange) (n = 6 TG animals as biological replicates; FDR < 0.01 and |log2FC | > 1). (C) Violin plot of the shifts in expression of miRNA targets where each one measures how much the cumulative distribution function of an miRNA's differentially expressed targets separates from the function of the non‐targets. The shifts have been categorized based on the type of miRNA regulation (non/significant and up/downregulated). Each miRNA CDF curve is obtained with the single specific miRNA targets against all the non‐targets (n = 6 TG animals as biological replicates; p‐value calculated with Kolmogorov‐Smirnov test). (D) Bar plot of functional enrichment analysis top 20 significant Metascape clusters performed on differentially expressed miRWalk targets of the significantly differentially expressed miRNAs in AD phagocytic versus non‐phagocytic microglia.
FIGURE 3
FIGURE 3
MicroRNAs (miRNAs) affect phagocytosis and microglia fitness in vitro. (A) (left) Live imaging phagocytic assay at 6 h timepoint of BV‐2 cells overexpressing single miRNAs in respect of scramble control (gray line) treated with lipopolysaccharide (LPS) 10 ng/ml for 24 h or vehicle media. (right) Time point data of live imaging phagocytic assay of BV‐2 cells treated with LPS 10 ng/ml for 24 h and overexpressing single miRNAs (green) in respect of scramble control (gray). Data are calculated as a relative fluorescence after background subtraction and normalized on confluency and shown as mean ± SD (n = 3 or 4 independent experiments as shown by the single data point; * = p‐value < 0.05, ** = p‐value < 0.01 calculated with two tailed Student t‐test). (B) (left) Live imaging phagocytic assay at 6 h timepoint of BV‐2 cells treated with miRNA inhibitors in respect of scramble inhibitor (gray line) treated with LPS 10 ng/ml for 24 h or vehicle media. (right) Time point data of live imaging phagocytic assay of BV‐2 cells treated with LPS 10 ng/ml for 24 h and miRNA inhibitors of single miRNAs (green) in respect of scramble inhibitor (gray). Data are calculated as a relative fluorescence after background subtraction and normalized on confluency and shown as mean ± SD (n = 3 or 4 independent experiments as shown by the single data point; * = p‐value < 0.05, ** = p‐value < 0.01 calculated with two tailed Student t‐test). (C) Scatter plot of differentially expressed genes in BV‐2 cells overexpressing miR‐7a‐5p (light green), miR‐29a‐3p (medium green), miR‐146a‐5p (dark green) in respect of scramble negative control (gray) transfected cells (n = 4 independent experiments; adj.p‐value < 0.05 and|log2FC | > 0.3). (D) Scatter plot of differentially expressed genes in BV‐2 cells treated with LPS for 24 h and overexpressing miR‐7a‐5p (light green), miR‐29a‐3p (medium green), miR‐146a‐5p (dark green) in respect of LPS treated scramble negative control transfected cells (n = 4 independent experiments; adj.p‐value < 0.05 and|log2FC | > 0.3). (E) Bar plot of functional enrichment analysis top 20 significant Metascape clusters performed on differentially expressed genes in LPS treated BV‐2 cells for 24 h overexpressing miR‐7a‐5p (light green), miR‐29a‐3p (medium green), miR‐146a‐5p (dark green) in respect of LPS treated scramble negative control transfected cells (n = 4 independent experiments).
FIGURE 4
FIGURE 4
Spatial analysis of microRNA (miRNA) phagocytic targets and disease‐associated microglia (DAM) and pro‐inflammatory signature. (A) Representative image of spatial sequencing of 5xFAD brain slices. In yellow, the staining of Aβ aggregates with pFTAA; shades of red represent the selected list of DAM genes; and in shades of blue, the miRWalk targets involved in phagocytosis. In orange, Aif1 (Iba1 coding gene) expression identifying microglia cells representatively outlined in the zoom. (B) Stacked bar plot with the average expression of miRWalk, DAM, and pro‐inflammatory genes (Supplementary Table S2) overall in 5XFAD Alzheimer's disease (AD) slices (green) with respect to wild‐type (WT) animals (purple) in cortex (left) and hippocampi (right) obtained from the spatial sequencing analysis. In green, the genes markers discussed (n = 2 WT and 3 transgenic [TG] animals as biological replicates). (C) Stacked bar plot with the average expression of miRWalk, DAM and pro‐inflammatory gene lists (Supplementary Table S2) in microglial cells (yellow, Aif1 positive cells) in respect of all the other cell types (gray, Aif1 negative) in cortex (left) and hippocampi (right) obtained from the spatial sequencing analysis. In yellow, the genes markers discussed (n = 2 WT and 3 TG animals as biological replicates). (D) Stacked bar plot with the average expression of miRWalk, DAM, and pro‐inflammatory gene lists (Supplementary table S2) in microglial Aif1 positive Alzheimer's disease cells (blue) in respect of WT microglia (yellow) in cortex (left) and hippocampi (right) obtained from the spatial sequencing analysis. In blue, the genes markers discussed (n = 2 WT and 3 TG animals as biological replicates).
FIGURE 5
FIGURE 5
The expression of phagocytic microRNA (miRNA) targets is dynamically induced in microglia near the beta‐amyloid deposits. (A) Representative image of spatial sequencing of 5xFAD brain slices. In yellow, the staining of Aβ deposits with pFTAA; shades of red represent the selected list of disease‐associated microglia (DAM) genes; and in shades of blue, the miRWalk targets involved in phagocytosis. In orange, Aif1 (Iba1 coding gene) expression identifying microglia cells. Circles identify the distance of the Iba1 positive cells from the deposit utilized in the analysis. (B) Bar plot of the quantification of pFTAA positive Aβ deposits in cortex and hippocampi divided into small (5–40 μm in diameter) and big (> 40 μm in diameter) (n = 3). (C) Bar plot of the quantification of Aif1 positive cells (microglia) in cortex and hippocampi (n = 3). (D) Bar plot of the quantification of Aif1 positive (mg) or not (oth) distance from pFTAA positive Aβ deposits in cortex and hippocampi divided into small (5 to 40 μm in diameter) and big (>40 μm in diameter) (n = 3 transgenic [TG] animals as biological replicates; data showed as average and p‐value calculated with Wilcoxon rank sum test). (E) Distribution of gene expression changes, expressed as density, in respect of the distance from the deposit in μm in cortex and hippocampi. The higher the peak, the greater degree of gene expression changes occur at the specific distance. (F) Scatter plot of the expression of the specific gene belonging to miRWalk (blue), DAM (magenta) or pro‐inflammatory (yellow) gene lists in respect of the distance of the Aif1 positive cell (microglia) (n = 3 TG animals as biological replicates; data shown as normalized value between 0 and 1).
FIGURE 6
FIGURE 6
MicroRNAs (miRNAs) phagocytic targets identify a switch in microglial states in proximity of Aβ aggregates and segregate disease‐associated microglia (DAM) population. (A) Heat map of the row‐scaled average expression of the gene in a distance‐specific set of cells obtained through spatial sequencing. Gene lists were divided into miRWalk, DAM, and pro‐inflammatory (Supplementary Table S2) in microglial cells (Aif1 positive) categorized on the approximate distance from the Aβ aggregate: co‐localization (0 μm), close (0 to 9 μm), medium‐close (9 to 17 μm), medium‐far (17 to 27 μm), far (more than 27 μm) (n = 3 transgenic [TG] animals as biological replicates). (B) (left) Representative confocal image acquired with 40x objective of fluorescence in situ hybridization and immunohistochemistry of miR‐7 (green), Iba1 microglia marker (red), amyloid‐β (white), and DAPI (blue). Merge of miR‐7 and Iba1 (yellow) identify miR‐7‐positive microglia. (right) Quantification of 771 total miR‐7‐positive microglia distance from Aβ aggregates obtained from four transgenic animals with two sections from each animal. Data expressed as relative percentage of double positive miR‐7 and Iba1 microglia identified at specific distance from the aggregate (n = 4 biological replicate, n = 2 slice per biological replicate; data as mean ± standard deviation). (C) U‐map obtained by Keren‐Shaul et al. dataset (GSE98969) highlighting in green the re‐clustering of DAM subpopulation (circled in black) expressing miRWalk target genes (DAM miRWalk targets), and in magenta DAM not expressing it. In gray, homeostatic microglia (Microglia 1), purple Stage 1 DAM (Microglia2), other immune cell clusters as T‐cells and natural killer (yellow, T/NK), monocytes (cyan), mature B cells (darker blue), granulocytes (light purple), immature B‐cells (light pink). (D) Dot plot of the average expression of miRWalk targets in the identified DAM phagocytic subpopulation (pMG) and in the non‐phagocytic DAM sub‐clustering. Below, the expression of pro‐inflammatory genes in the same two DAM subpopulations. (E) Bubble plot of ingenuity pathway analysis of genes specific of the DAM pMG population based on differentially expressed genes in respect the other microglia clusters without the original DAM markers. Z‐score indicates IPA prediction of pathway activation (positive value) or inhibition (negative value) in phagocytic microglia. Color bar expresses p‐value significancy (yellow to purple), size expresses the number of genes contained in the pathway (|z | > 2 is considered significant, pathway containing > 10 genes were included). (F) Bar plot of microRNA expression measured by qPCR from post mortem human brain tissues (Supplementary Table S4). Data shown as relative expression of Alzheimer's disease (AD) patient in respect of non‐demented control (healthy) and shown as mean ± SD (n = 5 healthy and n = 6 AD patients as shown by the single data point; * = p‐value < 0.05 calculated with two‐tailed Student t‐test).

References

    1. Roth DTL, Mcgavern DB. Microglia development and function. Annu Rev Immunol. 2014;32:367‐402. - PMC - PubMed
    1. Colonna M, Butovsky O. Microglia function in the central nervous system during health and neurodegeneration. Annu Rev Immunol. 2017;35:441‐468. - PMC - PubMed
    1. Barker WW, Luis CA, Kashuba A, et al. Relative frequencies of Alzheimer disease, lewy body, vascular and frontotemporal dementia, and hippocampal sclerosis in the state of Florida brain bank. Alzheimer Dis Assoc Disord. 2002;16:203. - PubMed
    1. Selkoe DJ, Hardy J. The amyloid hypothesis of Alzheimer's disease at 25 years. EMBO Mol Med. 2016;8:595‐608. - PMC - PubMed
    1. Holtzman DM, Morris JC, Goate AM. Alzheimer's disease: the challenge of the second century. Sci Transl Med. 2011;3:77sr1. - PMC - PubMed

Publication types