. 2023 Aug;5(8):861-872.
doi: 10.1038/s42256-023-00694-6. Epub 2023 Jul 20.

Deep neural networks predict class I major histocompatibility complex epitope presentation and transfer learn neoepitope immunogenicity

Affiliations

Deep neural networks predict class I major histocompatibility complex epitope presentation and transfer learn neoepitope immunogenicity

Benjamin Alexander Albert et al. Nat Mach Intell. 2023 Aug.

Abstract

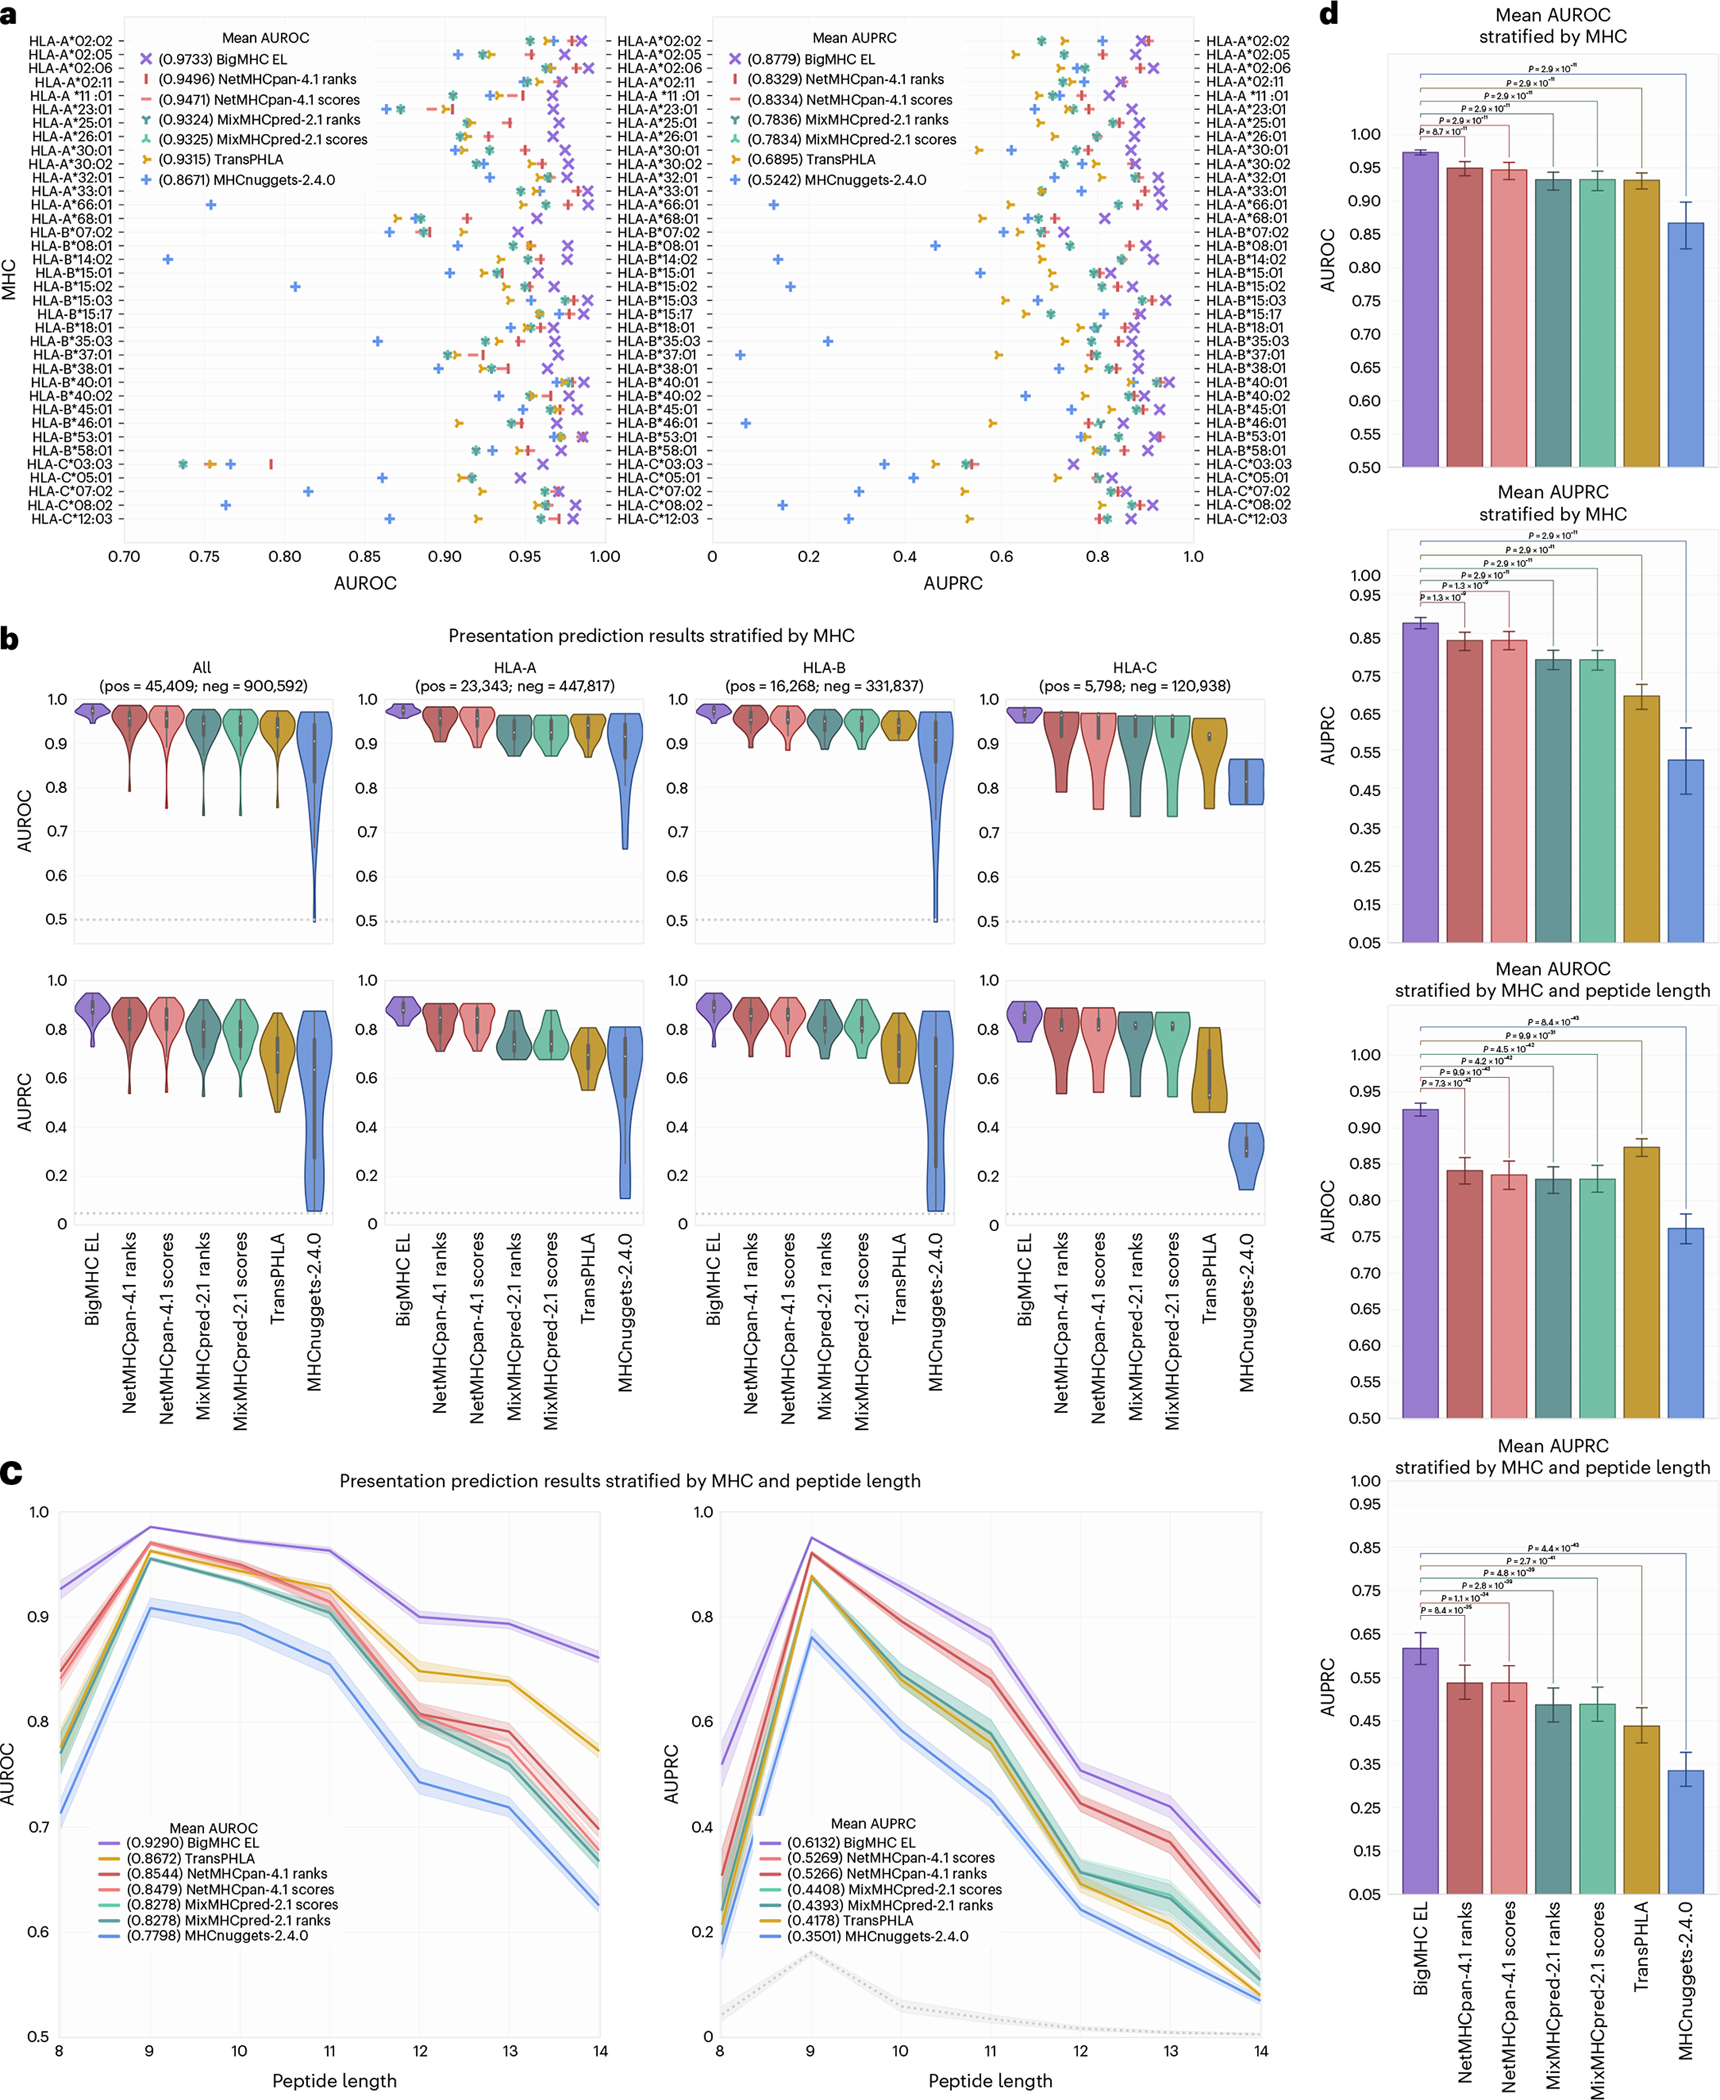
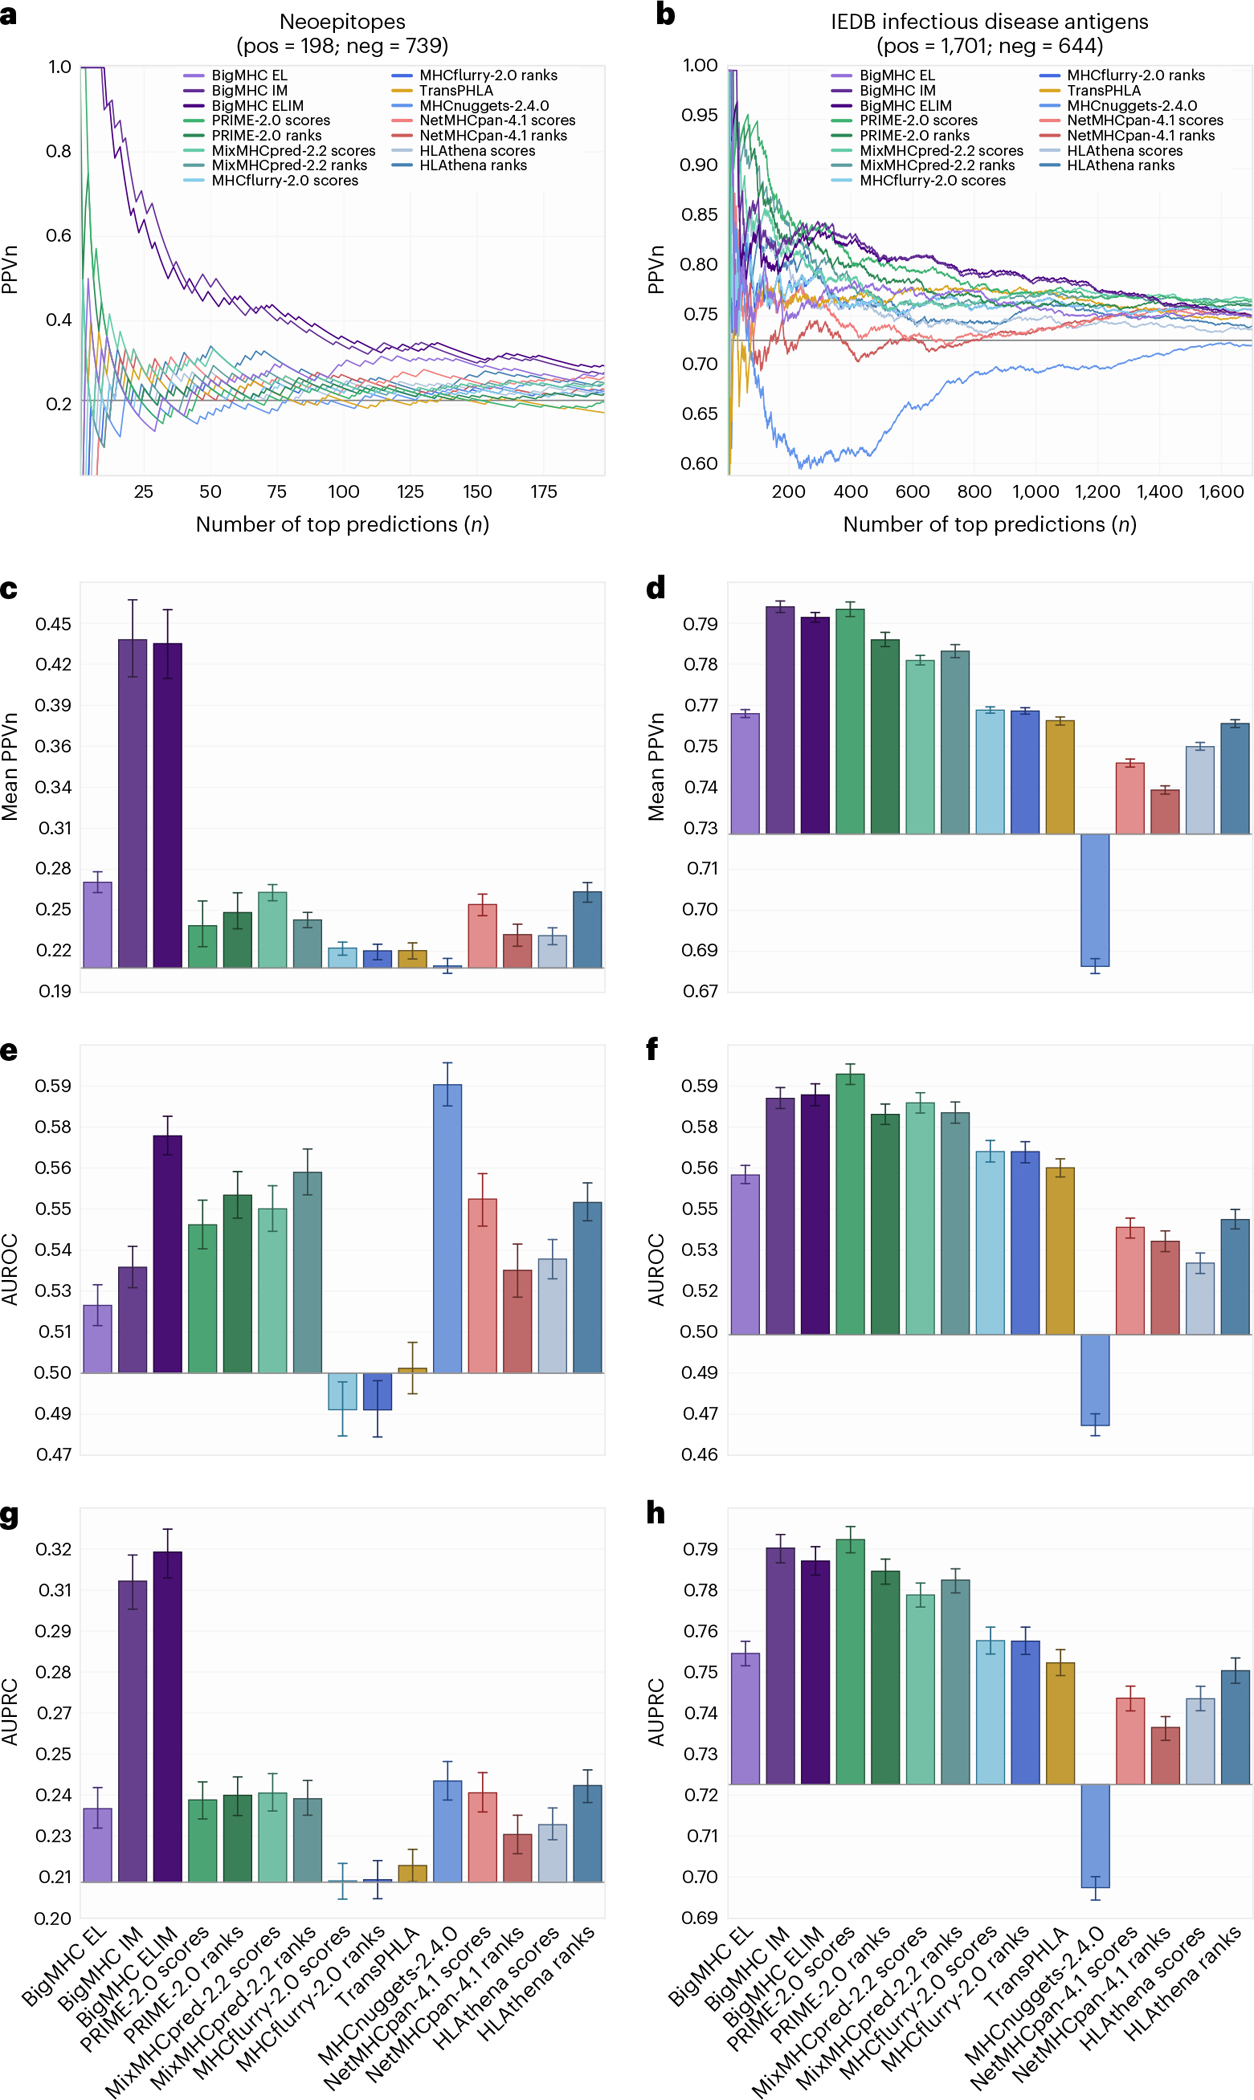
Identifying neoepitopes that elicit an adaptive immune response is a major bottleneck to developing personalized cancer vaccines. Experimental validation of candidate neoepitopes is extremely resource intensive and the vast majority of candidates are non-immunogenic, creating a needle-in-a-haystack problem. Here we address this challenge, presenting computational methods for predicting class I major histocompatibility complex (MHC-I) epitopes and identifying immunogenic neoepitopes with improved precision. The BigMHC method comprises an ensemble of seven pan-allelic deep neural networks trained on peptide-MHC eluted ligand data from mass spectrometry assays and transfer learned on data from assays of antigen-specific immune response. Compared with four state-of-the-art classifiers, BigMHC significantly improves the prediction of epitope presentation on a test set of 45,409 MHC ligands among 900,592 random negatives (area under the receiver operating characteristic = 0.9733; area under the precision-recall curve = 0.8779). After transfer learning on immunogenicity data, BigMHC yields significantly higher precision than seven state-of-the-art models in identifying immunogenic neoepitopes, making BigMHC effective in clinical settings.


Figures

Extended Data Fig. 1 |
Extended Data Fig. 1 |. Visualization of BigMHC average attention to MHC encodings on the EL test data.
a Heatmap visualization of the average attention value for each position in the MHC pseudosequence on the EL testing dataset. The heatmap is stratified by MHC allele as rows, and separated by positive and negative testing instances. The position of each amino acid in the sequences from IPD-IMGT/HLA is provided at the bottom of each column. Darker values indicate MHC positions that are more influential on the final model output. The column of Differences depicts the Negatives values subtracted from the Positives values; thus, darker blue colours are most correctly discriminative whereas darker red attention values in this column highlight erroneous inferences. b Overlays of the Differences column from the training dataset on the MHC molecule using py3Dmol. MHC protein structure models are generated using AlphaFold.
Extended Data Fig. 2 |
Extended Data Fig. 2 |. Visualization of the average MHC attention on the EL training data.
Heatmap visualization method of Extended Data Fig. 1a applied to the EL training data.
Extended Data Fig. 3 |
Extended Data Fig. 3 |. Neoepitope immunogenicity prediction results stratified by neoepitope length.
PPVn, mean PPVn, AUROC, and AUPRC are calculated and visualized in the same manner as Fig. 4. Bars represent means and error bars are 95% CIs. Neoepitope prediction performance from Fig. 4 is stratified by neoepitope length: 8 (n=184), 9 (n=281), 10 (n=241), and 11 (n=231).
Extended Data Fig. 4 |
Extended Data Fig. 4 |. IEDB infectious disease antigen immunogenicity prediction results stratified by epitope length.
PPVn, mean PPVn, AUROC, and AUPRC are calculated and visualized in the same manner as Fig. 4. Bars represent means and error bars are 95% CIs. Infectious disease antigen prediction performance from Fig. 4 is stratified by epitope length: 8 (n=112), 9 (n=1486), 10 (n=555), and 11 (n=192).
Extended Data Fig. 5 |
Extended Data Fig. 5 |. Composition of all training and evaluation datasets.
Positive and negative instances were stratified by HLA loci in the first two columns and by epitope length in the latter two columns. Positives in the EL datasets are detected by mass spectrometry, whereas negatives in the EL datasets are decoys. Both positives and negatives in the immunogenicity datasets are experimentally validated by immunogenicity assays.
Fig. 1 |
Fig. 1 |. Experimental procedure.
The procedure includes presentation training, immunogenicity transfer learning and independent evaluation on multiple datasets. The circles labelled ‘Con’ indicate dataset concatenation. Input and database symbols are color-coded by data type: presentation (yellow), immunogenicity training and neoepitope evaluation data (red), and infectious disease (orange). Rectangles are the processes: removing data overlap (purple), choosing best models (pink), training (blue), and evaluation (green).
Fig. 2 |
Fig. 2 |. BigMHC network architecture and pseudosequence composition.
a, The BigMHC deep neural network architecture, where the BigMHC ensemble comprises seven such networks. Pseudosequences and peptides are one-hot encoded prior to feeding them into the model. The circles labelled ‘Con’ indicate concatenation and the circle labelled ‘×’ denotes element-wise multiplication. The anchor block consists of two densely connected layers that each receive the first and last four peptide residues along with the MHC encoding. The self-attention modules are single-headed attention units, which is analogous to setting the number of heads of a standard multi-headed transformer attention module to one. Prior to the final sigmoid activation, the output of the model is a weighted sum of the MHC pseudosequence one-hot encoding; the weights are referred to as attention. Because all connections except internal BiLSTM cell connections are dense, data are not bottlenecked until the MHC attention node maps the pre-attention block output to a tensor of the same shape as the one-hot-encoded MHC pseudosequences. b, A wide LSTM. Each cell unroll processes the entire MHC pseudosequence but only a fixed-length window of the peptide. Where a canonical LSTM uses a window length of one, BigMHC uses a window length of eight to capitalize on the minimum pMHC peptide length. c, The pseudosequence amino acid residue probability (represented by the color scale) per alignment position. Note that not all amino acid residues are present for each position, as indicated by grey cells, so the one-hot encoding uses a ragged array, encoding only the residues present at a given position.
Fig. 3 |
Fig. 3 |. EL prediction results.
a, AUROC and AUPRC for each allele in the EL testing dataset. b, AUROC and AUPRC violin plots with embedded box-and-whisker plots stratified by allele and grouped by MHC locus. c, Mean AUROC and AUPRC per peptide allele length with 95% CI by MHC stratification. Baseline (random) classifier performance is 0.5 for AUROC and illustrated in grey for AUPRC. d, Mean AUROC and AUPRC and 95% CI stratified by MHC (n=36) and both MHC and epitope length (n=252) with two-tailed Wilcoxon signed-rank test adjusted P-values across methods.
Fig. 4 |
Fig. 4 |. Performance of immunogenicity predictions for all methods.
a,b, PPVn is calculated for each method as the fraction of neoepitopes (a) or infectious disease antigens (b) that are immunogenic within the top n predictions. c,d, The mean PPVn and 95% CI whiskers are reported for neoepitopes (c; n=937) and infectious disease antigens (d; n=2,345), summarizing the PPVn curves for all valid choices of n. The baseline PPVn, representing a random classifier, is illustrated as a horizontal line at 0.2113 for neoepitopes and 0.7254 for infectious disease antigens. eh, Mean AUROC (e,f) and mean AUPRC (g,h) of all methods with 95% bootstrap CIs from n=1,000 iterations for neoepitopes (e,g) and infectious disease antigens (f,h).

References

    1. Xiaoshan SM et al. High-throughput prediction of MHC class I and II neoantigens with MHCnuggets. Cancer Immunol. Res. 8, 396–408 (2020). - PMC - PubMed
    1. O’Donnell TJ, Rubinsteyn A & Laserson U MHCflurry 2.0: improved pan-allele prediction of MHC class I-presented peptides by incorporating antigen processing. Cell Syst. 11, 42–48 (2020). - PubMed
    1. Sarkizova S et al. A large peptidome dataset improves HLA class I epitope prediction across most of the human population. Nat. Biotechnol. 38, 199–209 (2020). - PMC - PubMed
    1. Stranzl T, Larsen MV, Lundegaard C & Nielsen M NetCTLpan: pan-specific MHC class I pathway epitope predictions. Immunogenetics 62, 357–368 (2010). - PMC - PubMed
    1. Nielsen M & Andreatta M NetMHCpan-3.0; improved prediction of binding to MHC class I molecules integrating information from multiple receptor and peptide length datasets. Genome Med. 8, 33 (2016). - PMC - PubMed