. 2023 Sep 27:14:1132570.
doi: 10.3389/fpsyg.2023.1132570. eCollection 2023.

Distribution-dependent representations in auditory category learning and generalization

Affiliations

Distribution-dependent representations in auditory category learning and generalization

Zhenzhong Gan et al. Front Psychol. .

Abstract

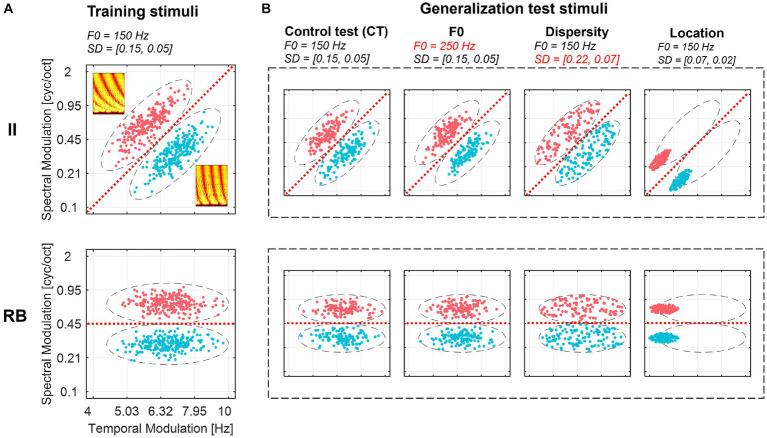
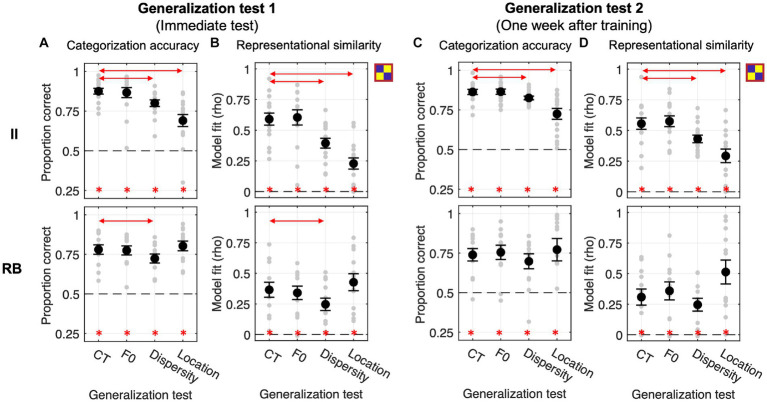
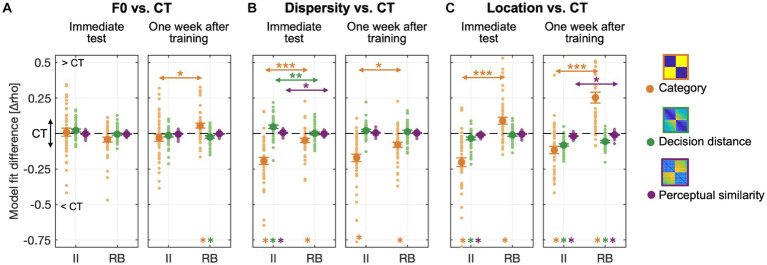
A fundamental objective in Auditory Sciences is to understand how people learn to generalize auditory category knowledge in new situations. How we generalize to novel scenarios speaks to the nature of acquired category representations and generalization mechanisms in handling perceptual variabilities and novelty. The dual learning system (DLS) framework proposes that auditory category learning involves an explicit, hypothesis-testing learning system, which is optimal for learning rule-based (RB) categories, and an implicit, procedural-based learning system, which is optimal for learning categories requiring pre-decisional information integration (II) across acoustic dimensions. Although DLS describes distinct mechanisms of two types of category learning, it is yet clear the nature of acquired representations and how we transfer them to new contexts. Here, we conducted three experiments to examine differences between II and RB category representations by examining what acoustic and perceptual novelties and variabilities affect learners' generalization success. Learners can successfully categorize different sets of untrained sounds after only eight blocks of training for both II and RB categories. The category structures and novel contexts differentially modulated the generalization success. The II learners significantly decreased generalization performances when categorizing new items derived from an untrained perceptual area and in a context with more distributed samples. In contrast, RB learners' generalizations are resistant to changes in perceptual regions but are sensitive to changes in sound dispersity. Representational similarity modeling revealed that the generalization in the more dispersed sampling context was accomplished differently by II and RB learners. II learners increased representations of perceptual similarity and decision distance to compensate for the decreased transfer of category representations, whereas the RB learners used a more computational cost strategy by default, computing the decision-bound distance to guide generalization decisions. These results suggest that distinct representations emerged after learning the two types of category structures and using different computations and flexible mechanisms in resolving generalization challenges when facing novel perceptual variability in new contexts. These findings provide new evidence for dissociated representations of auditory categories and reveal novel generalization mechanisms in resolving variabilities to maintain perceptual constancy.

Keywords: auditory category learning; dual learning system; generalization; information integration; representation nature; rule-based learning.


Conflict of interest statement

The authors declare that the research was conducted in the absence of any commercial or financial relationships that could be construed as a potential conflict of interest.

Figures

Figure 1
Figure 1
Ripple sounds of II and RB category structures used for training (A) and generalization tests (B). Two categories of sounds are plotted in different colors (Category 1: red, Category 2: blue) in a two-dimensional (i.e., spectral and temporal modulation dimensions) space. The red dashed lines represent the optimal boundaries separating the two categories. Dashed ellipses represent the coverage regions of the stimuli. Sampling parameters (i.e., F0 and dispersity [SD]) are listed at the top of each graph. Two spectrograms of the samples were plotted in the subgraph A. F0, fundamental frequency; SD, standard deviation of each within-category sampling distribution ([SDlong, SDshort]).
Figure 2
Figure 2
Illustration of training paradigms (A) and experimental procedures (B) used to train participants to learn auditory categories in the three experiments. (A) Three category training paradigms. The time windows for categorization response and visual feedback are highlighted in red. (B) Training and generalization procedures for the three experiments.
Figure 3
Figure 3
Representational similarity analysis procedure for modeling response confusion patterns to reveal the nature of emergent representations in generalization. (A) Three representation models were pre-defined based on category labels, bound-based decision distance, and center-based perceptual similarity. (B) Illustration of a response confusion matrix and representative examples of response confusion matrices for the four generalization tests.
Figure 4
Figure 4
Generalization performances and RSA model fits of the category model across four generalization tests in Exp. 1. (A,B) Generalization accuracy and model fit of the immediate test session. (C,D) Generalization accuracy and model fit of the test session conducted 1 week after training. Red lines with arrows indicate significant differences between CT and the other three tests. Asterisks represent the above-chance statistical significance (Bonferroni-corrected value of ps < 0.05) of each generalization test for each measure.
Figure 5
Figure 5
Generalization performances and RSA model fits of the binary category model across four generalization tests in Exp. 2.1 with categorization training without feedback. (A,B) Generalization accuracy and model fit of the immediate test session. (C,D) Generalization accuracy and model fit of the tests conducted 1 week after training. Red lines with arrows indicate significant differences between CT and the other three tests. Asterisks represent the above-chance statistical significance (Bonferroni-corrected value of ps < 0.05) of each generalization test for each measure.
Figure 6
Figure 6
Generalization performances and RSA model fits of the category model across four generalization tests in Exp. 2.2 with feedback-based categorization training. (A,B) Generalization accuracy and model fit of the immediate test session. (C,D) Generalization accuracy and model fit of the tests conducted 1 week after training. Red lines with arrows indicate significant differences between CT and the other three tests. Asterisks denote above-chance significance (Bonferroni-corrected value of ps < 0.05).
Figure 7
Figure 7
Changes in generalization accuracy (A,C) and RSA model fits of the binary category model (B,D) for the generalization tests performed immediately (A,B) and 1 week after training (C,D) for the three experiments. Red asterisks under the curly brackets denote significant differences between CT and the other three tests, with data collapsed across the three experiments. Red lines denote significant differences between II and RB learners, with data collapsed across all experiments. White asterisks denote significant differences between CT and each of the other three tests for each experiment. *p < 0.05; **p < 0.01; **p < 0.001; corrected p values.
Figure 8
Figure 8
Representation modeling of categorization confusion matrices with three predefined representation models using data collapsed across the three experiments. The unique contribution of each model was calculated and subtracted from CT to reveal the generalization effects. (A) RSA Model fit differences between F0 and CT tests for both groups; (B) Model fit differences between Dispersity and CT tests; (C) Model fit differences between Location and CT tests. Colored asterisks at the bottom of each graph denote significant differences between CT and each of the other three tests. Arrow lines denote significant differences between II and RB learners in model fit (*p < 0.05; **p < 0.01; **p < 0.001; corrected p values).

References

    1. Ashby F. G., Ell S. W., Waldron E. M. (2003). Procedural learning in perceptual categorization. Mem. Cogn. 31, 1114–1125. doi: 10.3758/BF03196132, PMID: - DOI - PubMed
    1. Ashby F. G., Maddox W. T. (1992). Complex decision rules in categorization: contrasting novice and experienced performance. J. Exp. Psychol. Hum. Percept. Perform. 18, 50–71. doi: 10.1037/0096-1523.18.1.50 - DOI
    1. Ashby F. G., Maddox W. T. (2005). Human category learning. Annu. Rev. Psychol. 56, 149–178. doi: 10.1146/annurev.psych.56.091103.070217 - DOI - PubMed
    1. Ashby F. G., Maddox W. T. (2011). Human category learning 2.0: human category learning 2.0. Ann. N. Y. Acad. Sci. 1224, 147–161. doi: 10.1111/j.1749-6632.2010.05874.x, PMID: - DOI - PMC - PubMed
    1. Ashby F. G., Maddox W. T., Bohil C. J. (2002). Observational versus feedback training in rule-based and information-integration category learning. Mem. Cogn. 30, 666–677. doi: 10.3758/BF03196423 - DOI - PubMed

LinkOut - more resources