Clinical Trial
. 2023 Sep 27;12(19):2365.
doi: 10.3390/cells12192365.

Early Pharmacodynamic Changes Measured Using RNA Sequencing of Peripheral Blood from Patients in a Phase I Study with Mitazalimab, a Potent CD40 Agonistic Monoclonal Antibody

Affiliations
Clinical Trial

Early Pharmacodynamic Changes Measured Using RNA Sequencing of Peripheral Blood from Patients in a Phase I Study with Mitazalimab, a Potent CD40 Agonistic Monoclonal Antibody

Hampus Andersson et al. Cells. .

Abstract

CD40-targeting therapies can enhance the dendritic cell priming of tumor-specific T cells and repolarize intratumoral macrophages to alleviate the tumoral immunosuppressive environment and remodel the extracellular matrix. Mitazalimab is a potent agonistic CD40 monoclonal IgG1 antibody currently under clinical development. This study used RNA sequencing of blood samples from a subset of patients from a Phase I trial with mitazalimab (NCT02829099) to assess peripheral pharmacodynamic activity. We found that mitazalimab induced transient peripheral transcriptomic alterations (at 600 µg/kg and 900 µg/kg dose administered intravenously), which mainly were attributed to immune activation. In particular, the transcriptomic alterations showed a reduction in effector cells (e.g., CD8+ T cells and natural killer cells) and B cells peripherally with the remaining cells (e.g., dendritic cells, monocytes, B cells, and natural killer cells) showing transcription profiles consistent with activation. Lastly, distinct patient subgroups based on the pattern of transcriptomic alterations could be identified. In summary, the data presented herein reinforce the anticipated mode of action of mitazalimab and support its ongoing clinical development.

Keywords: CD40; RNA sequencing; cancer; mitazalimab; pharmacodynamics.


Conflict of interest statement

At the time of submission, all authors are employed by, or affiliated with, Alligator Bioscience AB.

Figures

Figure 1
Figure 1
Schematic overview of study design and principal component analysis (PCA) of all samples, not pretreated with corticosteroids, at all analyzed time points. Mitazalimab induced a transient shift along both principal components (PC1 and PC2) which was most predominant at 600 µg/kg and 900 µg/kg. Colors indicate mitazalimab dose, and PC1 and PC2 explain 25% and 13% variance, respectively.
Figure 2
Figure 2
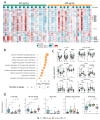
Pharmacodynamic effects on peripheral transcriptome induced by mitazalimab at 600 µg/kg and 900 µg/kg: (A) Heatmap of Z-score normalized VST transformed gene expression of the 392 DEGs induced at both 600 µg/kg and 900 µg/kg. Paired columns show paired samples during pretreatment and 24 h post-treatment. (B) Pathway enrichment analysis of the 392 shared differentially expressed genes in (A). The X-axis shows the log10 p-value and the dot size indicates the number of genes represented in each pathway. (C) Box plots of selected genes illustrate the effect of mitazalimab on immune cells, particularly on effector cells and antigen-presenting cells. Dots represent the expression values of individual patients. (D) Relative frequencies of deconvoluted gene types as estimated using CIBERSORTx at C1D1, for each dose cohort at C1D2, and at C3D1. Dots represent individual values. * p < 0.05; ** p < 0.01; *** p < 0.001; **** p < 0.0001.
Figure 3
Figure 3
RNA sequencing data allowed for patient stratification with distinct mitazalimab-induced transcriptomic alterations in the patient groups: (A) Z-normalized VST transformed gene expression of the 1500 most variable genes across the 600 µg/kg and 900 µg/kg cohort. The top dendrogram shows the result of multiscale bootstrapping hierarchical clustering. One larger cluster (p-value < 0.05), containing samples at C1D2 treated with either 600 µg/kg or 900 µg/kg mitazalimab, was evident. This cluster was named patient group 1, and the rest of the samples were named patient group 2. (B) A similar clustering was seen in PCA of samples treated with 600 µg/kg or 900 µg/kg, at C1D1 and C1D2. (C) Volcano plots comparing C1D1 against C1D2 in patient groups 1 and 2. In general, a more prominent peripheral transcriptomic effect was seen in patient group 1. (D) Radar chart depicting the results of gene set variation analysis of selected GO pathways for the respective patient groups and samples at baseline. (E) Stacked bar plot of relative frequencies of the deconvoluted gene types from CIBERSORTx at C1D1 and C1D2 stratified based on patient group and C3D1.
Figure 4
Figure 4
Mitazalimab-induced immune activation in patient groups stratified based on peripheral transcriptomic alterations: (A) Samples from patient group 1 showed higher expression of genes previously identified in interferon-stimulated monocytes (Table S4). The heatmap shows Z-score normalized VST gene expression with columns representing samples at either C1D1 or C1D2 stratified into patient groups. (B) Expression of immunologically relevant genes after mitazalimab treatment. Samples from C1D1 and C3D1 are grouped, and samples from C1D2 are stratified into identified patient groups. Dots show individual values. Dots represent individual values. * p < 0.05; ** p < 0.01; *** p < 0.001; **** p < 0.0001. (C) Serum cytokine levels after mitazalimab administration. Values are stratified based on patient groups identified from RNA sequencing data. Thick lines represent group means and thin lines indicate individual values.

References

    1. Shiravand Y., Khodadadi F., Kashani S.M.A., Hosseini-Fard S.R., Hosseini S., Sadeghirad H., Ladwa R., O’Byrne K., Kulasinghe A. Immune Checkpoint Inhibitors in Cancer Therapy. Curr. Oncol. 2022;29:3044–3060. doi: 10.3390/curroncol29050247. - DOI - PMC - PubMed
    1. Li F., Li C., Cai X., Xie Z., Zhou L., Cheng B., Zhong R., Xiong S., Li J., Chen Z., et al. The Association between CD8+ Tumor-Infiltrating Lymphocytes and the Clinical Outcome of Cancer Immunotherapy: A Systematic Review and Meta-Analysis. eClinicalMedicine. 2021;41:101134. doi: 10.1016/j.eclinm.2021.101134. - DOI - PMC - PubMed
    1. Liot S., Balas J., Aubert A., Prigent L., Mercier-Gouy P., Verrier B., Bertolino P., Hennino A., Valcourt U., Lambert E. Stroma Involvement in Pancreatic Ductal Adenocarcinoma: An Overview Focusing on Extracellular Matrix Proteins. Front. Immunol. 2021;12:612271. doi: 10.3389/fimmu.2021.612271. - DOI - PMC - PubMed
    1. Banchereau J., Bazan F., Blanchard D., Briè F., Galizzi J.P. The CD40 Antigen and Its Ligand. Annu. Rev. Immunol. 1994;12:881–922. doi: 10.1146/annurev.iy.12.040194.004313. - DOI - PubMed
    1. Ma D.Y., Clark E.A. The Role of CD40 and CD40L in Dendritic Cells. Semin. Immunol. 2009;21:265–272. doi: 10.1016/j.smim.2009.05.010. - DOI - PMC - PubMed

Publication types

MeSH terms

Associated data