. 2023 Oct 2;12(19):2396.
doi: 10.3390/cells12192396.

NAD+ Acts as a Protective Factor in Cellular Stress Response to DNA Alkylating Agents

Affiliations

NAD+ Acts as a Protective Factor in Cellular Stress Response to DNA Alkylating Agents

Joanna Ruszkiewicz et al. Cells. .

Abstract

Sulfur mustard (SM) and its derivatives are potent genotoxic agents, which have been shown to trigger the activation of poly (ADP-ribose) polymerases (PARPs) and the depletion of their substrate, nicotinamide adenine dinucleotide (NAD+). NAD+ is an essential molecule involved in numerous cellular pathways, including genome integrity and DNA repair, and thus, NAD+ supplementation might be beneficial for mitigating mustard-induced (geno)toxicity. In this study, the role of NAD+ depletion and elevation in the genotoxic stress response to SM derivatives, i.e., the monofunctional agent 2-chloroethyl-ethyl sulfide (CEES) and the crosslinking agent mechlorethamine (HN2), was investigated with the use of NAD+ booster nicotinamide riboside (NR) and NAD+ synthesis inhibitor FK866. The effects were analyzed in immortalized human keratinocytes (HaCaT) or monocyte-like cell line THP-1. In HaCaT cells, NR supplementation, increased NAD+ levels, and elevated PAR response, however, did not affect ATP levels or DNA damage repair, nor did it attenuate long- and short-term cytotoxicities. On the other hand, the depletion of cellular NAD+ via FK866 sensitized HaCaT cells to genotoxic stress, particularly CEES exposure, whereas NR supplementation, by increasing cellular NAD+ levels, rescued the sensitizing FK866 effect. Intriguingly, in THP-1 cells, the NR-induced elevation of cellular NAD+ levels did attenuate toxicity of the mustard compounds, especially upon CEES exposure. Together, our results reveal that NAD+ is an important molecule in the pathomechanism of SM derivatives, exhibiting compound-specificity. Moreover, the cell line-dependent protective effects of NR are indicative of system-specificity of the application of this NAD+ booster.

Keywords: DNA damage; NAD booster; PARP; mustard agents; nicotinamide adenine dinucleotide; nicotinamide riboside; poly(ADP-ribosylation); sulfur mustard.


Conflict of interest statement

The authors declare no conflict of interest.

Figures

Figure 1
Figure 1
NR is the most efficient among tested NAD+ supplements. (A) NAD+ synthesis pathways. Abbreviations: L-Trp: L-tryptophane; NA: nicotinic acid; NAAD: nicotinate adenine dinucleotide; NAD+: nicotinamide adenine dinucleotide; NADS: NAD synthase; NAM: nicotinamide; NAMN: nicotinate mononucleotide; NAMPT: nicotinamide phosphoribosyltransferase; NAPRT: nicotinate phosphoribosyltransferase; NMN: nicotinamide mononucleotide; NMNAT: nicotinamide mononucleotide adenylyltransferase; NR: nicotinamide riboside; NRK: nicotinamide riboside kinases; PNP: purine nucleoside phosphorylase. (BE) NAD+ levels upon treatment with precursors. HaCaT cells were harvested immediately after exposure for 1, 2, 3, 4, 5, and 24 h with NR ((B), n = 3–4), NAM ((C), n = 3–4), NMN ((D), n = 2–3), or NA ((E), n = 3). Cellular NAD+ levels were measured via enzymatic cycling assay, and data were normalized to the control (0 µM) at 1 h. The results were expressed as mean ± SEM and analyzed by two-way ANOVA with Tukey’s multiple comparison test. * p < 0.05, *** p < 0.001 vs. “0 µM”.
Figure 2
Figure 2
NR elevates NAD+ levels during genotoxic stress. (A) Chemical structures of 2-chloroethyl-ethyl sulfide (CEES) and bis(2-chloroethyl)methylamine (HN2). (BI) HaCaT cells were supplemented with 100 μM NR for 3 h (pretreatment) and further treated with CEES or HN2 in PBS (“Control”) for 30 min; “0 mM” refers to solvent control. After exposure, cells were incubated with fresh growth medium ±100 μM NR (posttreatment) for up to 24 h or were harvested immediately (0 h). Cellular NAD+ levels were measured via enzymatic cycling assay and normalised to the total protein level measured by BCA. The results were expressed as mean ± SEM and analyzed by two-way ANOVA with Tukey’s multiple comparisons test (n = 3). * p < 0.05, ** p < 0.01, *** p < 0.001 vs. “Control”.
Figure 3
Figure 3
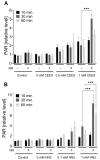
NR elevates PAR levels during genotoxic stress. HaCaT cells were supplemented with 100 μM NR for 3 h (pretreatment) and further treated with CEES ((A), n = 3) or HN2 ((B), n = 2–3) for 10, 30, or 60 min in PBS (“Control”); “0 mM” refers to solvent control. At the end of each time-point, cells were fixed with ice-cold methanol and stained with anti-PAR antibody (10H) and DNA dye (Hoechst 33342). Images were acquired using epifluorescence microscope and automatically analyzed using KNIME software. Results were normalized to “Control” (10 min) and expressed as mean ± SEM. Results were analyzed by two-way ANOVA and Tukey’s multiple comparison tests. *** p < 0.001.
Figure 4
Figure 4
NR does not affect ATP levels during genotoxic stress. HaCaT cells were supplemented with 100 μM NR for 3 h (pretreatment) and subsequently treated with CEES ((A), n = 3–4) or HN2 ((B), n = 3–4) for 30 min in PBS (“Control”); “0” refers to solvent control. Cells were harvested immediately (0 h) or after 24 h incubation in a fresh growth medium ±100 µM NR (posttreatment). Cellular ATP levels were measured via Cellular ATP Kit HTS and normalized to total protein measured by BCA. Results were expressed as mean ± SEM and analyzed by two-way ANOVA with Tukey’s multiple comparisons test.
Figure 5
Figure 5
NR does not attenuate cell death induced by genotoxicants. HaCaT cells were supplemented with 100 μM NR for 3 h (pretreatment) and further treated with CEES ((A), n = 3) or HN2 ((B,) n = 3) for 30 min in PBS (“Control”); “0 mM” refers to solvent control. After exposure, cells were incubated with a fresh growth medium ±100 μM NR (posttreatment) for 24 h. Then, cells were harvested, stained with Annexin V(AV) and propidium iodide (PI), and analyzed via FACS. At least 10,000 cells per sample were measured. Viable cells (AV–/PI–), early apoptotic cells (AV+/PI–), late apoptotic/necrotic cells (AV+/PI+), and dead cells (AV–/PI+) were identified. Results were expressed as mean + SEM and analyzed by two-way ANOVA with Tukey’s multiple comparisons test.
Figure 6
Figure 6
NR does not attenuate cytotoxicity as assessed by clonogenic survival. HaCaT cells were supplemented with 100 μM NR for 3 h (pretreatment) and further treated with CEES ((A), n = 3) or HN2 ((B), n = 3–4) for 30 min in growth medium (“Control”); “0 mM” refers to solvent control. After treatment, cells were reseeded 1000 cells/well in technical triplicates and allowed to grow for 7 days in fresh growth medium ±100 µM NR (posttreatment). Next, colonies were stained with crystal violet and counted using OpenCFU software. For each experiment, an average from technical replicates of the colony-forming unit (CFU) was calculated and normalized to the control (growth medium without NR). Results were expressed as mean ± SEM and analyzed by two-way ANOVA with Tukey’s multiple comparison test.
Figure 7
Figure 7
NR attenuates the sensitizing effect of FK866 on genotoxic stress. HaCaT cells were treated with FK866 in 0.5% DMSO (0 nM FK866) for 24 h and then exposed to CEES ((A), n = 2–3) or HN2 ((B), n = 3) for 30 min in growth medium; “0 mM” refers to solvent control. Subsequently, cells were reseeded 1000 cells per well in technical triplicates and incubated in fresh growth medium with or without FK866 for 7 days. Then, colonies were stained and counted. For each experiment, an average from technical replicates of the colony-forming unit (CFU) was calculated and normalized to the control (0 nM FK866). (C,D) HaCaT cells were treated with CEES ((C), n = 3) or HN2 ((D), n = 3); additionally, FK866 and 100 µM NR were added to the culture as described in Materials and Methods, and samples were analyzed similar to that in (A,B). Results were expressed as mean ± SEM and analyzed by two-way ANOVA with Tukey’s multiple comparison test. * p < 0.05, ** p < 0.01, *** p < 0.001 vs. “0 nM FK866; # p < 0.05, ## p < 0.01 vs. respective samples without NR.
Figure 8
Figure 8
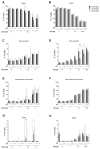
NR attenuates the sensitizing effect of FK866 on cell death. HaCaT cells were treated with FK866 in 0.5% DMSO (0 nM FK866) for 24 h; additionally, 100 µM NR was added to the culture as described in Materials and Methods. Next, cells were exposed to CEES ((A,C,E,G); n = 3) or HN2 ((B,D,F,H); n = 3–4) for 30 min in PBS; “0” refers to solvent control. After exposure, cells were washed, fresh growth medium with or without FK866 and with or without NR was applied, and cells were incubated for 24 h. Then, cells were harvested, stained with Annexin V(AV) and propidium iodide (PI), and analyzed via FACS. At least 10,000 cells per sample were measured. Viable cells (AV–/PI–), early apoptotic cells (AV+/PI–), late apoptotic/necrotic cells (AV+/PI+), and dead cells (AV–/PI+) were identified. Results were expressed as mean + SEM and analyzed by two-way ANOVA with Tukey’s multiple comparisons test. * p < 0.05, *** p < 0.001.
Figure 9
Figure 9
Effects of NR supplementation in THP-1 cells exposed to CEES or HN2. (A) THP-1 cells were supplemented with 200 µM NR for 4 h before treatment with CEES or HN2 in growth medium (“Ctrl”) for 30 min. The “0” refers to solvent control. After exposure, cells were incubated with fresh growth medium with or without 200 µM NR for 20 h, and cell viability was measured with alamarBlue assay. Results were normalized to the control “Ctrl” and expressed as mean ± SEM (n = 3–4). (B) After treatment, similarly to that in (A), THP-1 cells were incubated for 24 h, and cellular NAD+ was extracted. NAD+ levels were measured via enzymatic cycling assay and normalized to the total protein level measured by BCA (n = 2–3). Data were analyzed by two-way ANOVA with Tukey’s multiple comparisons test. ** p < 0.01.

References

    1. Mangerich A., Esser C. Chemical warfare in the First World War: Reflections 100 years later. Arch. Toxicol. 2014;88:1909–1911. doi: 10.1007/s00204-014-1370-z. - DOI - PubMed
    1. Panahi Y., Abdolghaffari A.H., Sahebkar A. A review on symptoms, treatments protocols, and proteomic profile in sulfur mustard-exposed victims. J. Cell. Biochem. 2018;119:197–206. doi: 10.1002/jcb.26247. - DOI - PubMed
    1. Rahmani S., Abdollahi M. Novel treatment opportunities for sulfur mustard-related cancers: Genetic and epigenetic perspectives. Arch. Toxicol. 2017;91:3717–3735. doi: 10.1007/s00204-017-2086-7. - DOI - PubMed
    1. Etemad L., Moshiri M., Balali-Mood M. Advances in treatment of acute sulfur mustard poisoning—A critical review. Crit. Rev. Toxicol. 2019;49:191–214. doi: 10.1080/10408444.2019.1579779. - DOI - PubMed
    1. Neidle S., Thurston D.E. Chemical approaches to the discovery and development of cancer therapies. Nat. Rev. Cancer. 2005;5:285–296. doi: 10.1038/nrc1587. - DOI - PubMed

Publication types

LinkOut - more resources