. 2023 Oct 4;12(19):2403.
doi: 10.3390/cells12192403.

Axon-Autonomous Effects of the Amyloid Precursor Protein Intracellular Domain (AICD) on Kinase Signaling and Fast Axonal Transport

Affiliations

Axon-Autonomous Effects of the Amyloid Precursor Protein Intracellular Domain (AICD) on Kinase Signaling and Fast Axonal Transport

Svenja König et al. Cells. .

Abstract

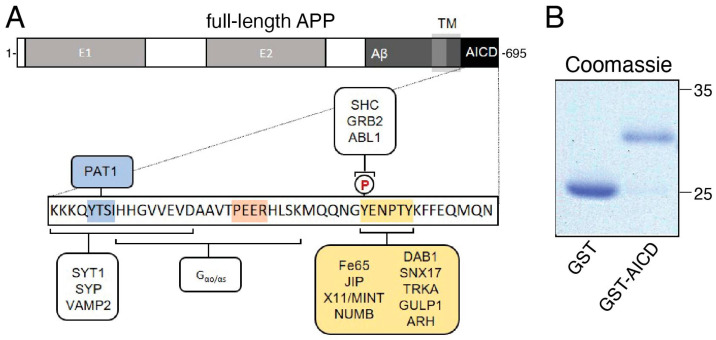
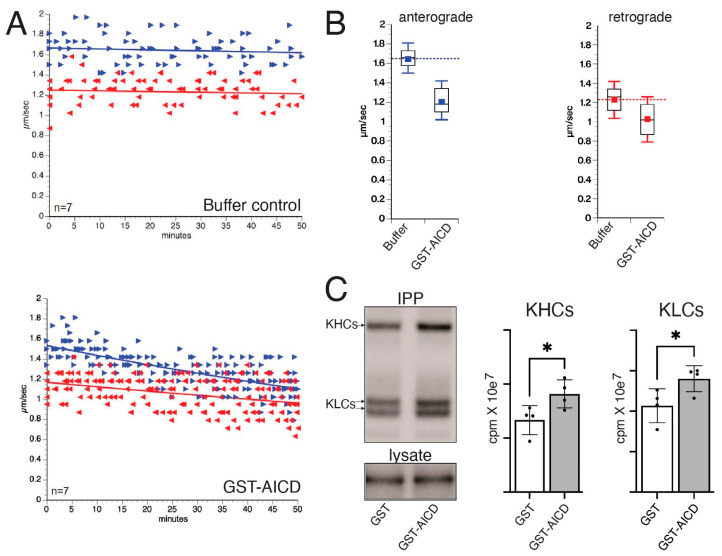
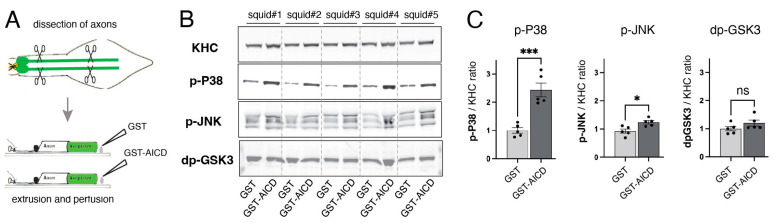
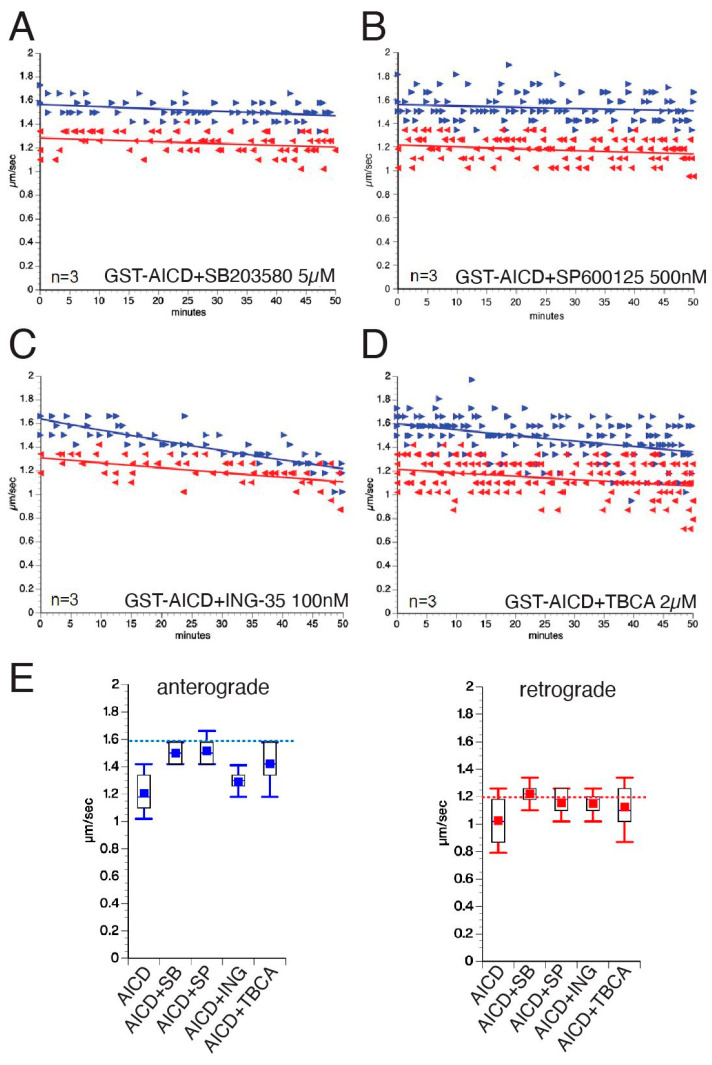
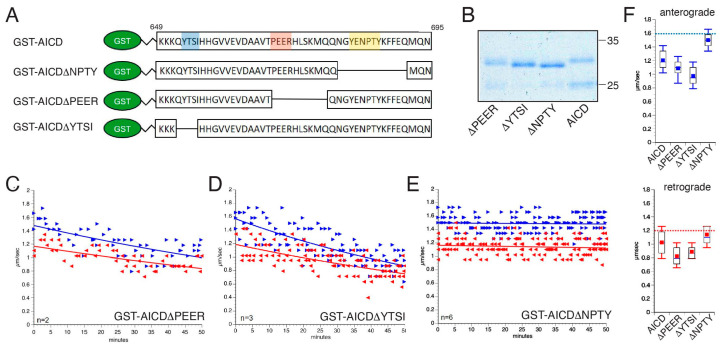
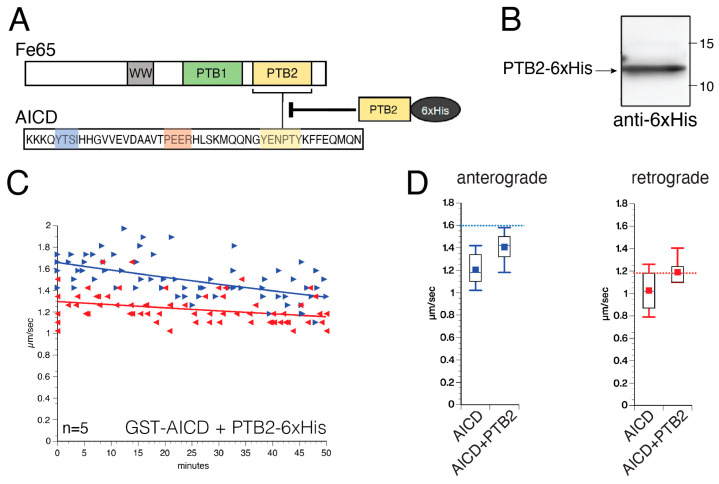
The amyloid precursor protein (APP) is a key molecular component of Alzheimer's disease (AD) pathogenesis. Proteolytic APP processing generates various cleavage products, including extracellular amyloid beta (Aβ) and the cytoplasmic APP intracellular domain (AICD). Although the role of AICD in the activation of kinase signaling pathways is well established in the context of full-length APP, little is known about intracellular effects of the AICD fragment, particularly within discrete neuronal compartments. Deficits in fast axonal transport (FAT) and axonopathy documented in AD-affected neurons prompted us to evaluate potential axon-autonomous effects of the AICD fragment for the first time. Vesicle motility assays using the isolated squid axoplasm preparation revealed inhibition of FAT by AICD. Biochemical experiments linked this effect to aberrant activation of selected axonal kinases and heightened phosphorylation of the anterograde motor protein conventional kinesin, consistent with precedents showing phosphorylation-dependent regulation of motors proteins powering FAT. Pharmacological inhibitors of these kinases alleviated the AICD inhibitory effect on FAT. Deletion experiments indicated this effect requires a sequence encompassing the NPTY motif in AICD and interacting axonal proteins containing a phosphotyrosine-binding domain. Collectively, these results provide a proof of principle for axon-specific effects of AICD, further suggesting a potential mechanistic framework linking alterations in APP processing, FAT deficits, and axonal pathology in AD.

Keywords: AICD; APP; Alzheimer’s disease; NPTY; kinases.


Conflict of interest statement

The authors declare no conflict of interest.

Figures

Figure 1
Figure 1
APP interacts with numerous protein ligands through specific motifs. (A) Top: schematic illustration of full-length amyloid precursor protein (APP) showing its long extracellular as well as its short intracellular domain (AICD). Bottom: selected interaction partners of the APP intracellular domain (AICD) and specific peptide motifs involved are highlighted. (B) A cDNA encoding AICD fused to glutathione-S-transferase (GST–AICD) was used to express and purify recombinant protein from E. coli. Purified GST and GST–AICD proteins were separated using SDS-PAGE and stained with Coomassie Blue. Abbreviations: TM = transmembrane domain; PAT1 = protein interacting with APP tail 1; SYT1 = synaptotagmin 1; SYP = synaptophysin; VAMP2 = vesicle-associated membrane protein 2; SHC = SRC homology 2 domain-containing-transforming protein 1; GRB2 = growth factor receptor-bound protein 2; JIP = cJun N-terminal kinase-interacting protein; DAB1 = disabled homologue 1; SNX17 = sorting nexin 17; TRKA = tyrosine kinase receptor A; GULP1 = engulfment adapter PTB domain containing 1; ARH = low-density lipoprotein receptor adaptor protein 1 (LDLRAP1).
Figure 2
Figure 2
AICD inhibits fast axonal transport (FAT), an effect that correlated with increased phosphorylation of conventional kinesin. (A) Vesicle motility assays in isolated squid axoplasm showing the effects of Buffer X/2 alone (control, top) or Buffer X/2 mixed with 100 nM GST–AICD (bottom). Both anterograde and retrograde FAT rates were obtained using video-enhanced contrast-differential interference contrast microscopy over a period of 50 min. Graphs were plotted as a function of velocity (µm/s) and time. Right blue arrows (►) correspond to individual anterograde FAT rate measurements, whereas left red arrows (◄) indicate individual retrograde FAT rates. FAT rates remained constant in control axoplasms perfused with Buffer X/2 (buffer control, top panel). In contrast, a time-dependent reduction in both anterograde and retrograde FAT rates was observed in axoplasms perfused with GST–AICD (lower panel). (B) Quantitation of individual anterograde (left panel) and retrograde (right panel) FAT rate measurements collected between 30 and 50 min after perfusion. For reference, dashed blue (anterograde) and red (retrograde) lines indicate mean FAT values for control axoplasms perfused with Buffer X/2 (1.64 µm/s and 1.23 µm/s, respectively) (C) Axoplasm pairs (see Methods) were perfused with 1 mM radiolabeled P32 ATP and 500 nM GST or GST–AICD (n = 4 each). Following lysis, conventional kinesin was immunoprecipitated using an anti-kinesin-1 (H2) antibody, and immunoprecipitates (IPP) were separated using SDS-PAGE. Radiolabeled bands corresponding to heavy chains (KHC) and light chains (KLC) of conventional kinesin are shown (upper panel; IPP) [6,29]. As a loading control, 3% of the input axoplasm lysates prior to IPP were loaded and separated using SDS-PAGE. One of the numerous phosphorylated proteins in input lysates was used for normalization (lower panel, lysate). Densitometric quantification of autoradiograms showed increased P32 incorporation in both KHC and KLC subunits in lysates prepared from axoplasms perfused with GST–AICD compared to axoplasms perfused with GST. * p = 0.05.
Figure 3
Figure 3
AICD activates axonal p38 and JNK. (A) Two “sister” giant axon pairs were dissected from five squid. Each “sister” axon pair was perfused with either 500 nM GST or 500 nM GST–AICD, both diluted in Buffer X/2. Axoplasm lysates were prepared, separated using SDS-PAGE, and processed for immunoblotting. (B) Immunoblots were developed with antibodies that recognize active (activation loop-phosphorylated) forms of p38 and JNK (p-p38 and p-JNK, respectively), as well with an antibody that recognizes dephosphorylated (dp, active) forms of GSK3α and GSK3β [31]. An antibody recognizing kinesin heavy-chain subunits (KHC) provided a control for total axoplasmic protein loading (H2 antibody; [38]). (C) Plots depicting LICOR-based quantitation of anti-p-p38, anti-p-JNK, and anti-dpGSK3 immunoreactivities, normalized to that from anti-KHC antibody. Perfusion of GST–AICD significantly increased levels of active p38 (p-p38) and JNK (pJNK) compared to sister axoplasms perfused with GST. In contrast, levels of active (serine9-dephosphorylated) GSK3 (dp-GSK3) remained unchanged. *** p = 0.001, * p = 0.05, ns = not significant; n = 5.
Figure 4
Figure 4
p38, JNK, and CK2 contribute to the inhibitory effect of AICD on fast axonal transport. (AD) Vesicle motility assays in isolated squid axoplasm. Isolated axoplasms were co-perfused with 100 nM GST–AICD and specific kinase inhibitors, including 5 µM SB203580 (p38 kinase inhibitor; (A)), 500 nM SP600125 (JNK inhibitor; (B)), 100 nM ING-135 (GSK3 inhibitor; (C)), and 2 µM TBCA (CK2 inhibitor; (D)). Anterograde (►, blue arrows) and retrograde (◄, red arrows) FAT rates were measured via video-enhanced contrast-differential interference contrast microscopy over 50 min. Graphs are plotted as velocity (µm/s) against time (minutes). (E) Quantitation of mean anterograde (left panel) and retrograde (right panel) FAT rates from experiments in panels (AD) (see Table 1 and Table 2). For reference, dashed blue (anterograde) and red (retrograde) lines are shown indicating mean FAT values for control axoplasms perfused with Buffer X/2 (1.64 µm/s and 1.23 µm/s, respectively).
Figure 5
Figure 5
The inhibitory effect of AICD on FAT depends on a peptide sequence encompassing the NPTY motif. (A) Schematic illustration of glutathione-S-transferase (GST) fusion proteins coupled to either the APP intracellular domain (GST–AICD) or the GST–AICD mutants lacking the YTSI (blue), PEER (orange), or NPTY (yellow) motif. (B) Coomassie staining of affinity-purified GST fusion proteins in (A) after separation with SDS-PAGE. (CE) Vesicle motility assays in isolated squid axoplasm. Isolated axoplasms were co-perfused with 100 nM GST–AICD or the indicated GST–AICD mutants (C) ΔPEER, (D) ΔYTSI, or (E) ΔNPTY. Anterograde (►, blue arrows) and retrograde (◄, red arrows) FAT rates were obtained using video-enhanced contrast-differential interference contrast microscopy over 50 min. Graphs are plotted as velocity (µm/s) against time. (F) Quantitation of mean anterograde (top panel) and retrograde (bottom panel) FAT rates from experiments in panels (CE) compared to GST–AICD (see Table 1 and Table 2). For reference, dashed blue (anterograde) and red (retrograde) lines are shown indicating mean FAT values for control axoplasms perfused with Buffer X/2 (1.64 µm/s and 1.23 µm/s, respectively).
Figure 6
Figure 6
The inhibitory effect of AICD on FAT is significantly reduced by co-perfusion of a phosphotyrosine-binding (PTB) domain. (A) Schematic illustration of the APP interacting protein Fe65 containing different protein interaction domains, such as the WW, PTB1, and PTB2 domains. Highlighted in yellow is the PTB2 domain, which has been shown to interact with the NPTY motif in AICD. Perfused at higher molar concentrations, a recombinant version of a 6xHis-tagged PTB2 protein would be expected to compete with NPTY interactions with endogenous squid proteins containing a similar domain (inhibitory arrow). (B) Western blot of the purified recombinant PTB2-6xHis protein, developed using an anti-6xHis antibody. (C) Vesicle motility assay performed in isolated squid axoplasm showing the effect of 100 nM AICD co-perfused with 500 nM PTB2-6xHis. Anterograde (►, blue arrows) and retrograde (◄, red arrows) FAT rates were obtained via video-enhanced contrast-differential interference contrast microscopy over 50 min. Graphs are plotted as velocity (µm/s) against time. (D) Quantitation of mean FAT rates from experiments in (C). PTB2-6His co-perfusion significantly prevented the effects of AICD on both mean anterograde (left panel) and retrograde (right panel) FAT rates. For reference, dashed blue (anterograde) and red (retrograde) lines indicate mean FAT values for control axoplasms perfused with Buffer X/2.

References

    1. Black M.M. Axonal transport: The orderly motion of axonal structures. Methods Cell Biol. 2016;131:1–19. doi: 10.1016/bs.mcb.2015.06.001. - DOI - PubMed
    1. Morfini G., Schmidt N., Weissmann C., Pigino G., Kins S. Conventional kinesin: Biochemical heterogeneity and functional implications in health and disease. Brain Res. Bull. 2016;126:347–353. doi: 10.1016/j.brainresbull.2016.06.009. - DOI - PubMed
    1. Brady S.T., Morfini G.A. Regulation of motor proteins, axonal transport deficits and adult-onset neurodegenerative diseases. Neurobiol. Dis. 2017;105:273–282. doi: 10.1016/j.nbd.2017.04.010. - DOI - PMC - PubMed
    1. Kanaan N.M., Pigino G.F., Brady S.T., Lazarov O., Binder L.I., Morfini G.A. Axonal degeneration in Alzheimer’s disease: When signaling abnormalities meet the axonal transport system. Exp. Neurol. 2013;246:44–53. doi: 10.1016/j.expneurol.2012.06.003. - DOI - PMC - PubMed
    1. Morfini G.A., You Y.-M., Pollema S.L., Kaminska A., Liu K., Yoshioka K., Björkblom B., Coffey E.T., Bagnato C., Han D., et al. Pathogenic huntingtin inhibits fast axonal transport by activating JNK3 and phosphorylating kinesin. Nat. Neurosci. 2009;12:864–871. doi: 10.1038/nn.2346. - DOI - PMC - PubMed

Publication types

MeSH terms

Substances