. 2023 Oct 31;14(5):e0151623.
doi: 10.1128/mbio.01516-23. Epub 2023 Oct 13.

The cystic fibrosis treatment Trikafta affects the growth, viability, and cell wall of Aspergillus fumigatus biofilms

Affiliations

The cystic fibrosis treatment Trikafta affects the growth, viability, and cell wall of Aspergillus fumigatus biofilms

Jane T Jones et al. mBio. .

Abstract

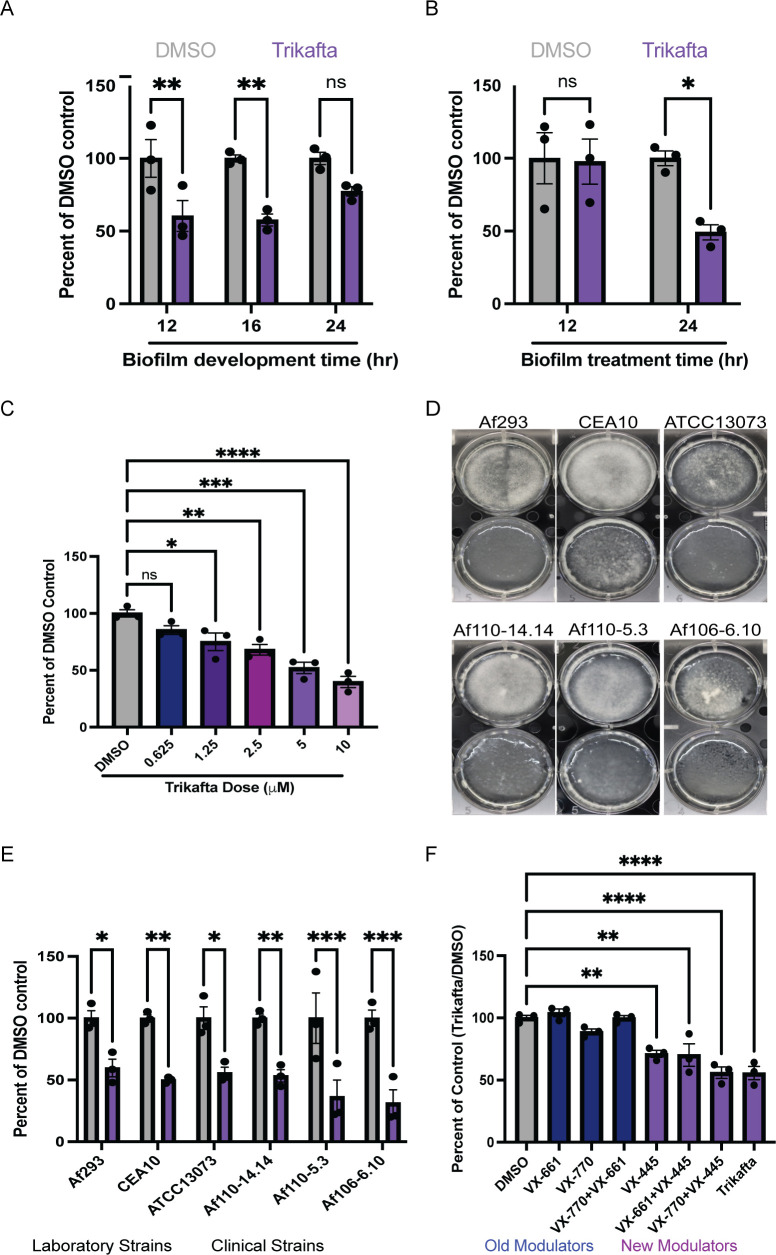
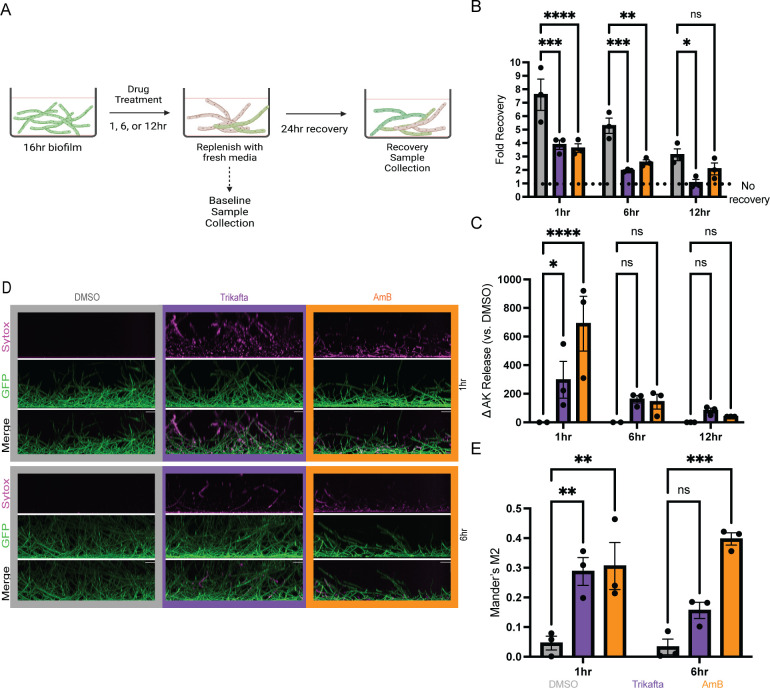
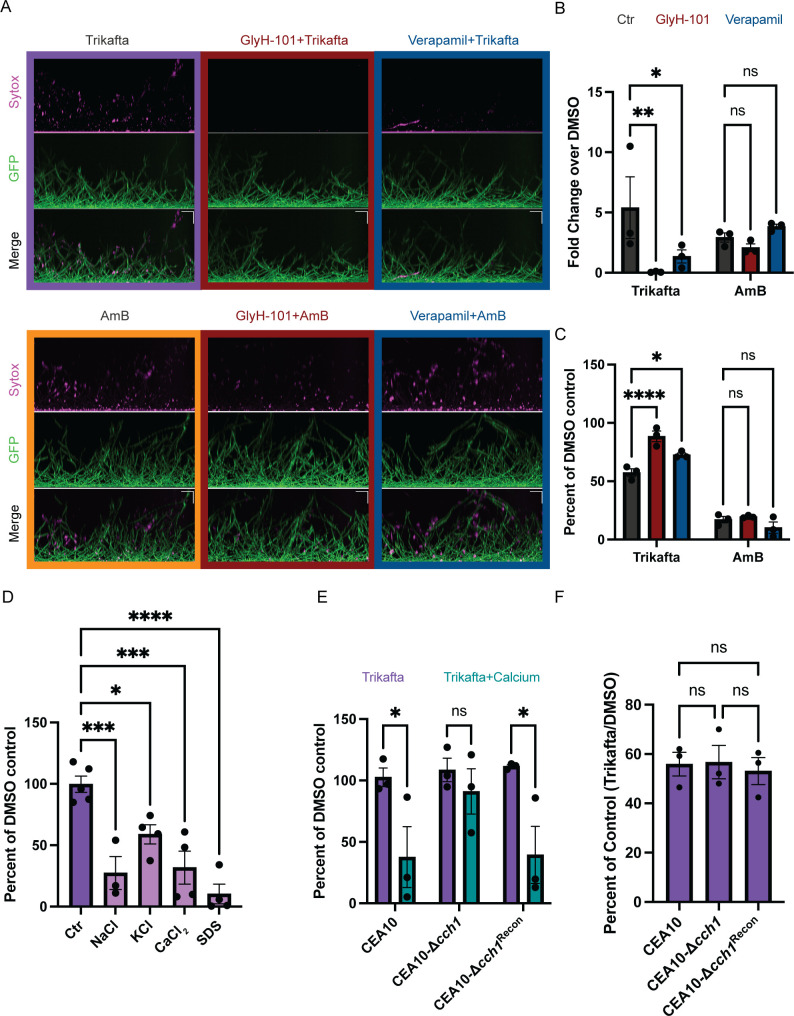
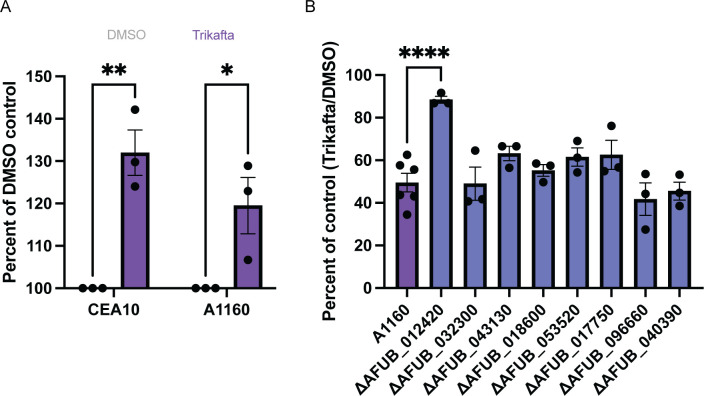
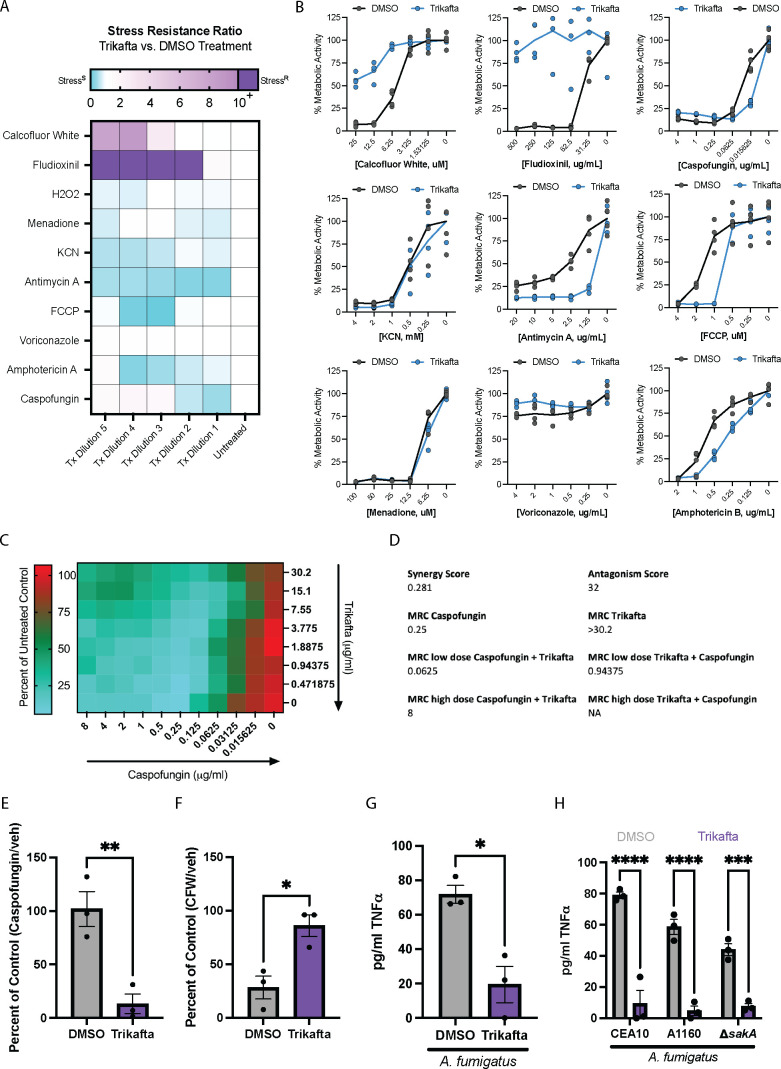
PwCF commonly test positive for pathogenic fungi, and more than 90% of the cystic fibrosis patient population is approved for the modulator treatment, Trikafta. Therefore, it is critical to understand how fungal communities, specifically A. fumigatus, respond to Trikafta exposure. Therefore, we sought to determine whether Trikafta impacted the biology of A. fumigatus biofilms. Our data demonstrate that Trikafta reduces biomass in several laboratory strains as well as clinical strains isolated from the expectorated sputum of pwCF. Furthermore, Trikafta reduces fungal viability and the capacity of biofilms to recover following treatment. Of particular importance, Trikafta affects how A. fumigatus biofilms respond to cell wall stressors, suggesting that Trikafta modulates components of the cell wall. Since the cell wall directly affects how a host immune system will respond to and effectively neutralize pathogens, our work, demonstrating that Trikafta impacts the A. fumigatus cell wall, is potentially highly relevant to fungal-induced disease pathogenesis.

Keywords: Aspergillus fumigatus; Trikafta; anti-fungal agents; cystic fibrosis; drug susceptibility.


Conflict of interest statement

The authors declare no conflict of interest

Figures

Fig 1
Fig 1
Trikafta reduces growth of both laboratory and clinical A. fumigatus biofilms. (A) CEA10 biofilms were grown in liquid glucose minimal medium (L-GMM) for 12, 16, or 24 hours. Media were removed and then fresh media with either DMSO (0.15%) or Trikafta (5 µM/molecule) were added for an additional 24 hours. Samples were collected, washed in water, and lyophilized. Dry biomass was measured, and all groups are represented as percentage of DMSO-treated average. (B) CEA10 biofilms were grown in L-GMM for 16 hours. Media were removed and then fresh media with either DMSO (0.15%) or Trikafta (5 µM/molecule) were added for an additional 12 or 24 hours. Samples were processed and graphically represented as in panel A. (C) CEA10 biofilms were grown in L-GMM for 16 hours. Media were removed, and then fresh media with either DMSO or the indicated dose of Trikafta (μM/molecule) were added for an additional 24 hours. Samples were processed and graphically represented as in panel A. (D) Biofilms of the indicated laboratory strains and clinical isolates were grown in L-GMM for 16 hours. Media were removed and then fresh media with either DMSO (0.15%) or Trikafta (5 µM/molecule) were added for an additional 24 hours, and images were taken. (E) Samples were processed and graphically represented as in panel A. (F) CEA10 biofilms were grown in L-GMM for 16 hours. Media were removed and then fresh media with either DMSO (0.15%), individual molecules, double combinations, or Trikafta (5 µM/molecule) were added for an additional 24 hours. Samples were processed and graphically represented as in panel A. For panels A, B, and E, a two-way analysis of variance (ANOVA) with Sidak’s multiple comparisons was used, and for panels C and F, a one-way ANOVA with Dunnett’s multiple comparisons with all groups compared to DMSO was used. Data points are three biological replicates, which represent the average of technical replicates. ns, not significant.
Fig 2
Fig 2
Trikafta reduces viability and increases membrane permeability of A. fumigatus biofilms. (A) Experimental design for viability assay (B) CEA10 biofilms were grown in L-GMM for 16 hours. Media were removed and then fresh media with either DMSO (0.15%), Trikafta (5 µM/molecule), or amphotericin B (AmB) (1 µg/mL) were added for an additional 1, 6, or 12 hours. Baseline samples were collected, and parallel biofilms had media removed and then replaced with fresh L-GMM for an additional 24 hours. Recovery biofilms were collected, washed in water, and lyophilized, and dry biomass was measured. Treatment groups were compared to their own controls, and data are represented as fold change from baseline control. (C) CEA10 biofilms were grown in L-GMM for 16 hours. Media were removed and then fresh media with either DMSO (0.15%), Trikafta (5 µM/molecule), or AmB (1 µg/mL) was added for an additional 1, 6, or 12 hours. Supernatant was collected and adenylate kinase (AK) was measured. Data are shown as percent change over DMSO controls (DMSO set to 100%) and then subtracting 100 to get a delta in adenylate kinase release. (D) CEA10-gpdA:GFP biofilms were grown in L-GMM for 16 hours. Media were removed and then fresh media with either DMSO (0.15%), Trikafta (5 µM/molecule), or AmB (1 µg/mL) were added for an additional 1 or 6 hours. Sytox Blue 1:1,000 was added for 5 minutes. Images were taken on Nikon spinning Disc confocal microscope ×20. (E) Images were quantified and represented as the fraction of GFP that overlaps with Sytox in each image (Mander’s M2). For (B, C, and E), a two-way ANOVA with Dunnett’s multiple comparisons was used, with both treatment groups compared to DMSO controls. Data points are three biological replicates, which represent the average of technical replicates.
Fig 3
Fig 3
Trikafta modulates ion channels in A. fumigatus biofilms. (A) CEA10-gpdA:GFP biofilms were grown in L-GMM for 16 hours. Media were removed and biofilms were treated with DMSO (control, 0.2%), verapamil (calcium channel inhibitor, 1 mM), or GlyH-101 (CFTR inhibitor, 20 µM) for 1 hour. Media with either DMSO (0.15%), Trikafta (final concentration 5 µM/molecule), or AmB (final concentration 1 µg/mL) was added for an additional 1 hour. Sytox Blue 1:1,000 was added for 5 minutes. Images were taken on Nikon spinning disc confocal microscope at ×20. (B) Images were quantified and represented as the fraction of GFP that overlaps with Sytox in each image (Mander’s M2), and data are represented as fold change over DMSO-treated control. (C) CEA10 biofilms were grown for 16 hours and media were removed. Fresh media with either DMSO (0.2%), GlyH-101 (20 µM), or verapamil (1 mM) was added for 1 hour. Subsequently, media with either DMSO (0.15%), AmB (final dose 1 µg/mL), or Trikafta (final dose 5 µM/molecule) was added for an additional 24 hours. Samples were processed and graphically represented as in Fig. 1A. (D) CEA10 biofilms were grown in L-GMM for 16 hours. Media were removed, and then fresh media with either DMSO (0.15%) or Trikafta (5 µM/molecule) were added in either vehicle control (H20) or 0.5M NaCl, CaCl2, or KCl or 0.002% SDS for an additional hour. Metabolic activity was measured using XTT assay. Data are normalized as percentage of Trikafta/DMSO controls in each condition. (E) Wild-type (WT) CEA10, CEA10-Δcch1, and CEA10-cch1rec biofilms were grown in L-GMM for 16 hours. Media were removed and then fresh media with either DMSO (0.15%) or Trikafta (5 µM/molecule) was added in either control or 0.5-M CaCl2 for an additional hour, and an XTT assay was performed. Data are normalized as percentage of Trikafta/DMSO controls in either vehicle control (H2O) or CaCl2. (F) WT CEA10, CEA10-Δcch1, and CEA10-cch1rec biofilms were grown in L-GMM for 16 hours. Media were removed, and then fresh media with either DMSO (0.15%) or Trikafta (5 µM/molecule) were added for an additional 24 hours. Samples were processed and graphically represented as in Fig. 1A. For B, C, and E, a two-way ANOVA with Dunnett’s (B and C) or Sidak’s (E) multiple comparisons was performed and a one-way ANOVA (D and F) with Dunnett’s (D) or Tukey’s (F) multiple comparisons was performed. Data points are three biological replicates, which represent the average of technical replicates.
Fig 4
Fig 4
Trikafta acutely increases metabolic activity in A. fumigatus biofilms. (A) CEA10 or A1160 biofilms were grown in L-GMM for 16 hours. Media were removed, and then fresh media with either DMSO (0.15%) or Trikafta (5 µM/molecule) were added for an additional 30 min. The metabolic dye, resazurin, was added 10% vol for an additional 5 hours after Trikafta treatment and fluorescence 594 was captured. A two-way ANOVA with Sidak’s multiple comparisons was used. Data points are three biological replicates, which represent the average of technical replicates. (B) Biofilms of the indicated kinase library mutant strains were grown in L-GMM for 16 hours. Media were removed, and then fresh media with either DMSO (0.15%) or Trikafta (5 µM/molecule) were added for an additional 24 hours. Samples were processed and graphically represented as in Fig. 1A. Three to six technical replicates are represented.
Fig 5
Fig 5
Trikafta activates SakA, and reduction of SakA activity increases resistance of A. fumigatus biofilms to Trikafta. (A) WT (A1160 and Afs35) and ΔsakA conidia (in both WT strains) were grown for 16 hours into biofilms. Media were removed, and then fresh media with either DMSO (0.15%) or Trikafta (5 µM/molecule) were added for an additional 24 hours and images were taken. (B) Samples were processed and graphically represented as in Fig. 1A. (C) WT A1160 and A1160-ΔsakA biofilms were grown in L-GMM for 16 hours. Media were removed, and then fresh media with either DMSO (0.15%) or Trikafta (5 µM/molecule) were added for an additional 12 hours. Supernatant was collected and adenylate kinase was quantified. Data are shown as percent change over DMSO controls (DMSO set to 100%) and then subtracting 100 to get a delta in AK release. (D) In parallel to panel C, metabolic activity of biofilms was measured by XTT. Data are represented as percentage of DMSO controls (Trikafta/DMSO). (E) TP9 and TP-9PBS2C1 biofilms were grown for 16 hours. Media were removed, and then fresh media with either DMSO (0.15%) or Trikafta (5 µM/molecule) were added for an additional 24 hours. Samples were processed and graphically represented as in Fig. 1A. (F) TP-9PBS2C1: sakA Flag biofilms were grown in L-GMM for 16 hours. Media were removed, and then fresh media with either DMSO (0.15%) or Trikafta (5 µM/molecule) were added for an additional 30 minutes. Biofilms were collected and protein extracted for Western blot analysis of either total SakA (Flag) or P-SakA. Samples were normalized to total protein and quantified using LI-COR. A two-way ANOVA with Sidak’s multiple comparisons (B and C) and Student’s t-test (D–F) were performed. Data points are three biological replicates, which represent the average of technical replicates.
Fig 6
Fig 6
Trikafta modulates the biofilm cell wall and mediates inflammatory responses in host immune cells. (A) CEA10 biofilms were grown in L-GMM for 16 hours. Media were removed, and then fresh media with either DMSO (0.15%) or Trikafta (5 µM/molecule) plus serial dilutions of the indicated stressors (CFW, Fludioxonil, caspofungin, KCN, antimycin A, FCCP, menadione, voriconazole, and AmB) were added for an additional 3 hours. Metabolic activity was measured by the reduction of the dye, XTT. Stress resistance ratio (Trikafta/DMSO controls) is represented by highly resistant (purple) through highly susceptible (blue) as a consequence of Trikafta co-treatment. (B) Graphs represent the percentage of stressor/control in the presence or absence of Trikafta. Data represent five technical replicates. (C) CEA10 biofilms were grown in L-GMM for 16 hours. Media were removed and then fresh media with serial two-fold dilutions of Trikafta [30.2 µg/mL(20 µM/molecule)−0.471875 µg/mL (0.3125 µM/molecule)] in checkerboard combination with serial two-fold dilutions of caspofungin (8 µg/mL −0.015625 µg/mL). Heat map represents percent of untreated control values, with higher metabolic activity indicated by red and lower indicated by green. Data are averages of three biological replicates. (D) Synergy and antagonism scores for caspofungin and Trikafta based on values generated in C. (MRC = Metabolic reduction concentration). (E) CEA10 biofilms were grown in L-GMM for 16 hours. Media were removed and then fresh media with either DMSO (0.15%) or Trikafta (5 µM/molecule) plus 0.015625 µg/mL caspofungin or (F) 12.5 µM CFW for 3 hours. An XTT assay was performed to determine metabolic activity, and data are shown as percentage of stressor/control in either DMSO or Trikafta. (G) Bone marrow cells were isolated from C57Bl/6 mice harboring dF508 mutation in cftr and seeded 1 × 10⁷/mL in co-culture with CEA10 conidia (1 × 1066/mL) for 16 hours in the presence of interferon gamma (IFN-γ) (10 ng/mL) with either DMSO (0.15%) or Trikafta (5 µM). 96 well plates were centrifuged and supernatants were analyzed for murine tumor necrosis factor alpha (TNF-α). (H) Bone marrow cells were isolated from WT C57Bl/6 mice and seeded 1 × 10⁷ /mL in co-culture with CEA10, A1160, or A1160-ΔsakA conidia (1 × 10⁶ /mL) for 16 hr in the presence of IFN-γ (10 ng/mL) with either DMSO (0.15%) or Trikafta (5 µM). Ninety-six-well plates were centrifuged and supernatants were analyzed for murine TNF-α. Student’s t-test was performed for panels E–G and a two-way ANOVA with Sidak’s multiple comparisons was performed for panel H. For panels C–H, data points are three biological replicates, which represent the average of technical replicates.

References

    1. Heijerman HGM, McKone EF, Downey DG, Van Braeckel E, Rowe SM, Tullis E, Mall MA, Welter JJ, Ramsey BW, McKee CM, Marigowda G, Moskowitz SM, Waltz D, Sosnay PR, Simard C, Ahluwalia N, Xuan F, Zhang Y, Taylor-Cousar JL, McCoy KS, VX17-445-103 Trial Group . 2019. Efficacy and safety of the elexacaftor plus tezacaftor plus ivacaftor combination regimen in people with cystic fibrosis homozygous for the F508del mutation: a double-blind, randomised, phase 3 trial. Lancet 394:1940–1948. doi: 10.1016/S0140-6736(19)32597-8 - DOI - PMC - PubMed
    1. Middleton PG, Mall MA, Dřevínek P, Lands LC, McKone EF, Polineni D, Ramsey BW, Taylor-Cousar JL, Tullis E, Vermeulen F, Marigowda G, McKee CM, Moskowitz SM, Nair N, Savage J, Simard C, Tian S, Waltz D, Xuan F, Rowe SM, Jain R, VX17-445-102 Study Group . 2019. Elexacaftor-tezacaftor-ivacaftor for cystic fibrosis with a single phe508del allele. N Engl J Med 381:1809–1819. doi: 10.1056/NEJMoa1908639 - DOI - PMC - PubMed
    1. Laselva O, Bartlett C, Gunawardena TNA, Ouyang H, Eckford PDW, Moraes TJ, Bear CE, Gonska T. 2021. Rescue of multiple class II CFTR mutations by elexacaftor+ tezacaftor+ivacaftor mediated in part by the dual activities of elexacaftor as both corrector and potentiator. Eur Respir J 57:2002774. doi: 10.1183/13993003.02774-2020 - DOI - PMC - PubMed
    1. Filkins LM, O’Toole GA. 2015. Cystic fibrosis lung infections: polymicrobial, complex, and hard to treat. PLoS Pathog 11:e1005258. doi: 10.1371/journal.ppat.1005258 - DOI - PMC - PubMed
    1. Kanj A, Abdallah N, Soubani AO. 2018. The spectrum of pulmonary aspergillosis. Respir Med 141:121–131. doi: 10.1016/j.rmed.2018.06.029 - DOI - PubMed

Substances