. 2023 Oct 13:12:RP88459.
doi: 10.7554/eLife.88459.

Deciphering neuronal deficit and protein profile changes in human brain organoids from patients with creatine transporter deficiency

Affiliations

Deciphering neuronal deficit and protein profile changes in human brain organoids from patients with creatine transporter deficiency

Léa Broca-Brisson et al. Elife. .

Abstract

Creatine transporter deficiency (CTD) is an X-linked disease caused by mutations in the SLC6A8 gene. The impaired creatine uptake in the brain results in intellectual disability, behavioral disorders, language delay, and seizures. In this work, we generated human brain organoids from induced pluripotent stem cells of healthy subjects and CTD patients. Brain organoids from CTD donors had reduced creatine uptake compared with those from healthy donors. The expression of neural progenitor cell markers SOX2 and PAX6 was reduced in CTD-derived organoids, while GSK3β, a key regulator of neurogenesis, was up-regulated. Shotgun proteomics combined with integrative bioinformatic and statistical analysis identified changes in the abundance of proteins associated with intellectual disability, epilepsy, and autism. Re-establishment of the expression of a functional SLC6A8 in CTD-derived organoids restored creatine uptake and normalized the expression of SOX2, GSK3β, and other key proteins associated with clinical features of CTD patients. Our brain organoid model opens new avenues for further characterizing the CTD pathophysiology and supports the concept that reinstating creatine levels in patients with CTD could result in therapeutic efficacy.

Keywords: brain; cell biology; cortex; human; neurogenesis; neuroscience.


Conflict of interest statement

LB, RH, CD, OM, RG, AM, NC, AG, BS, AA, MS, LM, FY, JA, RH, AM No competing interests declared

Figures
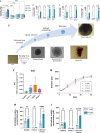
Figure 1.
Figure 1.. Generation and characterization of human creatine transporter deficiency (CTD) brain organoids.
(A) Intracellular concentration of creatine in CTD iPSCs after 1 hr incubation with creatine-supplemented media. Healthy control is BJ. n=3–4, one-way ANOVA, Tukey’s multiple comparison test. (B–D) Intracellular concentration of creatine in CTD-rescue iPSCs CTD1-4 (B), CTD2-3 (C), and CTD3-7 (D) after 1 hr of incubation with creatine-supplemented media. Healthy controls are BJ and SP. n=3, two-way ANOVA, Šídák’s multiple comparisons test. (E) Schematic protocol of brain organoid development from iPSCs. Representative images are shown for each stage. Scale bar: 200 µm. (F) Relative mRNA expression of the telencephalon marker SIX3. n=6–10 (G) Quantification of the diameters of healthy (BJ) and pathological brain organoids at different time points. n=2–22 brain organoids per production, 4–6 productions per cell line. (H–I) Intracellular concentration of creatine in brain organoids and CTD-rescue brain organoids CTD1-4 (H) and CTD3-7 (I) after 6 h of incubation in creatine-supplemented media. Healthy controls are BJ and SP. n=2–4, two-way ANOVA, Šídák’s multiple comparisons test.
Figure 1—figure supplement 1.
Figure 1—figure supplement 1.. Generation of creatine transporter deficiency (CTD) iPSCs.
(A) Real-time PCR (RT-qPCR) of pluripotency markers SOX2, NANOG, and OCT4 in fibroblasts (PK and CTD1, 2, and 3) and iPSCs (BJ and CTD1-4, 2–3, and 3–7). n=1–3. (B) Representative analysis of SSEA4 and TRA1-60 expression for each iPSC line by flow cytometry. SSEA4 is compared with the appropriate mouse IgG3 control, and TRA1-60 is compared with unlabeled cells. Control: gray line; test: red and green line. (C) Generation of all three germ cell layer components within teratomas from each iPSC line (endoderm, mesoderm, ectoderm). Whole sections of teratoma were performed 5–10 weeks of growth and stained with hematoxylin and eosin. Scale bar = 50 µm.
Figure 1—figure supplement 2.
Figure 1—figure supplement 2.. Generation of creatine transporter deficiency (CTD)-rescue iPSCs.
(A) The p10-CAG-SLC6A8-IRES2-eGFP vector used for transfection. (B) FACS analysis of transfected cells according to pluripotency marker SSEA4 (RL1-H) and green fluorescent protein (GFP) (BL1-H). (C) Representative image of a 2 month old brain organoid tissue section from CTD rescue cell line showing endogenous eGFP fluorescence. DAPI marks nuclei in blue. Scale bar: 200 µm.
Figure 1—figure supplement 3.
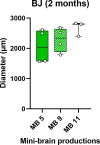
Figure 1—figure supplement 3.. Assessment of brain organoids variability.
Diameter of healthy BJ brain organoids obtained from three different productions.
Figure 2.
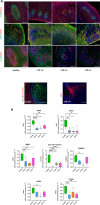
Figure 2.. Creatine transporter deficiency (CTD) brain organoid organization and neurogenesis deficit.
(A) Representative images of 2 month old brain organoid tissue sections immunostained for PAX6 (radial glial cell and forebrain marker), MAP2 (neuronal marker), PSD95 (post-synaptic marker), TBR1 (immature neuron marker), NeuN (neuronal marker), SOX2 (radial glial cell marker), β-III tubulin (intermediate progenitor marker), GFAP (astrocyte marker). DAPI marks nuclei in blue. Scale bar: 200 µm (B) Relative mRNA expression of PAX6 and SOX2 (radial glial cell markers), GRIA2 and vGluT1 (glutamatergic markers), GABBR1 (GABAergic marker), PSD95 (post-synaptic marker) and CREB. n=3–6, one-way ANOVA, Tukey’s multiple comparison test.
Figure 2—figure supplement 1.
Figure 2—figure supplement 1.. Neurogenesis deficit in a creatine transporter deficiency (CTD) mouse model.
Relative mRNA expression of SOX2 (radial glial cell markers) in whole brains of postnatal day 0 Slc6a8-/y mice. n=8 Slc6a8+/y, 7 Slc6a8-/y mice. Data was analyzed using a two-tailed t-test on 2-(ΔΔCt) values with mean ΔCt of Slc6a8+/y mice used as the control value. t(13)=4.527, p=0.0006.
Figure 3.
Figure 3.. Unsupervised hierarchical clustering, reproducibility plots, principal component analysis (PCA), volcano plots, and Venn diagram showing overlap of the proteins.
(A–R) The degree and quality of the separation of the data between the various groups being compared Healthy (BJ) vs creatine transporter deficiency (CTD)-derived brain organoids (CTD1_4); Healthy (BJ) vs CTD-derived brain organoids (CTD2_3); Healthy (BJ) vs CTD-derived brain organoids (CTD3_7) was assessed using unsupervised hierarchical clustering, reproducibility plots and PCA, and the differentially expressed proteins were visualized using volcano plots. (S–U) Venn diagram showing overlap of the differentially expressed proteins between healthy and CTD-derived brain organoids identified using a modification of the R package for ROTS. (S) Venn diagrams for all proteins differentially expressed between BJ and CTD organoids. (T) Venn diagrams for proteins downregulated in CTD compared to BJ organoids. (U) Venn diagrams for proteins upregulated in CTD compared to BJ organoids.
Figure 3—figure supplement 1.
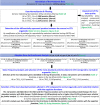
Figure 3—figure supplement 1.. Flowchart diagram depicting the entire bioinformatics analysis workflow.
The raw data generated by MS/MS was normalized and filtered. The proteins significantly altered in the three creatine transporter deficiency (CTD)-derived cerebral organoids in comparison with healthy cerebral organoids were identified using a modification of the R package for ROTS. Absolute gene set enrichment analysis (GSEA) was performed in order to identify the enriched pathways in CTD-derived brain organoids in comparison with healthy cerebral organoids and the list of enriched genes was identified. Their recurrence or frequency in other pathways among all studied gene sets was searched. The frequency analysis identified 142 differentially expressed proteins occurring frequently across all enriched pathways. The 142 proteins identified were then subjected to a disease-related pathway analysis carried out using Enrichr followed by a frequency analysis in order to identify potential functions of the differentially expressed proteins. To further reduce the set of available proteins, the 142 proteins identified from the GSEA and the Frequency analysis were then sorted according to fold change; the most abundant proteins with fold change (–3+3) and a sc higher than 10 were retained. 32 most altered and abundant proteins were found to be significantly altered in CTD-derived cerebral organoids compared to normal organoids.
Figure 4.
Figure 4.. Representation of heatmaps and graphs obtained by the absolute gene set enrichment analysis (GSEA) for significant pathways with enrichment scores.
(A–C) Enrichment score and graphical representation for the GSEA for healthy vs creatine transporter deficiency (CTD)-derived brain organoids obtained across the gene sets c2_cp; c3_tft; c4_cgn; c5_bp; c5_mf; c7.
Figure 5.
Figure 5.. Heatmap, STRING interaction, and GO molecular functional analysis.
(A) Heatmap showing expression levels of the 142 proteins in the top 90 percentile. (B) Heatmap showing expression levels of 32 most altered and abundant proteins were found to be significantly altered in CTD-derived cerebral organoids compared to normal organoids. (C) STRING interaction of the 30 proteins selected. (D) GO Molecular Functional analysis obtained using Enrichr on the 32 proteins.
Figure 6.
Figure 6.. Relationship between GSK3β and neurogenesis deficit.
(A–B) Representative western blot of GSK3β and pSer9-GSK3β in creatine transporter deficiency (CTD) vs healthy brain organoids (A) and graph showing analysis of P-GSK3β/GSK3β ratio (B). n=8, one-way ANOVA, Dunnett’s multiple comparison test. (C–D) Representative western blot of SOX2 in CTD vs healthy brain organoids (C) and graph showing analysis of SOX2 relative expression (D). n=8, one-way ANOVA, Tukey’s multiple comparison test. (E–L) Representative western blot of PAK1 (E), MAP1B (G), GSK3β and pSer9-GSK3β (I), and SOX2 (K) in brain organoids obtained from CTD iPSCs and CTD-rescue iPSCs (CTD 1–4), and graphs showing analysis of PAK1 (F), MAP1B (H), P-GSK3β/GSK3β ratio (J), SOX2 (L) relative expression. n=2–8, one-way ANOVA, Dunnett’s multiple comparison test. (I and J) the lanes were run on the same gel but were noncontiguous.
Figure 7.
Figure 7.. Schematic presentation of the main findings of the study.
The decrease in the cerebral creatine pool could favor the accumulation of the dephosphorylated form of GSK3β, making it more active. This kinase has many targets in the cell, including transcription factors whose activity it can modulate. This modulation will in turn modify the expression of genes, which can influence several cellular processes: the reorganization of microtubules with the regulation of MAP1B, synaptic function, and neurogenesis thus affecting the functionality of brain cells and consequently cognitive functions. The alteration of neurons could also be explained by a mitochondrial dysfunction due to the decrease of creatine levels and the modulation of GSK3β activity, which is known to regulate mitochondrial activity.

Update of

  • doi: 10.1101/2023.06.01.543271
  • doi: 10.7554/eLife.88459.1
  • doi: 10.7554/eLife.88459.2

References

    1. Baroncelli L, Alessandrì MG, Tola J, Putignano E, Migliore M, Amendola E, Gross C, Leuzzi V, Cioni G, Pizzorusso T. A novel mouse model of creatine transporter deficiency. F1000Research. 2014;3:228. doi: 10.12688/f1000research.5369.1. - DOI - PMC - PubMed
    1. Bruun TUJ, Sidky S, Bandeira AO, Debray F-G, Ficicioglu C, Goldstein J, Joost K, Koeberl DD, Luísa D, Nassogne M-C, O’Sullivan S, Õunap K, Schulze A, van Maldergem L, Salomons GS, Mercimek-Andrews S. Treatment outcome of creatine transporter deficiency: international retrospective cohort study. Metabolic Brain Disease. 2018;33:875–884. doi: 10.1007/s11011-018-0197-3. - DOI - PubMed
    1. Cecil KM, Salomons GS, Ball WS, Wong B, Chuck G, Verhoeven NM, Jakobs C, DeGrauw TJ. Irreversible brain creatine deficiency with elevated serum and urine creatine: a creatine transporter defect? Annals of Neurology. 2001;49:401–404. doi: 10.1002/ana.79. - DOI - PubMed
    1. Chen EY, Tan CM, Kou Y, Duan Q, Wang Z, Meirelles GV, Clark NR, Ma’ayan A. Enrichr: interactive and collaborative HTML5 gene list enrichment analysis tool. BMC Bioinformatics. 2013;14:128. doi: 10.1186/1471-2105-14-128. - DOI - PMC - PubMed
    1. Chen HR, Zhang-Brotzge X, Morozov YM, Li Y, Wang S, Zhang HH, Kuan IS, Fugate EM, Mao H, Sun YY, Rakic P, Lindquist DM, DeGrauw T, Kuan CY. Creatine transporter deficiency impairs stress adaptation and brain energetics homeostasis. JCI Insight. 2021;6:e140173. doi: 10.1172/jci.insight.140173. - DOI - PMC - PubMed

Publication types

MeSH terms

Supplementary concepts