Clinical Trial
. 2023 Dec;9(12):2459-2474.
doi: 10.1016/j.jacep.2023.08.027. Epub 2023 Oct 11.

Phase 2 Re-Entry Without Ito: Role of Sodium Channel Kinetics in Brugada Syndrome Arrhythmias

Affiliations
Clinical Trial

Phase 2 Re-Entry Without Ito: Role of Sodium Channel Kinetics in Brugada Syndrome Arrhythmias

Zhaoyang Zhang et al. JACC Clin Electrophysiol. 2023 Dec.

Abstract

Background: In Brugada syndrome (BrS), phase 2 re-excitation/re-entry (P2R) induced by the transient outward potassium current (Ito) is a proposed arrhythmia mechanism; yet, the most common genetic defects are loss-of-function sodium channel mutations.

Objectives: The authors used computer simulations to investigate how sodium channel dysfunction affects P2R-mediated arrhythmogenesis in the presence and absence of Ito.

Methods: Computer simulations were carried out in 1-dimensional cables and 2-dimensional tissue using guinea pig and human ventricular action potential models.

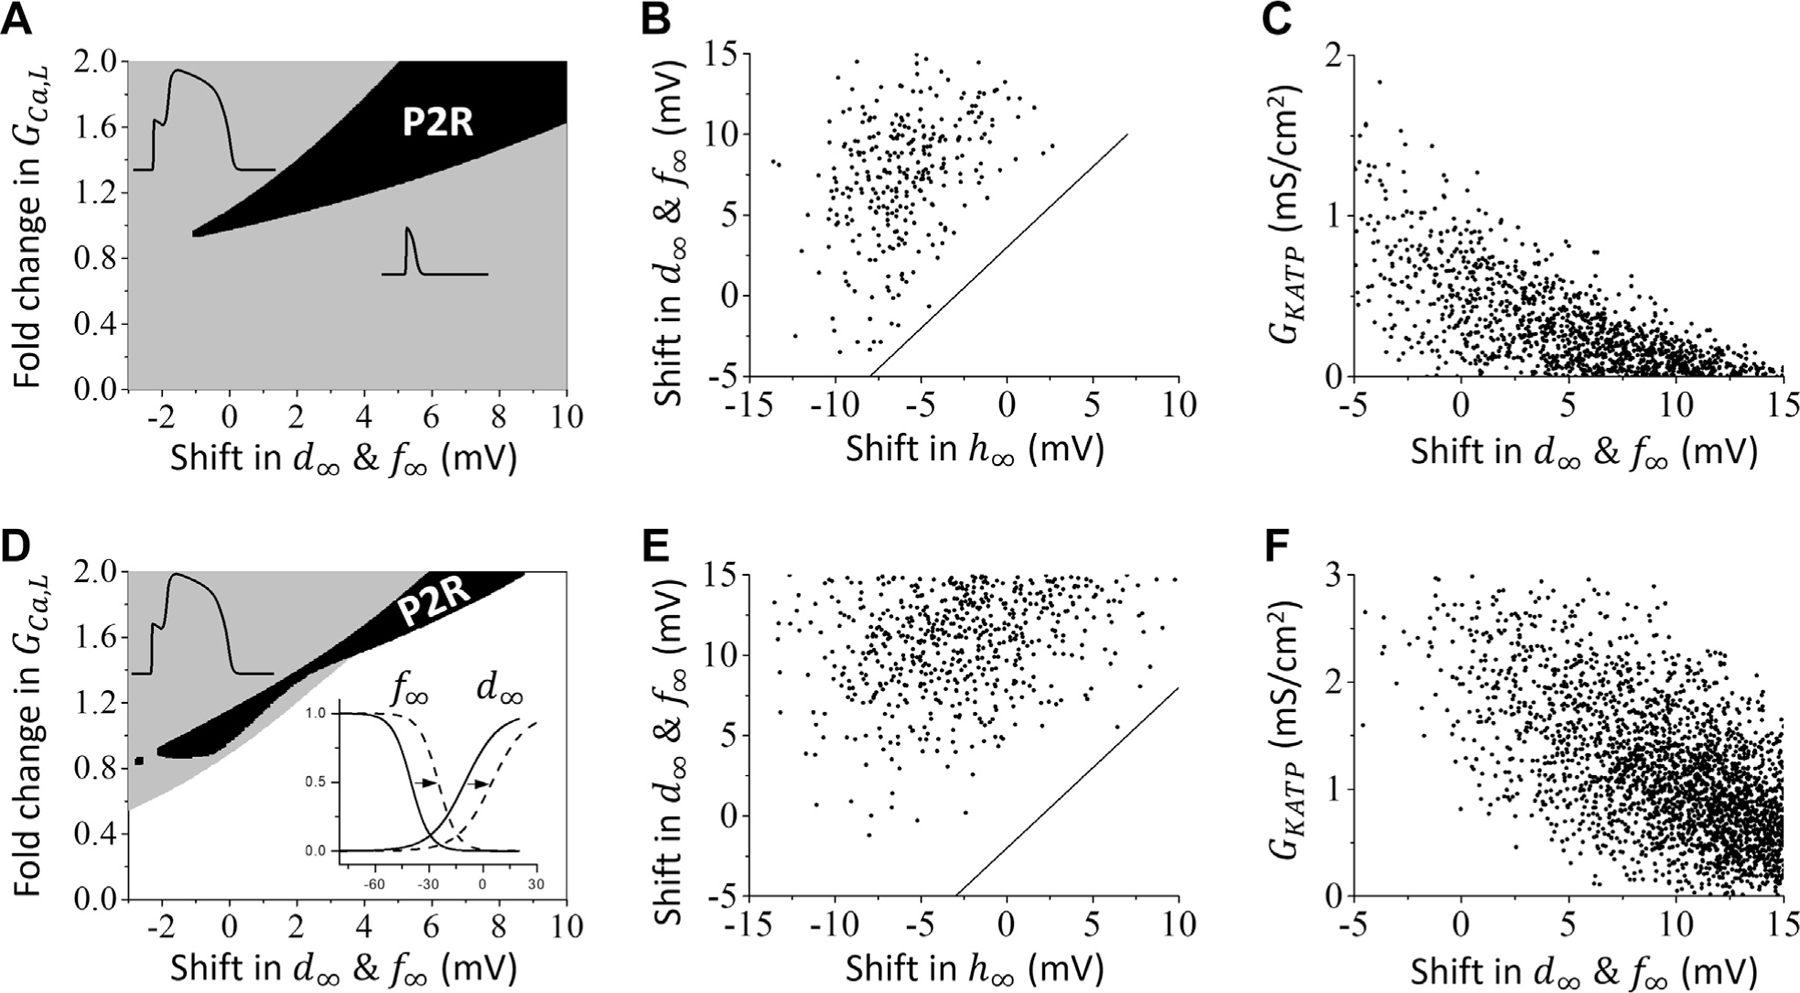
Results: In the presence of Ito sufficient to generate robust P2R, reducing sodium current (INa) peak amplitude alone only slightly potentiated P2R. When INa inactivation kinetics were also altered to simulate reported effects of BrS mutations and sodium channel blockers, however, P2R occurred even in the absence of Ito. These effects could be potentiated by delaying L-type calcium channel activation or increasing ATP-sensitive potassium current, consistent with experimental and clinical findings. INa-mediated P2R also accounted for sex-related, day and night-related, and fever-related differences in arrhythmia risk in BrS patients.

Conclusions: Altered INa kinetics synergize powerfully with reduced INa amplitude to promote P2R-induced arrhythmias in BrS in the absence of Ito, establishing a robust mechanistic link between altered INa kinetics and the P2R-mediated arrhythmia mechanism.

Keywords: Brugada syndrome; phase 2 re-entry; sodium channel blocker; sodium channel mutation.


Conflict of interest statement

Funding Support and Author Disclosures This study was supported by National Institutes of Health grants R01 HL134709, R01 HL133294, P01 HL164311, and R01 HL157116. Dr Zhang was supported by the National Natural Science Foundation of China Grants No. 12375033, No. 12235007 and No. 11975131, Zhejiang Provincial Natural Science Foundation of China under Grant No. LY23A050002; and K. C. Wong Magna Fund at Ningbo University. The authors have reported that they have no relationships relevant to the contents of this paper to disclose.

Figures

FIGURE 1
FIGURE 1
Brugada Syndrome and Ito-Mediated P2R (A) ECG showing J-point elevation with corresponding monophasic AP recordings from the epicardial and endocardial RVOT in a BrS patient. (B) Phase diagram showing conduction behaviors in a heterogeneous 1-dimensional cable of the LRd model. Solid region = P2R. Gray region = conduction with a spike-and-dome AP (left side of P2R), or a spike AP (right side of P2R). White region = conduction failure. (C) Examples of conduction patterns from different regions marked by the symbols in B, where GNa=12 mS/cm2 and Gto=1.5 mS/cm2 (square), 1.7 mS/cm2 (triangle), and 1.9 mS/cm2 (diamond), respectively. The symbol “*” indicates P2R conduction. The cable was heterogeneous, in which the parameters in the first 50 cells were kept at control values and the maximal conductances of INa and Ito (GNa and Gto, respectively) were varied in the remaining 250 cells to obtain the phase diagram in B. P2R = phase 2 re-excitation.
FIGURE 2
FIGURE 2
INa-Mediated P2R (When Gto=0) and Comparison of Spike-and-Dome AP Morphology With Ito-Mediated P2R In all simulations, a single stimulus was given a t=0 at the top end of the cable. (A) Time-space plot of voltage during normal conduction. The parameters are the same as in the original model except that GK1=4.865 mS/cm2 and Gto=0. We also added IKATP to the model with GKATP=0.3 mS/cm2. (B) Time-space plot of voltage during P2R (marked by *) when the Na channel properties are altered from A as follows: GNa=3.71 mS/cm2, m shifted −10 mV, h shifted −8 mV, and τh is 0.5-fold of the original value. Note that the changes in Na channel kinetics are similar to the changes caused by SCN5A mutations R1215W and A1924T shown by Rook et al. (C) Another example of P2R in which the INa-mediated spike fails to propagate beyond the middle of the cable, for the same parameters as in B but with GNa=3.12 mS/cm2. (D) Another example for a different parameter set in which multiple INa-mediated P2R episodes occur. GNa=10.39 mS/cm2, GKATP=0.6 mS/cm2, m shifted −10 mV, h shifted 0 mV, and τm 5-fold and τh 0.13-fold of the original values. (E) Ito-mediated spike-and-dome AP morphology (above), INa (middle), and ICa,L (below) versus time for Gto=0 (solid trace), Gto=0.6 mS/cm2 (red trace), and Gto=0.75 mS/cm2 (green trace). (F) Same format for INa-mediated spike-and-dome AP morphology (Gto=0). The solid traces are the same as the control case as in E. The parameters are the same as for B except for GNa=3.71 mS/cm2 (red trace) or 2.97 mS/cm2 (green trace). In E and F, data were recorded from the middle of the cable. For viewing purposes, there is a 10-ms shift between the traces. AP = action potential; P2R = phase 2 re-excitation.
FIGURE 3
FIGURE 3
Effects of Na Channel Properties on P2R Formation in a 1-Dimensional Cable (TP04 Model) (A) Phase diagram showing conduction behaviors when the voltage shift in h and GNa were varied while all other parameters were kept the same as in Figure 2B. The solid region indicates P2R, the gray region is conduction without P2R (including conduction with spike-and-dome AP or spike AP as indicated in B), and the white region is conduction failure. (B) The analogous phase diagram showing conduction behaviors when the parameters τh and GNa were varied. (C) The analogous phase diagram showing conduction behaviors when the voltage shift in m and GNa were varied. (D) The analogous phase diagram showing conduction behaviors when the parameters τm and GNa were varied. (E) For parameter sets exhibiting P2R, the value of the parameter τh is plotted against the voltage shift of the parameter h. The straight line is a linear regression of the data set. (F) Same as E, but plotting the voltage shift in m against the voltage shift in h. The equation of the straight line is: ΔV1/2h=1.5ΔV1/2m7.5mV. (G) Same as E, but plotting τh against the voltage shift in m. (H) Phase diagram showing conduction behaviors when the parameters τj and GNa were varied. In the original TP04 model, V1/2 for m is −56.86 mV and V1/2 for h is −71.55 mV. AP = action potential; P2R = phase 2 re-excitation.
FIGURE 4
FIGURE 4
Effects of INa Recovery From Inactivation on P2R (A) Normal INa recovery kinetics using the control value of parameter τj. (B) Slowed INa recovery kinetics using twice the control value of τj. For all simulations, GNa=5.19 mS/cm2, GCa,L is 1.1-fold of the original value, and other parameters are the same as in Figure 2B. The simulations were started with the same initial conditions, and the first beats in all cases are identical. The pacing cycle lengths are marked on each part of the figure. The onset of P2R occurs at a longer pacing cycle length when INa recovery from inactivation is slower. P2R = phase 2 re-excitation.
FIGURE 5
FIGURE 5
Re-Entry Initiation in INa-Mediated P2R in 2D Tissue (A) Voltage snapshots showing spontaneous formation of re-entry (Video 1). Arrows indicate the propagating wavefront directions, and * indicates the origin of a spontaneous PVC (with the first one occurring at around 200 ms). Spiral wave re-entry first forms around 500 ms, and new ones repeatedly form via the same process. The dashed lines in the first part mark the boundary for normal (upper and right) and altered (lower and left) Na channel properties. (B) Time-space plot of voltage from the vertical line through the center of the 2D tissue. The 2D tissue is isotropic tissue with the tissue size of 9.6 × 9.6 cm2 (= 640 × 640 cells). The parameters in the right and top regions (x >8.85 cm or y>8.85 cm, marked by the dashed lines) are the same as normal control (the same as for Figure 2A). In the lower left region (x <8.85 cm and y <8.85 cm), the parameters are the same as in Figure 2D except that the fold change in τh is nonuniform in this region (ie, the fold change in τh is 0.05+0.08y/8.85). A single pacing stimulus was given to the upper border of the tissue at t=0 ms as marked on B. 2D = 2-dimensional; P2R = phase 2 re-excitation.
FIGURE 6
FIGURE 6
Effects of L-Type Ca Channel Properties on INa-Mediated P2R (A) Phase plot of conduction behaviors when the voltage shift in d & f and the parameter GCa,L are varied while all other parameters are kept the same as in Figure 2B. The solid region indicates P2R; the gray region indicates conduction without P2R (including conduction with normal AP, spike-and-dome AP, or spike AP); the white region indicates conduction failure. (B) For the same parameter sets giving rise to P2R as in Figures 3E to 3G (excluding those with τh<0.5-fold of the original value), the plot shows the relationship between the voltage shifts in h and d & f. The equation of the straight line is: ΔV1/2d&f=ΔV1/2h+3mV. (C) Same as B, but showing the relationship between the voltage shift in d & f and GKATP. (D to F) Same as A to C but using the LRd model in place of the TP04 model. The equation of the straight line in E is: ΔV1/2d&f=ΔV1/2h2mV. P2R = phase 2 re-excitation.
FIGURE 7
FIGURE 7
Sex Differences and Day-Night Effects on INa-Mediated P2R Phase plots of P2R regions (blue = male; red = female). The horizontal axis represents the fold-change in GCa,L (with 1.0-fold corresponding to the different male and female baseline values), and the vertical axis represents the value of the parameters: (A) GNa. (B) GKs. (C) GKr. (D) GKATP. All other parameters were held constant at their sex-specific values. Note that in comparison with to female individuals, a lesser-fold reduction in GCa,L is required to elicit P2R in male individuals, consistent with their increased susceptibility to P2R, especially at night, when GCa,L is typically at its nadir owing to circadian factors and low sympathetic tone. P2R = phase 2 re-excitation.
CENTRAL ILLUSTRATION
Sodium Channel Mutations or Blockers Result in Spike-and-Dome Action Potential Morphology and Phase 2 Re-Entry.

Comment in

References

    1. Antzelevitch C, Brugada P, Brugada J, et al. Brugada syndrome: a decade of progress. Circ Res 2002;91:1114–1118. - PubMed
    1. Sieira J, Dendramis G, Brugada P. Pathogenesis and management of Brugada syndrome. Nat Rev Cardiol 2016;13:744–756. - PubMed
    1. Brugada J, Campuzano O, Arbelo E, Sarquella-Brugada G, Brugada R. Present status of Brugada syndrome. J Am Coll Cardiol 2018;72:1046–1059. - PubMed
    1. Wilde AAM, Postema PG, Di Diego JM, et al. The pathophysiological mechanism underlying Brugada syndrome: depolarization versus repolarization. J Mol Cell Cardiol 2010;49:543–553. - PMC - PubMed
    1. Nademanee K, Wilde AAM. Repolarization versus depolarization defects in Brugada syndrome. J Am Conll Cardiol EP 2017;3:364–366. - PubMed

Publication types