. 2023 Dec 4;220(12):e20230209.
doi: 10.1084/jem.20230209. Epub 2023 Oct 13.

The CD4+ T cell repertoire specific for citrullinated peptides shows evidence of immune tolerance

Affiliations

The CD4+ T cell repertoire specific for citrullinated peptides shows evidence of immune tolerance

Matthew K McElwee et al. J Exp Med. .

Abstract

Rheumatoid arthritis occurs most often in people who express HLA-DR molecules containing a five aa "shared epitope" in the β chain. These MHCII molecules preferentially bind citrullinated peptides formed by posttranslational modification of arginine. Citrullinated peptide:HLA-DR complexes may act as arthritis-initiating neo-antigens for CD4+ T cells. Here, we used fluorophore-conjugated HLA-DR tetramers containing citrullinated peptides from human cartilage intermediate layer protein, fibrinogen, vimentin, or enolase 1 to track cognate CD4+ T cells. Immunization of HLA-DR transgenic mice with citrullinated peptides from vimentin or enolase 1 failed to cause any expansion of tetramer-binding cells, whereas immunization with citrullinated peptides from cartilage intermediate layer protein or fibrinogen elicited some expansion. The expanded tetramer-binding populations, however, had lower T helper 1 and higher regulatory T cell frequencies than populations elicited by viral peptides. These results indicate that HLA-DR-bound citrullinated peptides are not neo-antigens and induce varying degrees of immune tolerance that could pose a barrier to rheumatoid arthritis.


Conflict of interest statement

Disclosures: The authors declare no competing interests exist.

Figures

Figure 1.
Figure 1.
Exchange of HAp into CLIP(T):DR4 tetramer. (A) Contour plot of side scatter area (SSC-A) versus width (SSC-W) for a spleen and lymph node sample that was enriched with a DR4 tetramer with a gate on singlets. (B) Contour plot of cells from A with a gate on cells that bound CD4 antibody but not a cocktail of antibodies specific for non-T cell markers CD11b, F4/80, CD11c, B220, or CD14. (C–G) Contour plots of CD44 versus tetramer staining for CD4+ T cells from the gate in B for split samples of SLO from DR4 Tg mice immunized with HAp in CFA and enriched with the indicated DR4 tetramers 7 d after immunization. Percentages of cells in each quadrant are shown on each plot. The total number of tetramer-binding cells in each sample is shown below each plot. Similar results were obtained in an independent replicate experiment.
Figure 2.
Figure 2.
Exchange of peptides into plate-bound CLIP(T):DR4 molecules. Mean OD 405 values ± SD (n = 2 from two independent experiments) from ELISA plate wells coated with thrombin-treated CLIP(T):DR4 molecules and exposed to the indicated concentrations of the indicated FITC-labeled peptides, HRP-conjugated FITC antibody, and color morphing HRP sensitive substrate. The curve for HAp binding is shown in each panel for comparison purposes.
Figure 3.
Figure 3.
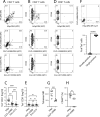
CD4+ T cells specific for DR4-binding citrullinated peptides show signs of clonal deletion. Cell enrichment and flow cytometry were performed on SLO cells from unmanipulated DR4 Tg mice after staining with a 50:50 mixture of DR4/SA-APC and DR4/SA-PE tetramers loaded with the same indicated peptide. CD4+ non-T cell lineage cells in the enriched fraction were identified as in Fig. 1, A and B. (A) Peptide:DR4/SA-APC versus peptide:DR4/SA-PE tetramer binding to CD4+ non-T cell lineage cells. Cells that bound to both tetramers (upper right quadrant) are assumed to bind via their TCRs. Percentages of cells in each quadrant are shown on each plot. Plots show concatenated data from three mice for HAp:DR4 tetramers and four mice for CILP cit988:DR4 and Eno cit15:DR4 tetramers. (B) CD44 versus peptide:DR4/SA-PE tetramer staining for cells from a Boolean gate on the upper right and lower left quadrants of A. (C) Total number (log 10) of tetramer-binding CD4+ T cells from SLOs of unmanipulated DR4 Tg mice after enrichment with DR4 tetramers containing the indicated peptides (HAp, n = 6, CILP cit988 and Eno cit15, n = 7 from two independent experiments). The values for samples from individual mice are shown with the horizontal bars representing the mean values, numerical values for which are also shown above each group. Earlier research showed that the limit of detection of MHCII tetramer-based cell enrichment is three cells per mouse (shown with the dashed line). Thus, any value that was ≤3 was set to three on the log 10 plots. (D) CD44 versus peptide:DR4/SA-PE tetramer staining for cells from a Boolean gate on the upper right and lower left quadrants of a plot of peptide:DR4/SA-APC versus peptide:DR4/SA-PE tetramer binding to CD8+ non-T cell lineage cells. (E) Total number (log 10) of tetramer-binding CD8+ T cells from SLOs of unmanipulated DR4 Tg mice after enrichment with DR4 tetramers containing the indicated peptides (HAp, n = 6, CILP cit988 and Eno cit15, n = 7 from two independent experiments). (F) CILP cit988:DR4/SA-APC versus HAp:DR4/SA-PE-Cy7 tetramer binding to CD4+ non-T cell lineage cells from samples enriched with both tetramers. Cells that bound to single tetramers (upper left and lower right quadrants) are assumed to bind via their TCRs. Percentages of tetramer-binding cells in enriched samples from individual mice (n = 5) that bound to either CILP cit988:DR4/SA-APC or HAp:DR4/SA-PE-Cy7 tetramers (single positive) or both (double positives) are shown in the lower panel. (G) Mean fluorescence intensity (MFI) of tetramer staining of CD4+ T cells from samples from individual mice enriched with DR4 tetramers containing the indicated peptides (HAp, n = 6, CILP cit988, n = 5 from two independent experiments). (H) Percentages of CD44low naïve-phenotype CD4+ T cells in enriched samples that bound to DR4 tetramers containing the indicated peptides (HAp, n = 6, CILP cit988, n = 6 from two independent experiments). Values on scatter plots were compared with one-way ANOVA and P values are shown.
Figure 4.
Figure 4.
DR4-binding citrullinated peptides induce varying amounts of expansion of cognate CD4+ T cells. (A) Contour plots of CD44 versus tetramer staining for CD4+ T cells from SLO samples from mice immunized with the indicated peptides in CFA and enriched with the indicated tetramers 7 d after immunization. In each case, cell enrichment was performed after staining with a 50:50 mixture of DR4/SA-APC and DR4/SA-PE tetramers loaded with the same peptide. A diagonal gate was then drawn on the plot of peptide:DR4/SA-APC versus peptide:DR4/SA-PE staining to exclude artifactual cells that bound only one tetramer. The plots in the figure show only the peptide:DR4/SA-PE staining. Percentages of tetramer-binding cells are shown on each plot. (B) Total log 10 number of tetramer-binding CD4+ T cells from SLOs of mice immunized 7 d earlier with the indicated peptides and after enrichment with DR4 tetramers containing the peptides used for immunization (HAp and CILP cit988, n = 7 from seven independent experiments; YFVp and Vim cit71, n = 6 from six independent experiments; Fib cit74 and Eno cit15, n = 5 from five independent experiments). The values for samples from individual mice are shown with the horizontal bars representing the mean values, numerical values for which are also shown above each group. Earlier research showed that the limit of detection of MHCII tetramer-based cell enrichment is three cells per mouse (shown with the dashed line). Thus, any value that was ≤3 was set to three on the log 10 plots. Values were compared with one-way ANOVA and P values are shown.
Figure 5.
Figure 5.
Citrullinated peptide:DR4-specific T cells differentiate suboptimally after immunization. (A and B) Contour plots of all tetramer-binding (left plot) or Foxp3 tetramer-binding CD4+ Tconv cells (right plot) from SLO samples from mice immunized with HAp (A) or CILP cit988 (B) in CFA and enriched with the indicated tetramers 14 d after immunization. Gates used to determine the percentages of Treg, Th17, Th1, Tfh, and unknown cells are shown. (C) Percentages of cells of indicated subsets among the indicated DR4-bound peptide-specific populations from immunized mice (HAp, n = 8 from eight independent experiments; YFVp, n = 7 from five independent experiments; CILP cit988, n = 9 from eight independent experiments; Fib cit74, n = 6 from six independent experiments). The values for samples from individual mice are shown with the horizontal bars representing the means. Values were compared with one-way ANOVA and P values are shown.

References

    1. Alivernini, S., Firestein G.S., and McInnes I.B.. 2022. The pathogenesis of rheumatoid arthritis. Immunity. 55:2255–2270. 10.1016/j.immuni.2022.11.009 - DOI - PubMed
    1. Becart, S., Whittington K.B., Prislovsky A., Rao N.L., and Rosloniec E.F.. 2021. The role of posttranslational modifications in generating neo-epitopes that bind to rheumatoid arthritis-associated HLA-DR alleles and promote autoimmune T cell responses. PLoS One. 16:e0245541. 10.1371/journal.pone.0245541 - DOI - PMC - PubMed
    1. Crawford, F., Kozono H., White J., Marrack P., and Kappler J.. 1998. Detection of antigen-specific T cells with multivalent soluble class II MHC covalent peptide complexes. Immunity. 8:675–682. 10.1016/S1074-7613(00)80572-5 - DOI - PubMed
    1. Crotty, S. 2011. Follicular helper CD4 T cells (TFH). Annu. Rev. Immunol. 29:621–663. 10.1146/annurev-immunol-031210-101400 - DOI - PubMed
    1. Darrah, E., and Andrade F.. 2018. Rheumatoid arthritis and citrullination. Curr. Opin. Rheumatol. 30:72–78. 10.1097/BOR.0000000000000452 - DOI - PMC - PubMed

Publication types