. 2023 Oct 17;120(42):e2309331120.
doi: 10.1073/pnas.2309331120. Epub 2023 Oct 13.

The Drosophila blood-brain barrier regulates sleep via Moody G protein-coupled receptor signaling

Affiliations

The Drosophila blood-brain barrier regulates sleep via Moody G protein-coupled receptor signaling

Sofia Axelrod et al. Proc Natl Acad Sci U S A. .

Abstract

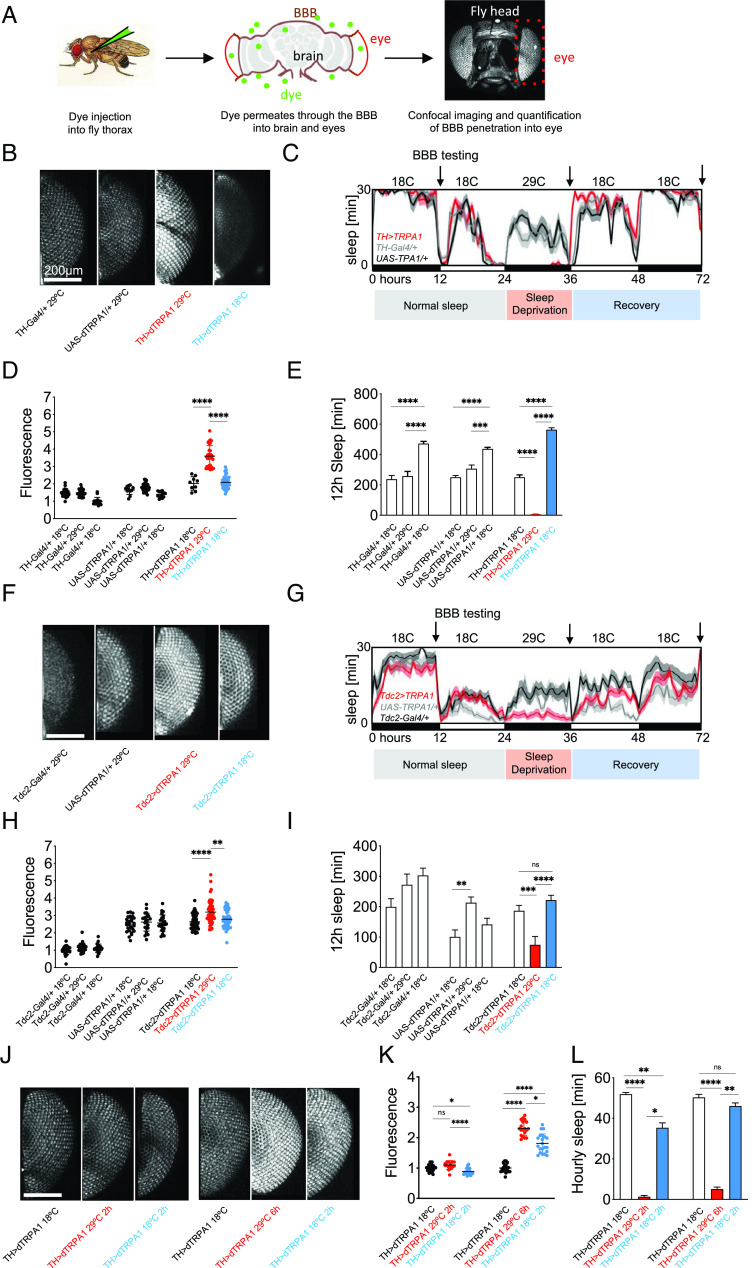
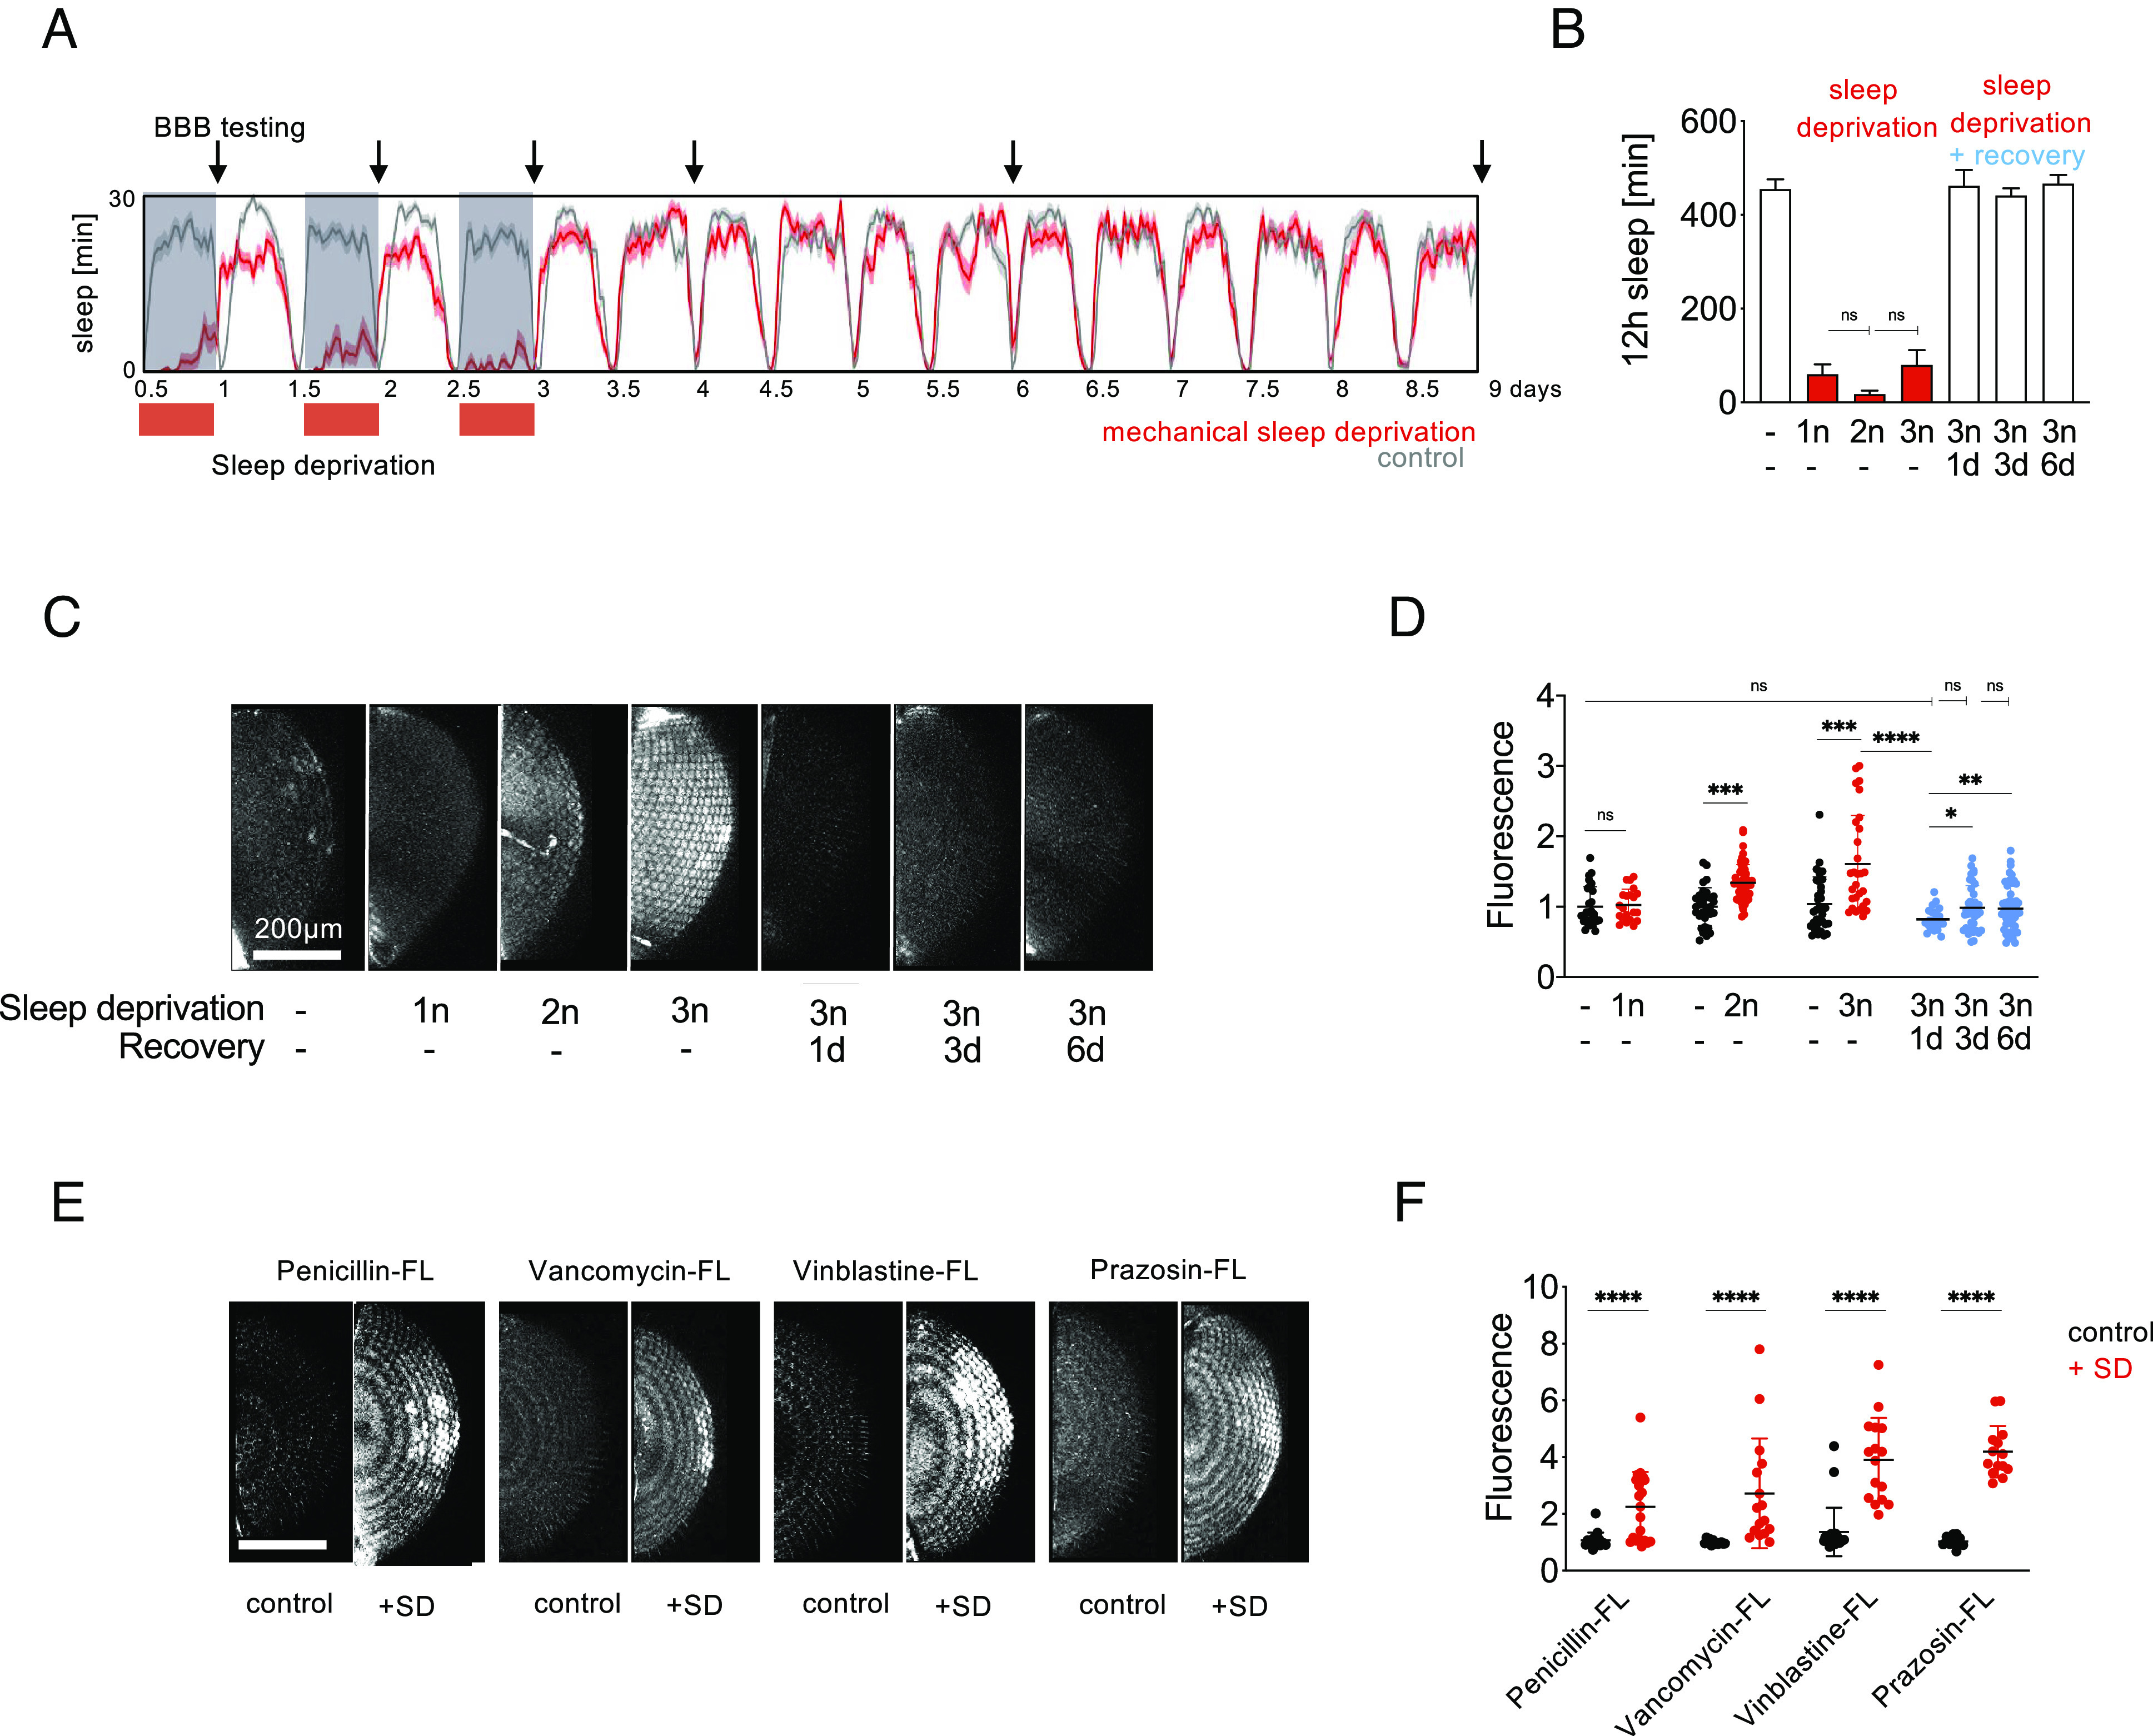
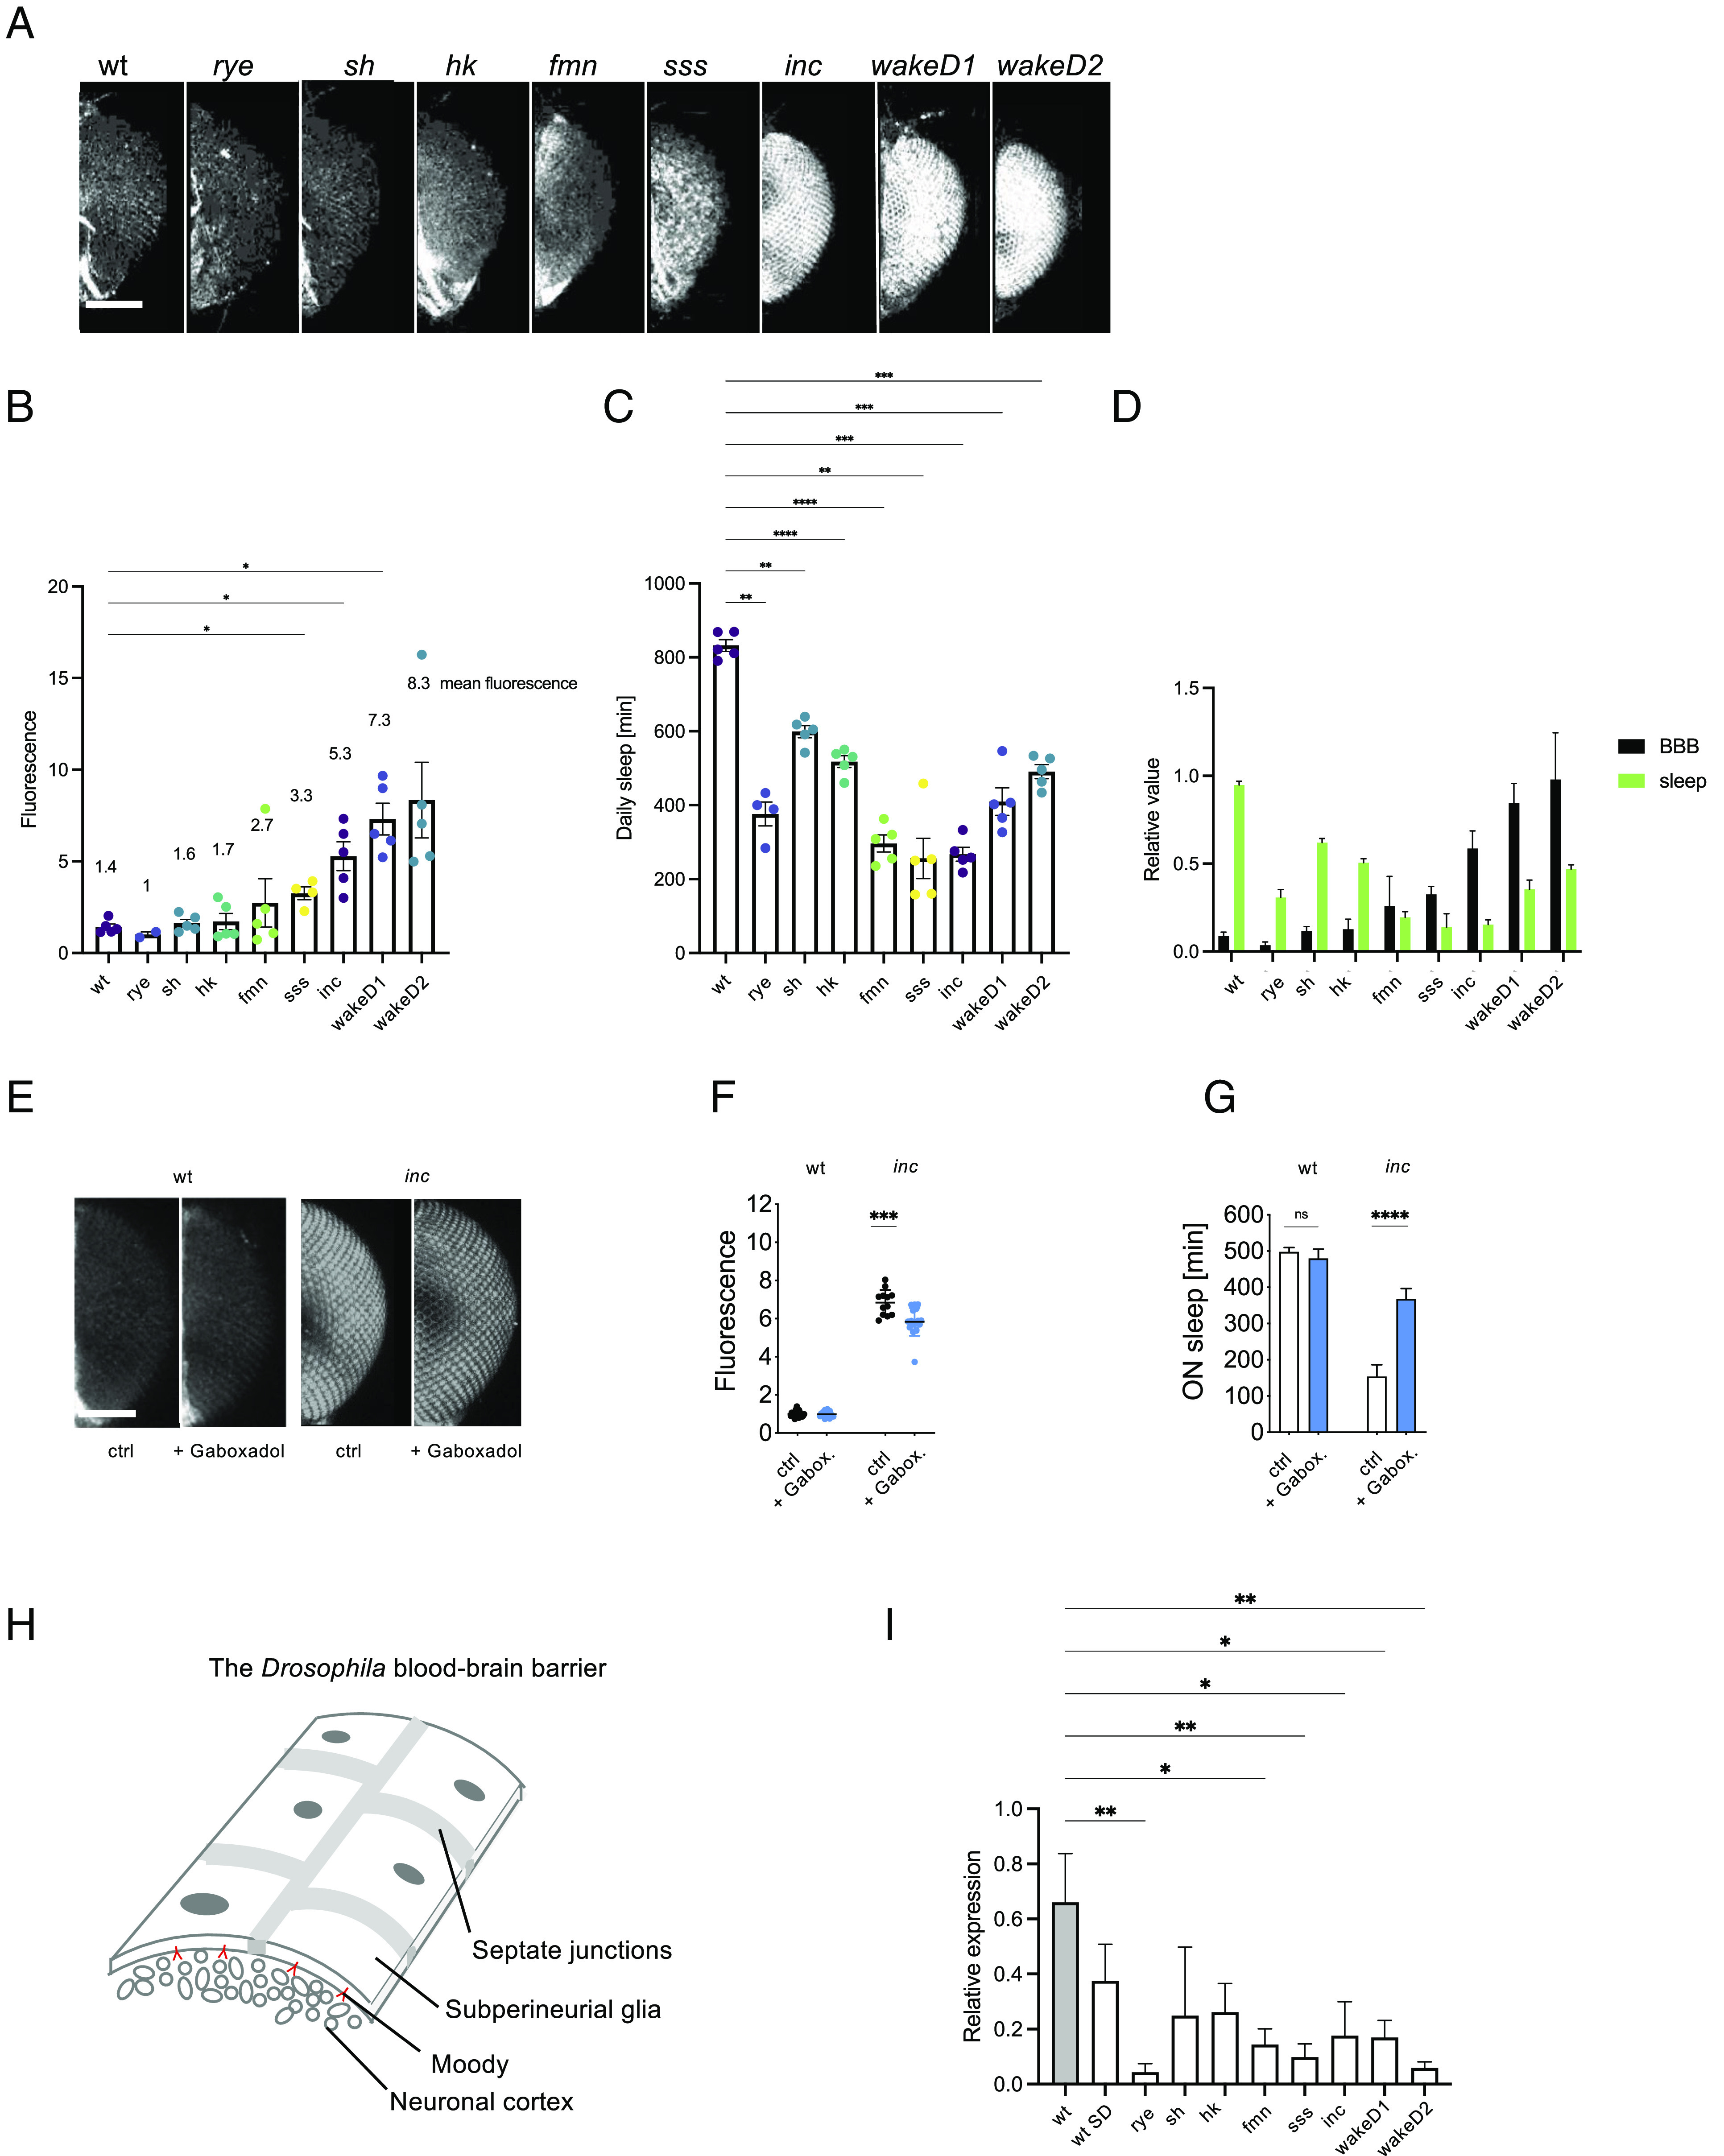
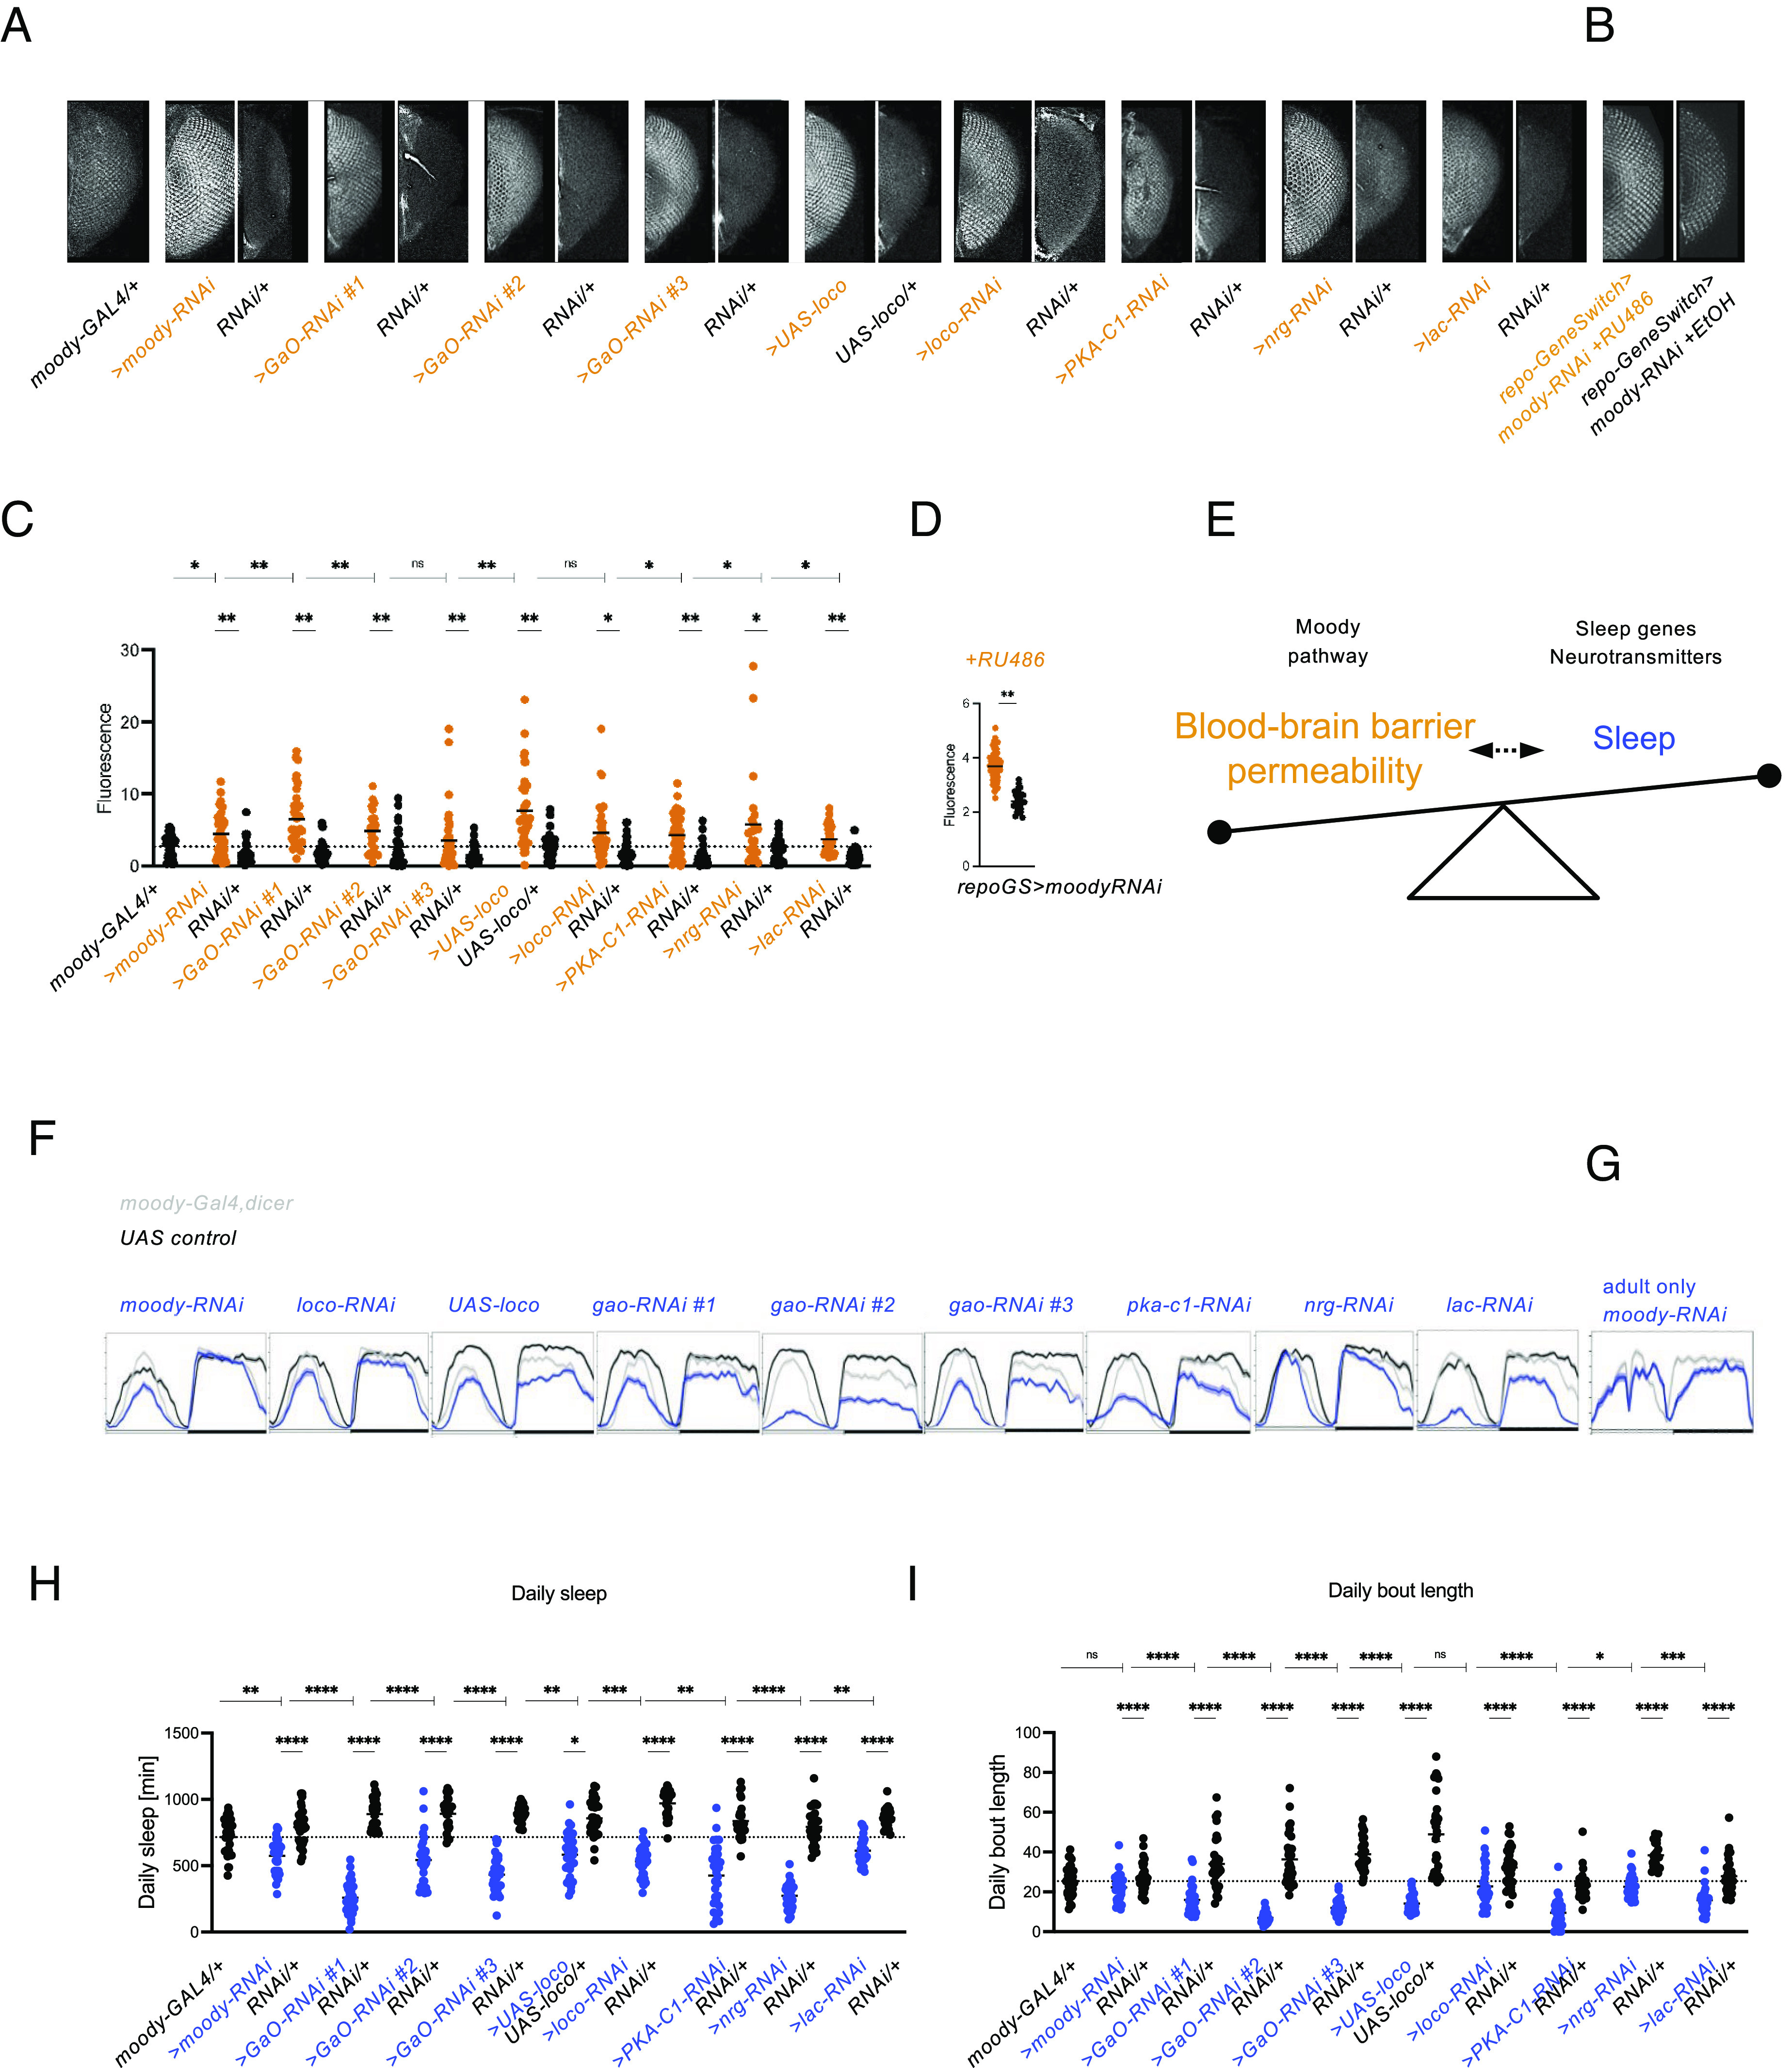
Sleep is vital for most animals, yet its mechanism and function remain unclear. We found that permeability of the BBB (blood-brain barrier)-the organ required for the maintenance of homeostatic levels of nutrients, ions, and other molecules in the brain-is modulated by sleep deprivation (SD) and can cell-autonomously effect sleep changes. We observed increased BBB permeability in known sleep mutants as well as in acutely sleep-deprived animals. In addition to molecular tracers, SD-induced BBB changes also increased the penetration of drugs used in the treatment of brain pathologies. After chronic/genetic or acute SD, rebound sleep or administration of the sleeping aid gaboxadol normalized BBB permeability, showing that SD effects on the BBB are reversible. Along with BBB permeability, RNA levels of the BBB master regulator moody are modulated by sleep. Conversely, altering BBB permeability alone through glia-specific modulation of moody, gαo, loco, lachesin, or neuroglian-each a well-studied regulator of BBB function-was sufficient to induce robust sleep phenotypes. These studies demonstrate a tight link between BBB permeability and sleep and indicate a unique role for the BBB in the regulation of sleep.

Keywords: GPCR; blood-brain-barrier; sleep.


Conflict of interest statement

The authors declare no competing interest.

Figures

Fig. 1.
Fig. 1.
Neurogenic SD reversibly increases BBB permeability. (A) Workflow illustration of the BBB injection assay. Drosophila males are injected with 10kDa Dextran dye. Dye penetration into the brain and eyes depend on BBB permeability. Flies are decapitated, and heads are imaged using confocal microscopy. Fluorescence in each eye is quantified as a measure of dye penetration across the BBB. (B) Flies were sleep deprived for one night using thermogenetic activation of dopaminergic neurons (TH>dTRPA1) at 29 °C and injected with 10 kDa Dextran-TexasRed, red, or allowed to recover sleep for 24 h at 18 °C before injection and imaging, blue. Hemizygous controls are in black. Fluorescence intensity in the eye shows increased BBB permeability after SD but closure after sleep recovery. (C) Sleep plot for thermogenetic SD. TH>TRPA1 flies and heterozygous controls were sleep deprived for 12 h at 29 °C and injected the next morning or left to recover lost sleep at 18 °C for 24 h before injection the next day. Average sleep in 16 flies is shown, binned as sleep in 30 min. Arrows denote timepoints of BBB testing shown in (B). (D) Quantification of BBB permeability in (B). Each point represents normalized fluorescence in one eye, n = 30 to 40; red, sleep-deprived flies; blue, flies after recovery sleep; black, hemizygous controls. (E) Quantification of sleep data in (C). Shown is total sleep in the 12 h prior to injection for normal sleep, SD and recovery groups for the indicated genotypes. n = 16; red, sleep-deprived flies; blue, flies after recovery sleep; black, hemizygous controls. (F) Flies were sleep deprived for one night using thermogenetic activation of octopaminergic neurons (Tdc2>dTRPA1) at 29 °C and injected with 10 kDa Dextran-TexasRed, red, or additionally allowed to recover for 24 h at 18 °C before injection and imaging, blue. Hemizygous controls are in black. Fluorescence intensity in the eye shows increased BBB permeability after SD, but closure after recovery. n = 30 to 40; red, sleep-deprived flies; blue, flies after recovery sleep; black, hemizygous controls. (G) Sleep plot for octopaminergic SD. Tdc2>TRPA1 flies and heterozygous controls were sleep deprived for 12 h at 29 °C and injected the next morning or left to recover lost sleep at 18 °C for 24 h before injection the next day. Average sleep in 16 flies is shown, binned as sleep in 30 min. Arrows denote timepoints of BBB testing shown in (F). (H) Quantification of BBB permeability in (F). Each point represents normalized fluorescence in one eye, n = 30 to 40; red, sleep-deprived flies; blue, flies after recovery sleep; black, hemizygous controls. (I) Quantification of sleep data in (G). Shown is total sleep in 12 h prior to injection for normal sleep, SD and recovery groups for the indicated genotypes. n = 16; red, sleep-deprived flies; blue, flies after recovery sleep; black, hemizygous controls. (J) Flies were sleep deprived for 2 h or 6 h using thermogenetic activation of dopaminergic neurons (TH>dTRPA1) and injected with 10 kDa Dextran-TexasRed, red, or allowed to recover sleep for 2 h before injection and imaging, blue. Controls are in black. Fluorescence intensity in the eye shows increased BBB permeability after 6 h but not 2 h of SD and partial closure after 2 h sleep recovery. (K) Quantification of BBB permeability in (J). Each point represents normalized fluorescence in one eye, n = 30 to 40; red, sleep-deprived flies; blue, flies after recovery sleep; black, controls. (L) Hourly sleep for the indicated groups from (J)/(K) during the day before SD, during SD, and during the 2 h of recovery sleep for the indicated genotypes. n = 16; red, sleep-deprived flies; blue, flies after recovery sleep; black, controls. Statistical significance was calculated using one-way ANOVA with Dunn’s post hoc testing. Significance levels are P < 0.05: *, <0.01: **, <0.001: ***, <0.0001: ****. SD: Sleep deprivation.
Fig. 2.
Fig. 2.
Mechanical SD reversibly increases BBB permeability and improves drug penetration into the brain. (A) Sleep plot for mechanical SD. Wild-type flies were sleep deprived using a custom-built machine by randomized shaking for 2x2 s every 5 m for 1, 2, or 3 subsequent nights (n) during their normal sleep time between ZT 12–24, plotted in red, and left to recover for up to 6 d. Average sleep in 16 flies is shown, binned as sleep in 30 min. Arrows denote timepoints of BBB testing shown in (C). (B) Quantification of sleep data in (A). Shown is total sleep in 12 h prior to injection for each group. n = 16. Statistical significance was calculated using one-way ANOVA with Dunn’s post hoc testing. Red, sleep-deprived flies. —| indicates comparison to 1n SD. (C) Flies were sleep deprived as shown in (A) and injected with 10 kDa Dextran-TexasRed to assess BBB permeability after 1, 2, or 3 nights of SD or let to recover sleep for 1, 3, or 6 d prior to BBB testing. (D) Quantification of BBB permeability in (C). n = 30 to 40. Red, sleep-deprived flies; blue, flies after recovery sleep; black, controls. Statistical significance was calculated using t tests for pairwise and one-way ANOVA with Dunn’s post hoc testing for multiple comparisons. —| indicates comparisons to non-sleep-deprived flies. (E) Three nights of SD increase BBB penetration of fluorescein-labeled penicillin, vancomycin, vinblastine, and prazosin. Flies were mechanically sleep deprived or left to sleep during Zeitgeber time 12 to 24 h for three consecutive nights and injected with fluorescently labeled bioactive drugs the next morning for BBB assessment. (F) Quantification of BBB permeability in (E). n = 30 to 40. Red, sleep-deprived flies; black, controls. For quantification of BBB permeability, fluorescence was measured for both eyes of each fly. Each dot represents normalized fluorescence in one eye. Statistical significance was calculated using t tests. Significance levels are P < 0.05: *, <0.01: **, <0.001: ***, <0.0001: **. SD: sleep deprivation.
Fig. 3.
Fig. 3.
Sleep mutants display increased BBB permeability. (A) BBB permeability via tracer dye assay in sleep duration mutants. (B) Quantification of BBB permeability in (A). n = 30 to 40, shown are averages for 2 to 5 independent experiments. Significance was assessed using one-way ANOVA and post hoc Dunnett’s test. (C) Total daily sleep amounts for mutants in (A) and (B). n = 20 to 32, shown are averages for 4 to 5 independent experiments. Statistical significance was calculated using one-way ANOVA with Dunnett’s post hoc testing. (D) Bar chart displaying a largely inverse relationship between sleep and BBB permeability in sleep mutants. Shown are averages of 3 to 5 independent experiments. For comparability, data were normalized to the averages of daily sleep and fluorescence, respectively. To this end, the respectively lowest value was subtracted from the individual measurements and the result was divided by the difference between highest and lowest values, for sleep and BBB data, respectively. n = 2 to 5 independent experiments. Statistical significance was calculated using one-way ANOVA with Dunnett’s post hoc testing. (E) BBB permeability in inc and wild-type flies after administration of 0.1 mg/mL gaboxadol sleep aid overnight. (F) Quantification of BBB permeability in (E). n = 20 to 30. Significance was assessed using t–testing. (G) Sleep after gaboxadol administration. n = 16. Significance was assessed using t–testing. (H) Schematic representation of the Drosophila BBB. (I) Shown are qRT-PCR results of relative moody expression normalized to gapdh in wild-type, sleep deprived wild-type, and 8 sleep mutants. Shown is a bar graph of averages of 3 independent experiments. Significance was assessed using one-way ANOVA and post hoc Dunnett’s test. For quantification of BBB permeability, fluorescence was measured for both eyes of each fly. Each dot represents normalized fluorescence in one eye. Significance levels are P < 0.05: *, P < 0.01: **, <0.001: ***, <0.0001: ****. Bar: 200 μm.
Fig. 4.
Fig. 4.
Glial GPCR signaling is required for BBB integrity and sleep. (A) Tracer injection assay for SPG-specific RNAi using moody-Gal4 driving moody, GaO, loco, PKA-C1, lachesin, and neuroglian, and driving overexpression of loco, shows increased BBB permeability. (B) Tracer injection assay for adult glia-specific knockdown of the GPCR Moody using repo-GeneSwitch shows increased BBB permeability. (C and D) Quantification of BBB data shown in (A and B). n = 40 - 45. Significance was assessed using one-way ANOVA and post hoc Tukey test (C) and t-testing (D). (E) Model of bidirectiontal relationship between the BBB and sleep. The BBB seems to sense sleep states and respond to SD by increasing permeability and to sleep increases with BBB closure. As opening the BBB itself causes SD, it seems that a particular level of opening, or even its dynamics, signal sleep states. Future work ideally measuring BBB changes and yet to be identified real time sleep biomarkers concomitantly will hopefully elucidate the interplay of BBB dynamics and sleep, but for now, we believe our data suggest that the BBB is at least part of sleep regulation. The moody pathway, neurotransmitters such as dopamine and octopamine as well as sleep genes are known to contribute to the function of the BBB and sleep, respectively, and we observe that modifying them changes the balance between BBB and sleep. (F) BBB-specific knockdown using moody-Gal4 of moody, GaO, loco, PKA-C1, lachesin, and neuroglian and overexpression of loco shows decreased sleep. n = 32. (G) Adult glia-specific knockdown of the GPCR Moody using repo-GeneSwitch leads to decreased sleep. n = 16. (H) Quantification of daily sleep for data shown in (F). Significance was assessed using one-way ANOVA and post hoc Tukey test. (I) Daily bout length quantification for data shown in (F). For quantification of BBB permeability, fluorescence was measured for both eyes of each fly. Each dot represents normalized fluorescence in one eye. For all sleep plots, average 24 h sleep over 4 d binned as sleep in 30 min is shown. Significance levels are P < 0.05: *, <0.01: **, <0.001: ***, <0.0001: ****. For C, H, I, horizontal dashed line indicates mean of moody-Gal4/+ control, and —| indicates comparison to moody-GAL4/+, SPG: subperineurial glia.

References

    1. Cirelli C., The genetic and molecular regulation of sleep: From fruit flies to humans. Nat. Rev. Neurosci. 10, 549–560 (2009). - PMC - PubMed
    1. Nichols A. L. A., Eichler T., Latham R., Zimmer M., A global brain state underlies C. elegans sleep behavior. Science 356, eaam6851 (2017). - PubMed
    1. Kanaya H. J., et al. , A sleep-like state in Hydra unravels conserved sleep mechanisms during the evolutionary development of the central nervous system. Sci. Adv. 6, eabb9415 (2020). - PMC - PubMed
    1. Vaccaro A., et al. , Sleep loss can cause death through accumulation of reactive oxygen species in the gut. Cell 181, 1307–1328.e15 (2020). - PubMed
    1. Rechtschaffen A., Bergmann B. M., Sleep deprivation in the rat: An update of the 1989 paper. Sleep 25, 18–24 (2002). - PubMed

Publication types

Substances

LinkOut - more resources