. 2023 Oct 20;8(88):eabi6887.
doi: 10.1126/sciimmunol.abi6887. Epub 2023 Oct 13.

IL-31-dependent neurogenic inflammation restrains cutaneous type 2 immune response in allergic dermatitis

Affiliations

IL-31-dependent neurogenic inflammation restrains cutaneous type 2 immune response in allergic dermatitis

Marlys S Fassett et al. Sci Immunol. .

Abstract

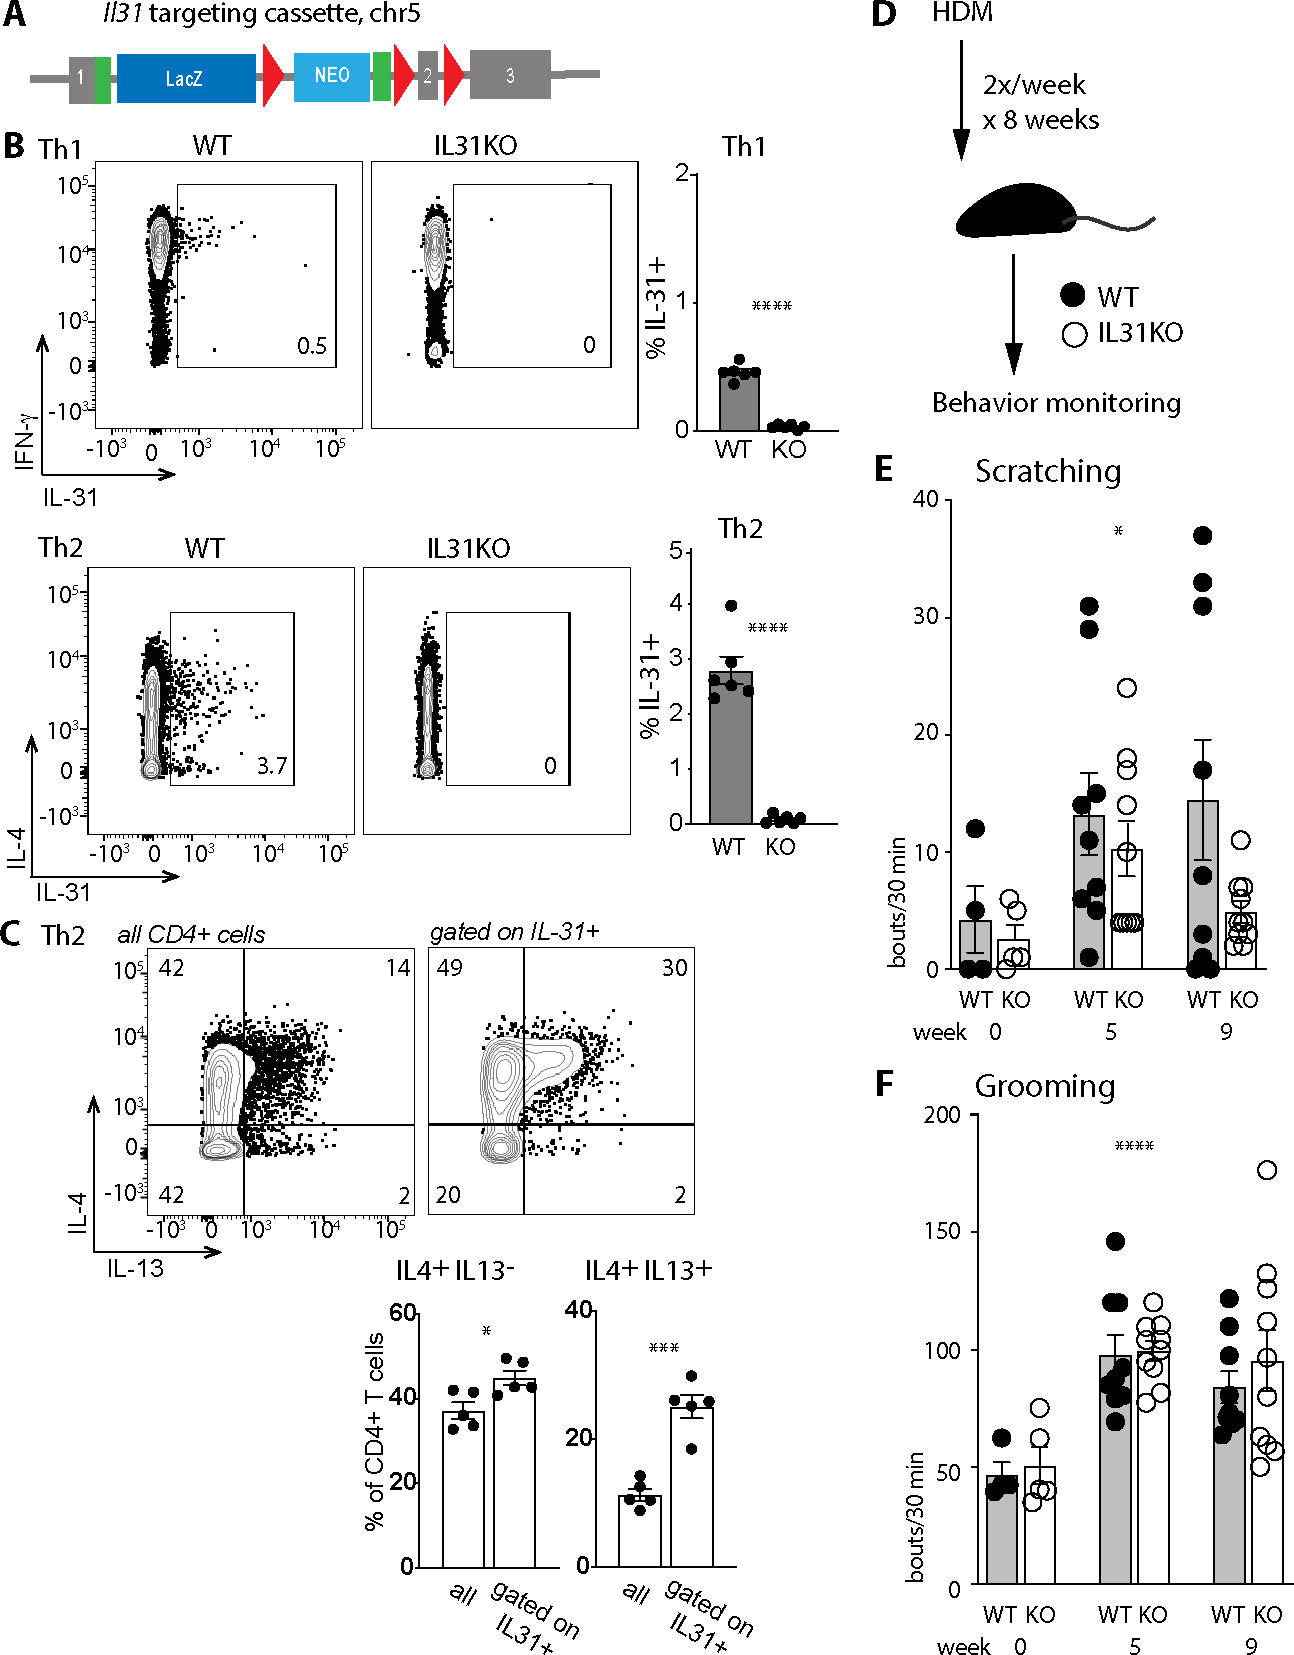
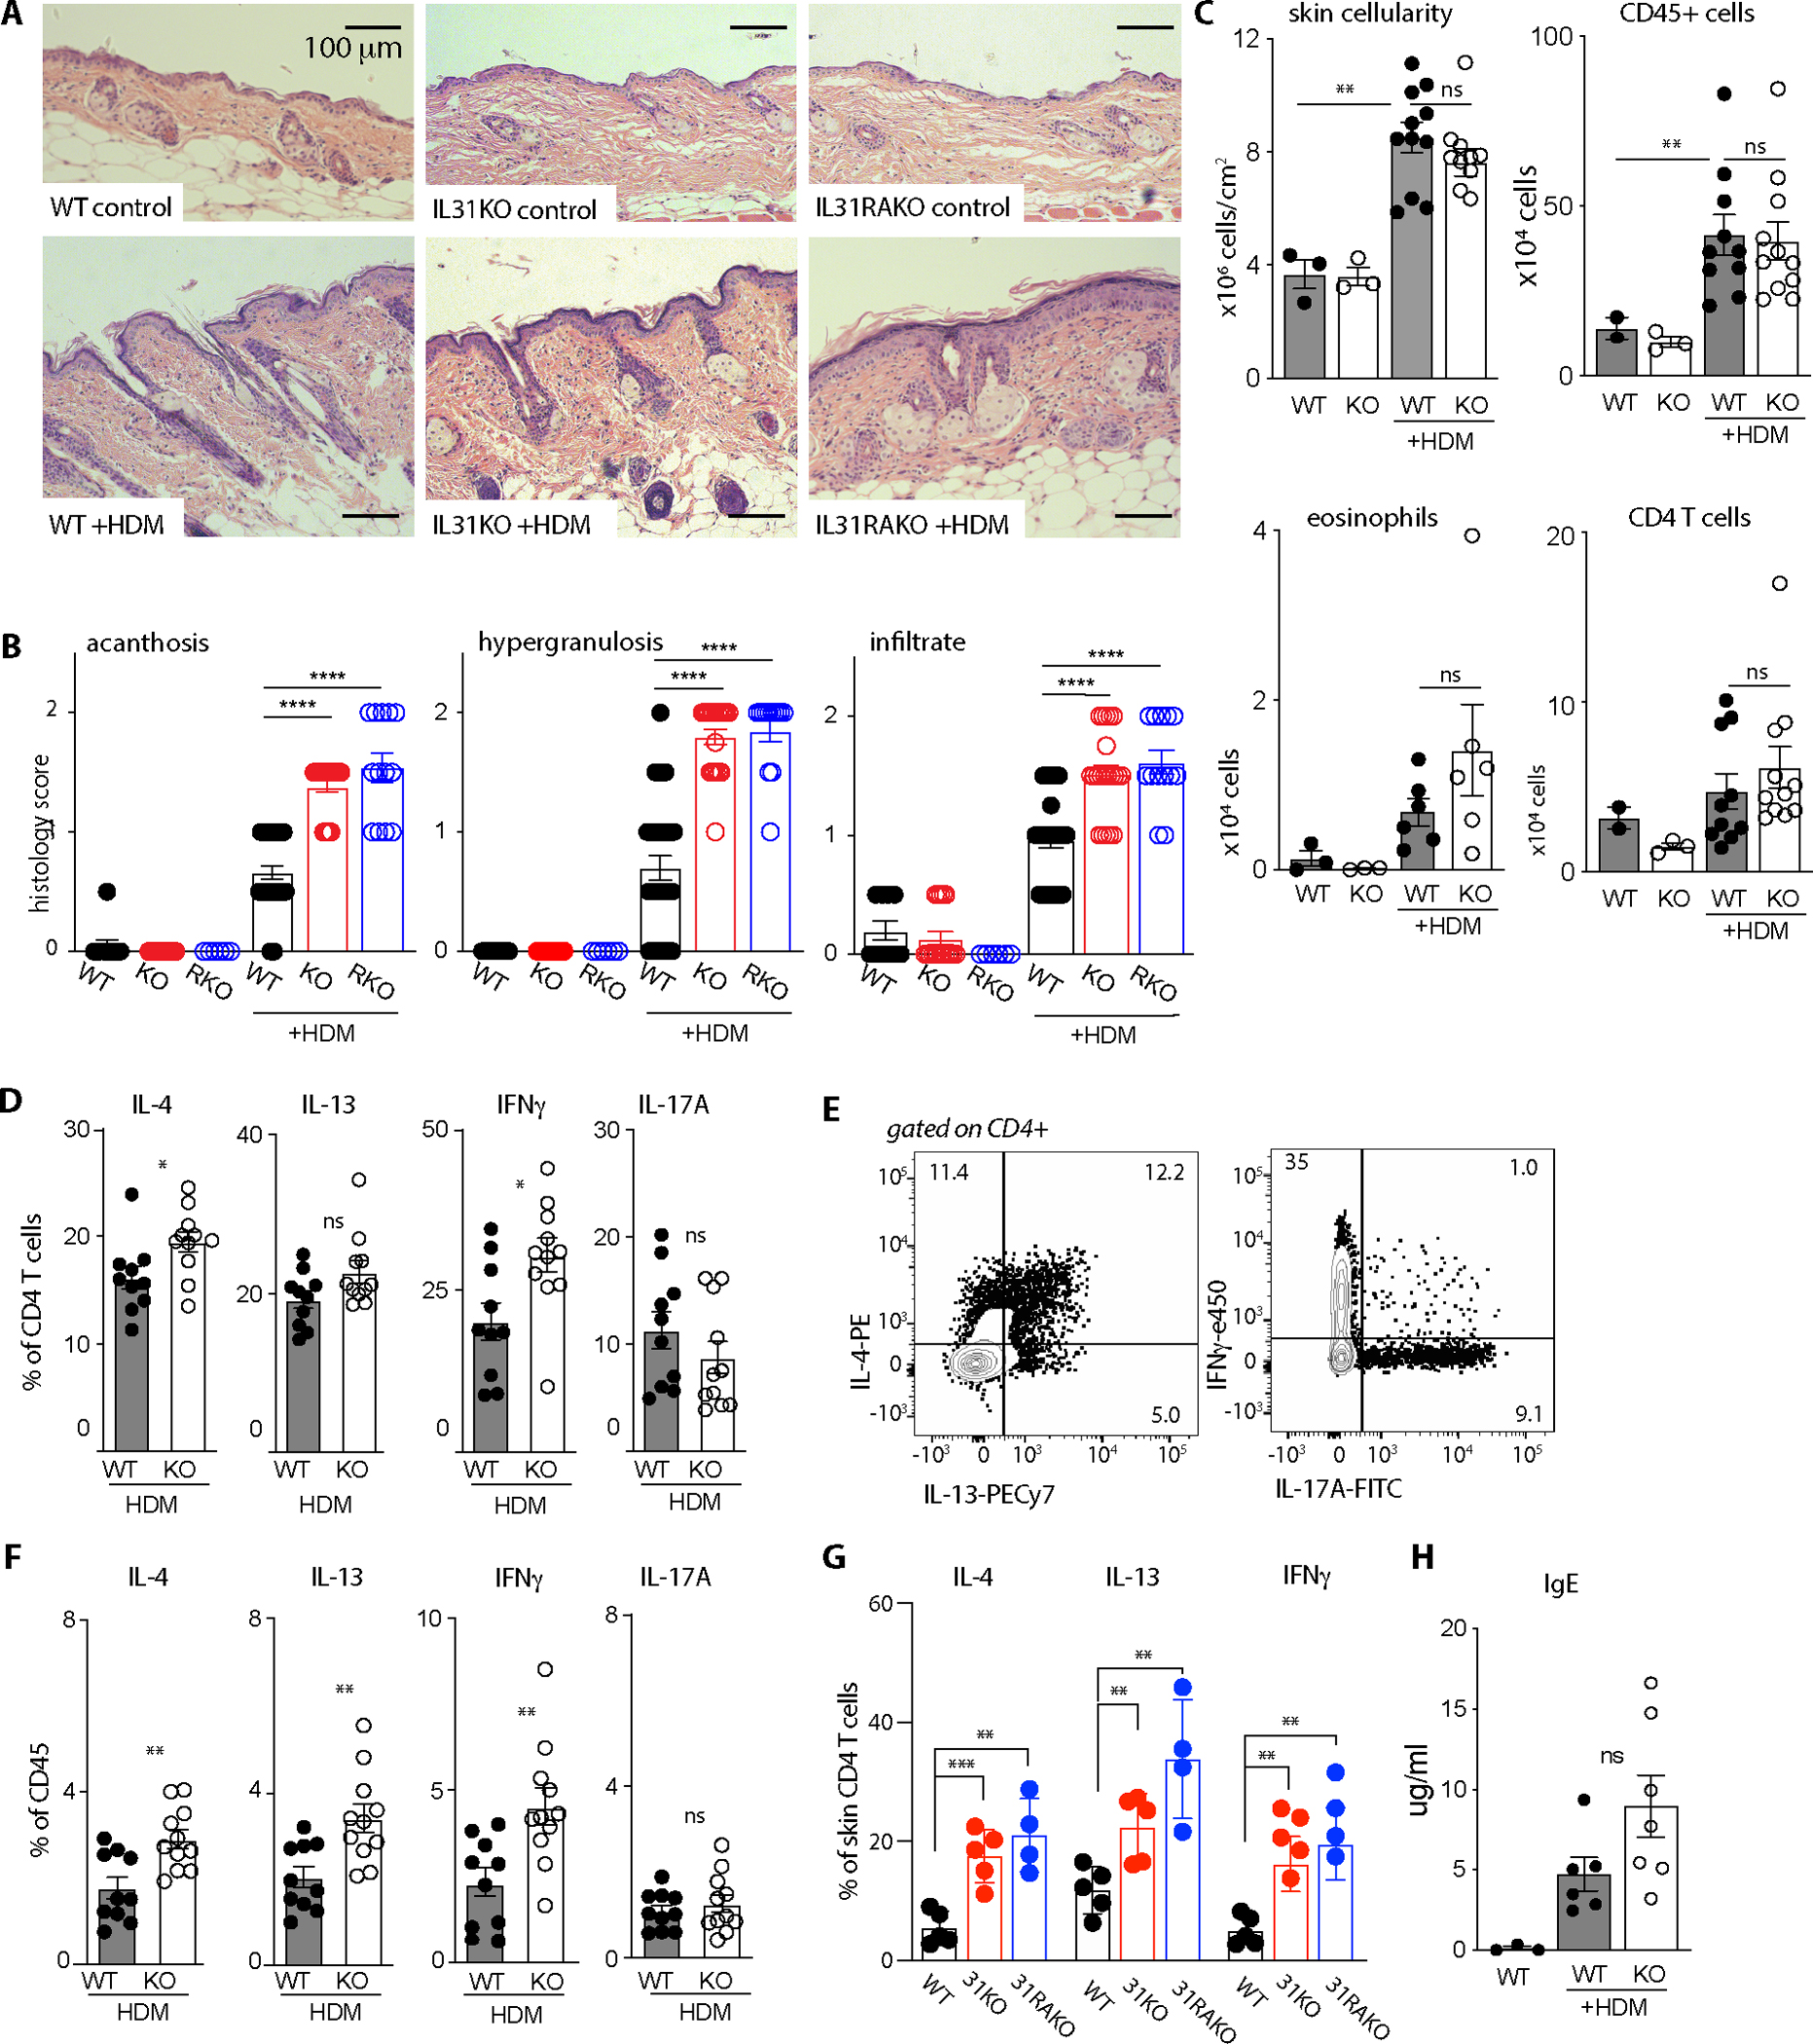
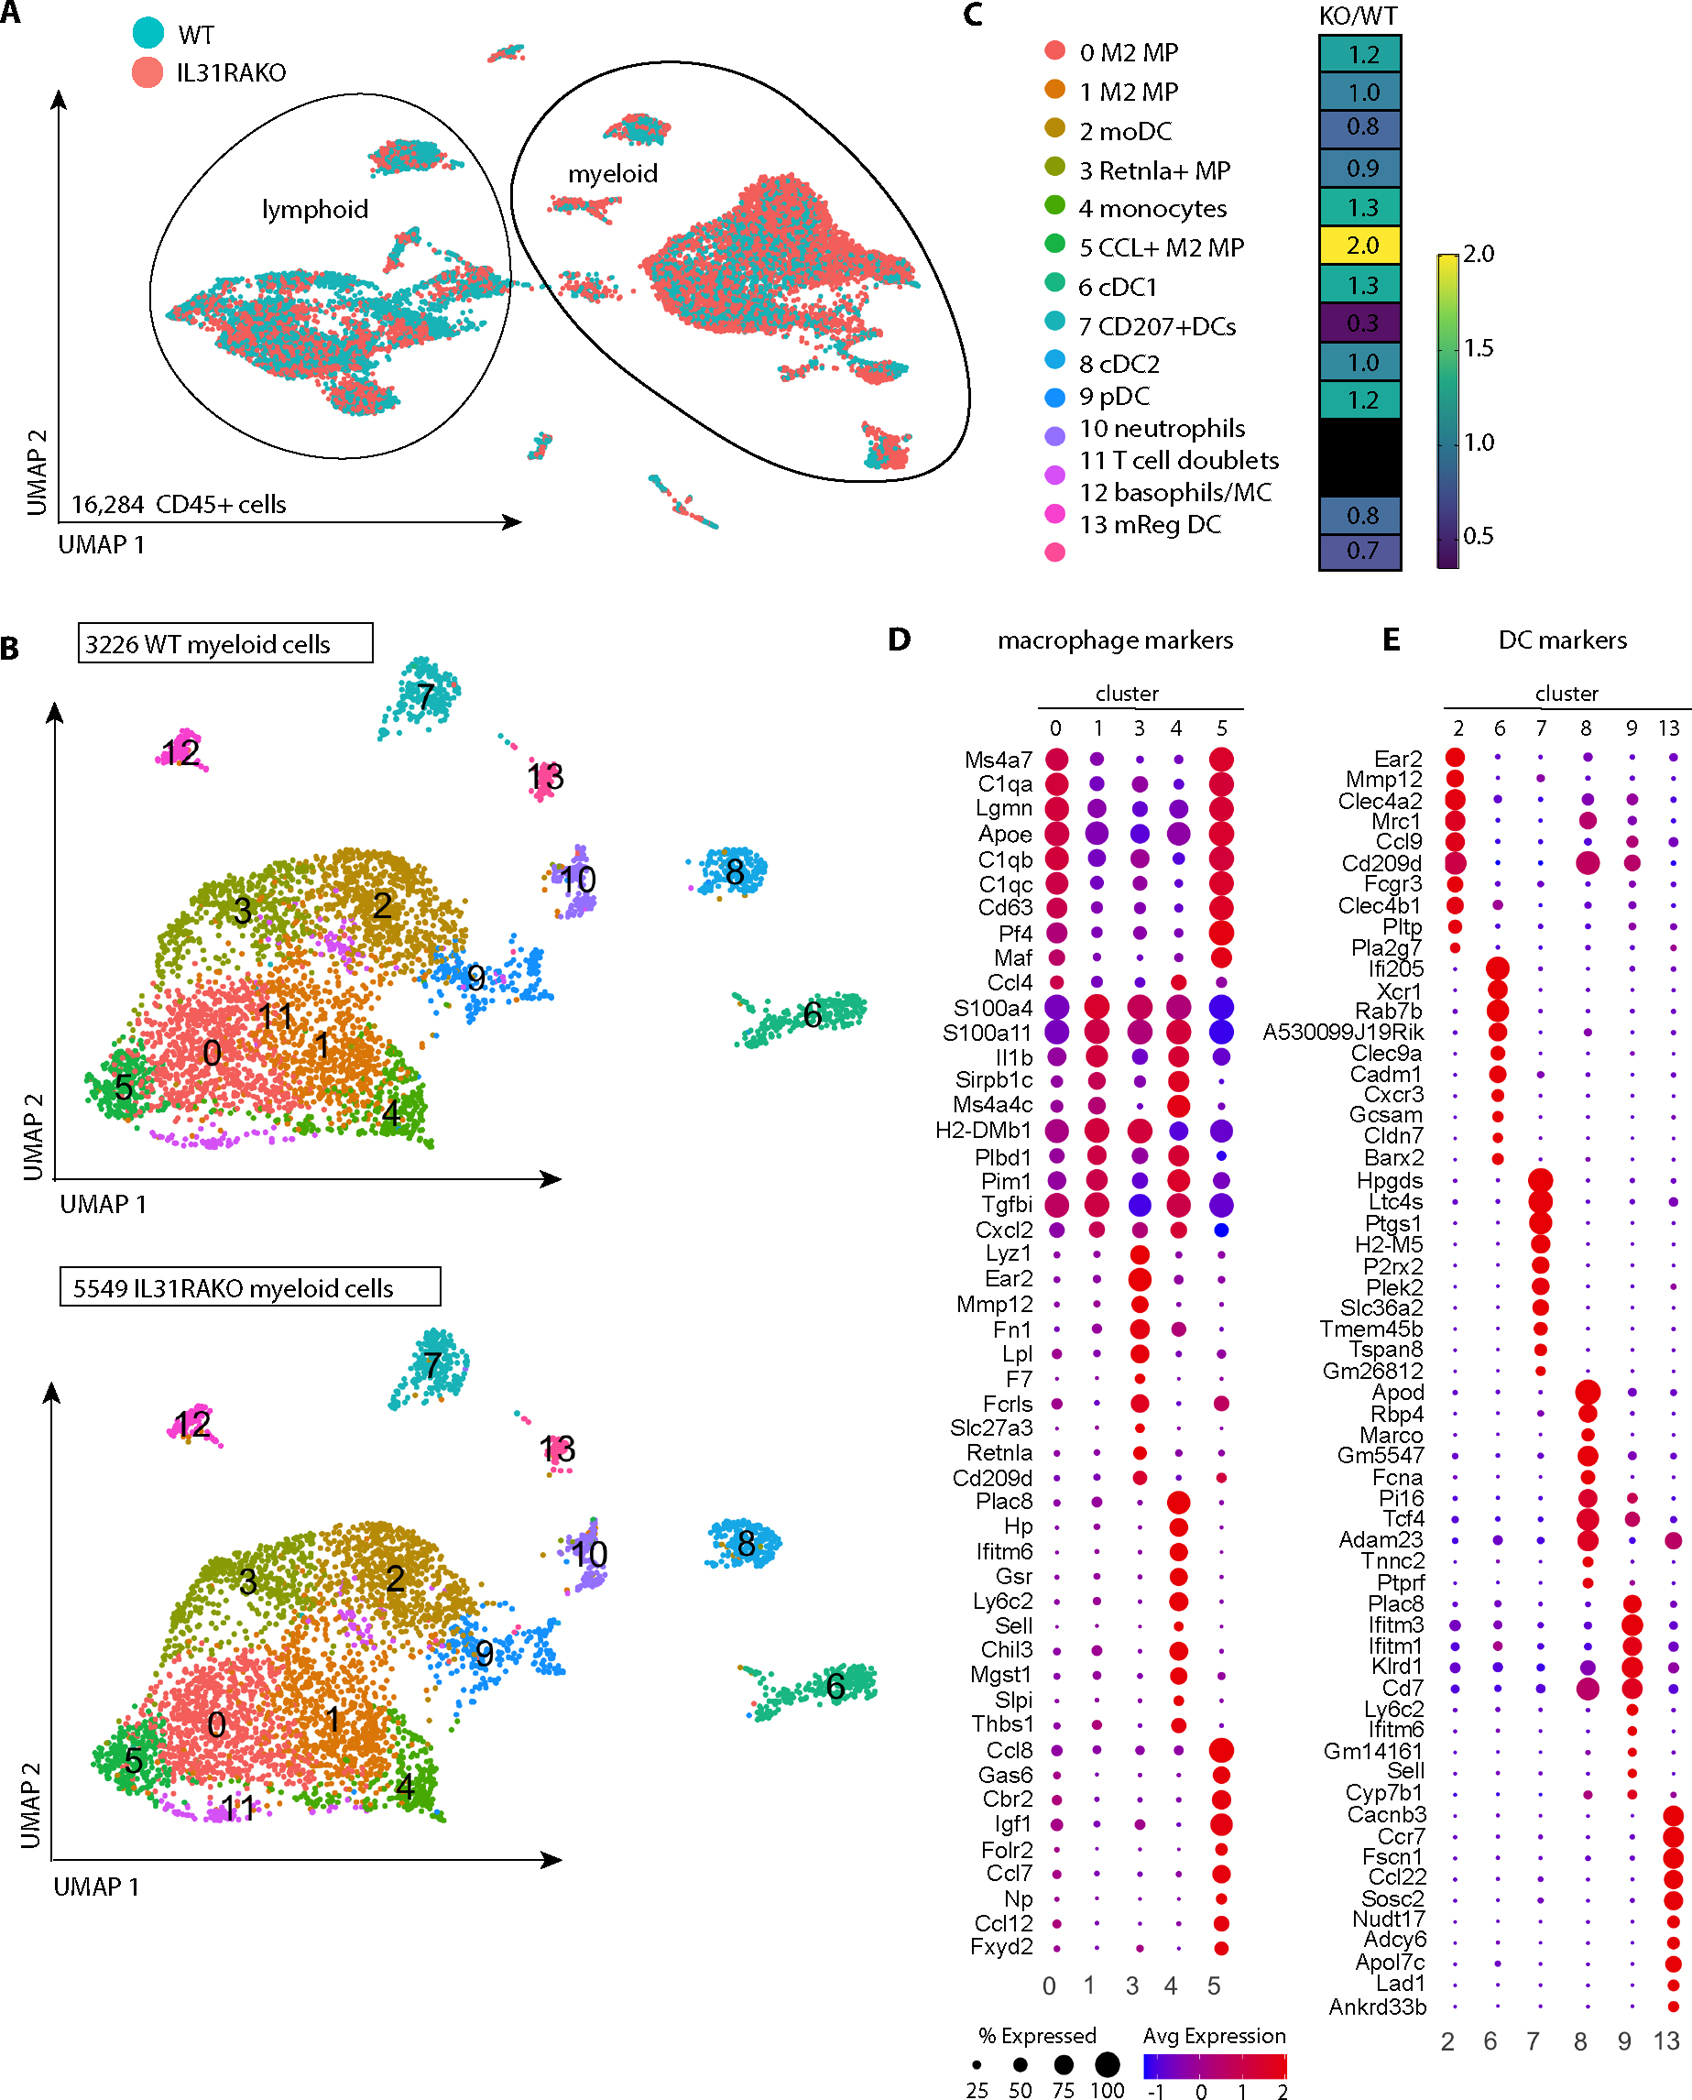
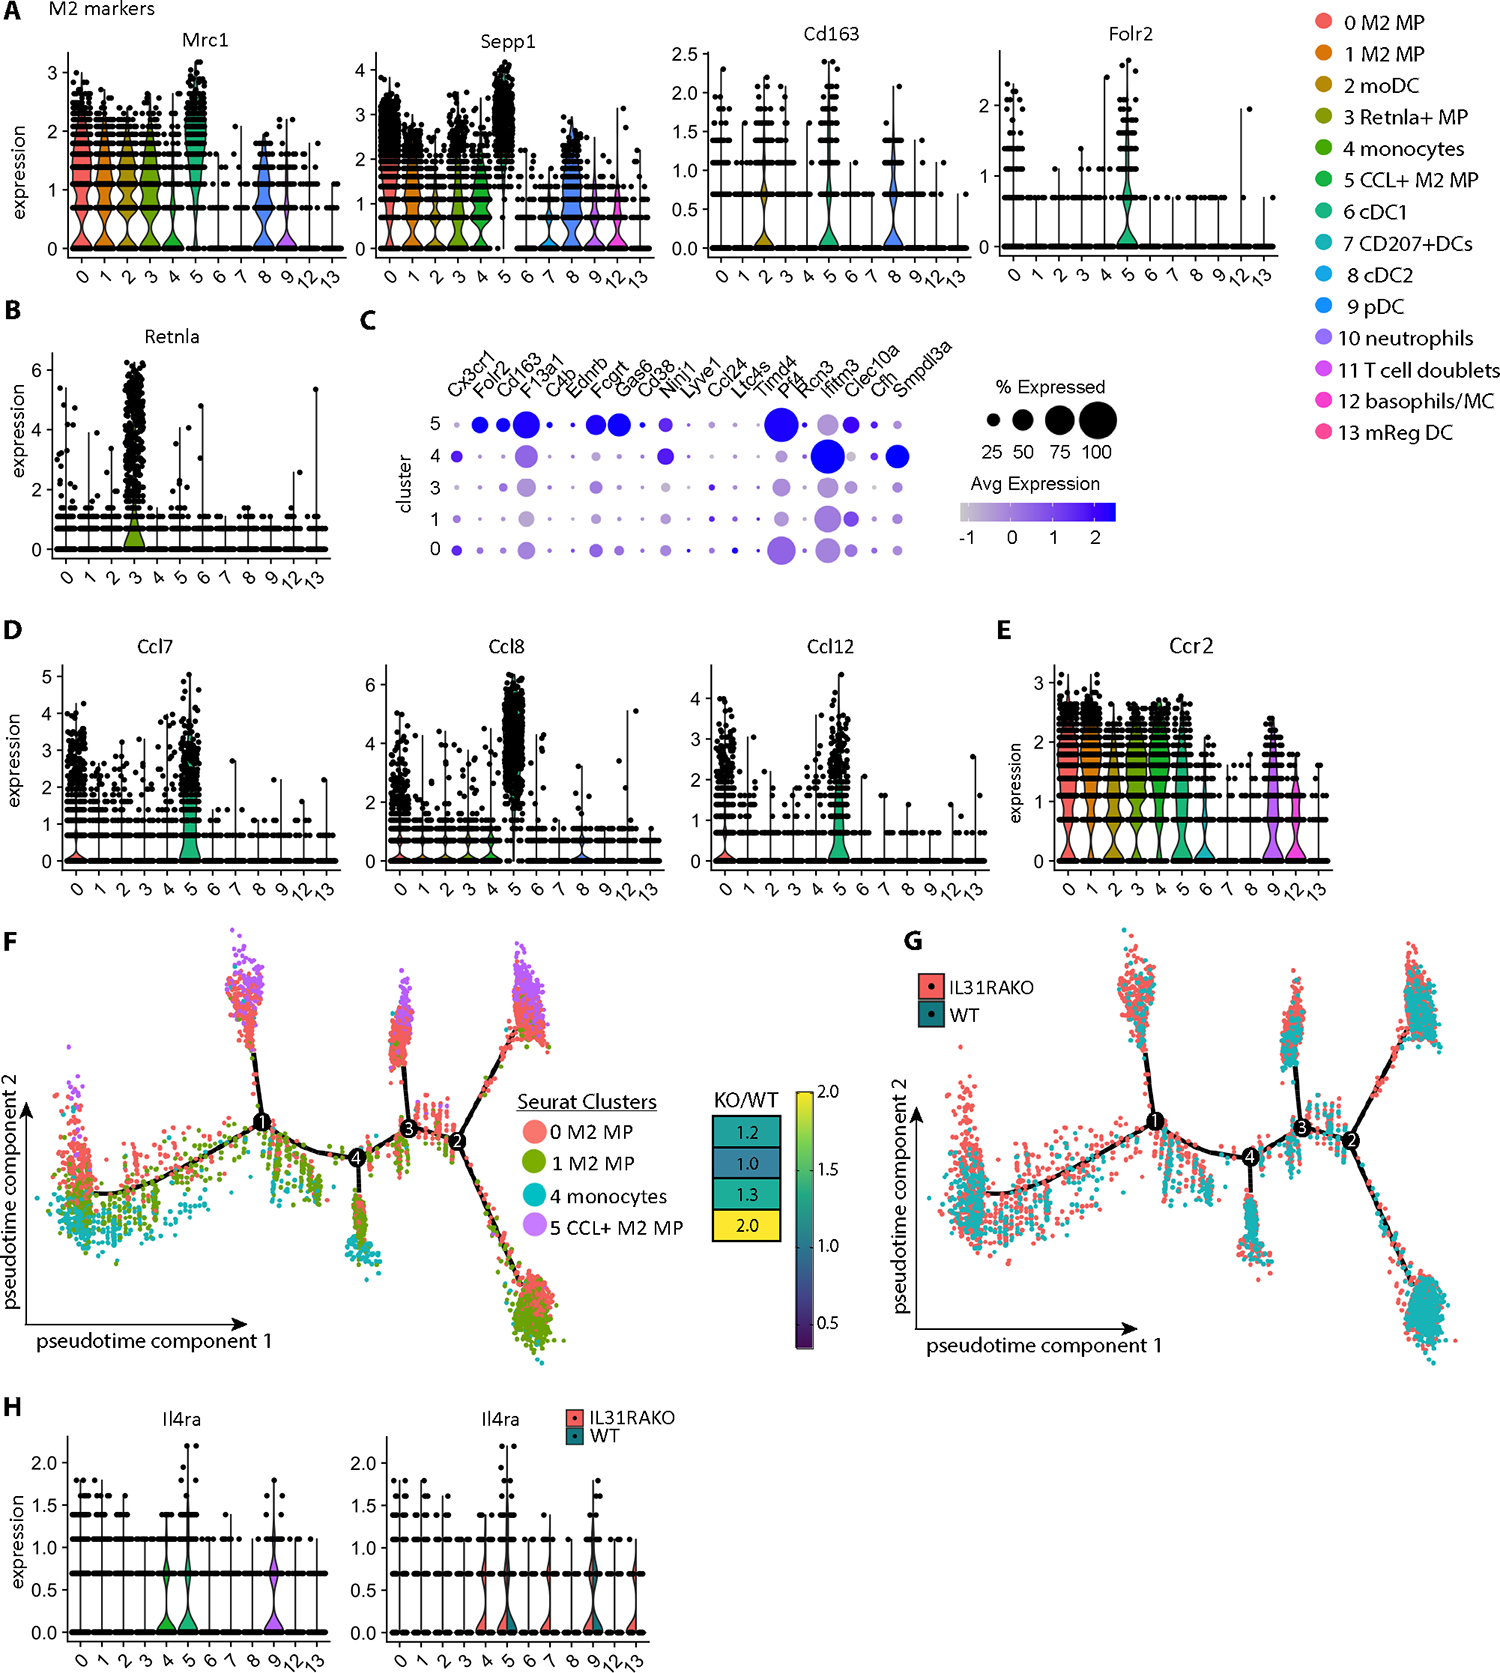
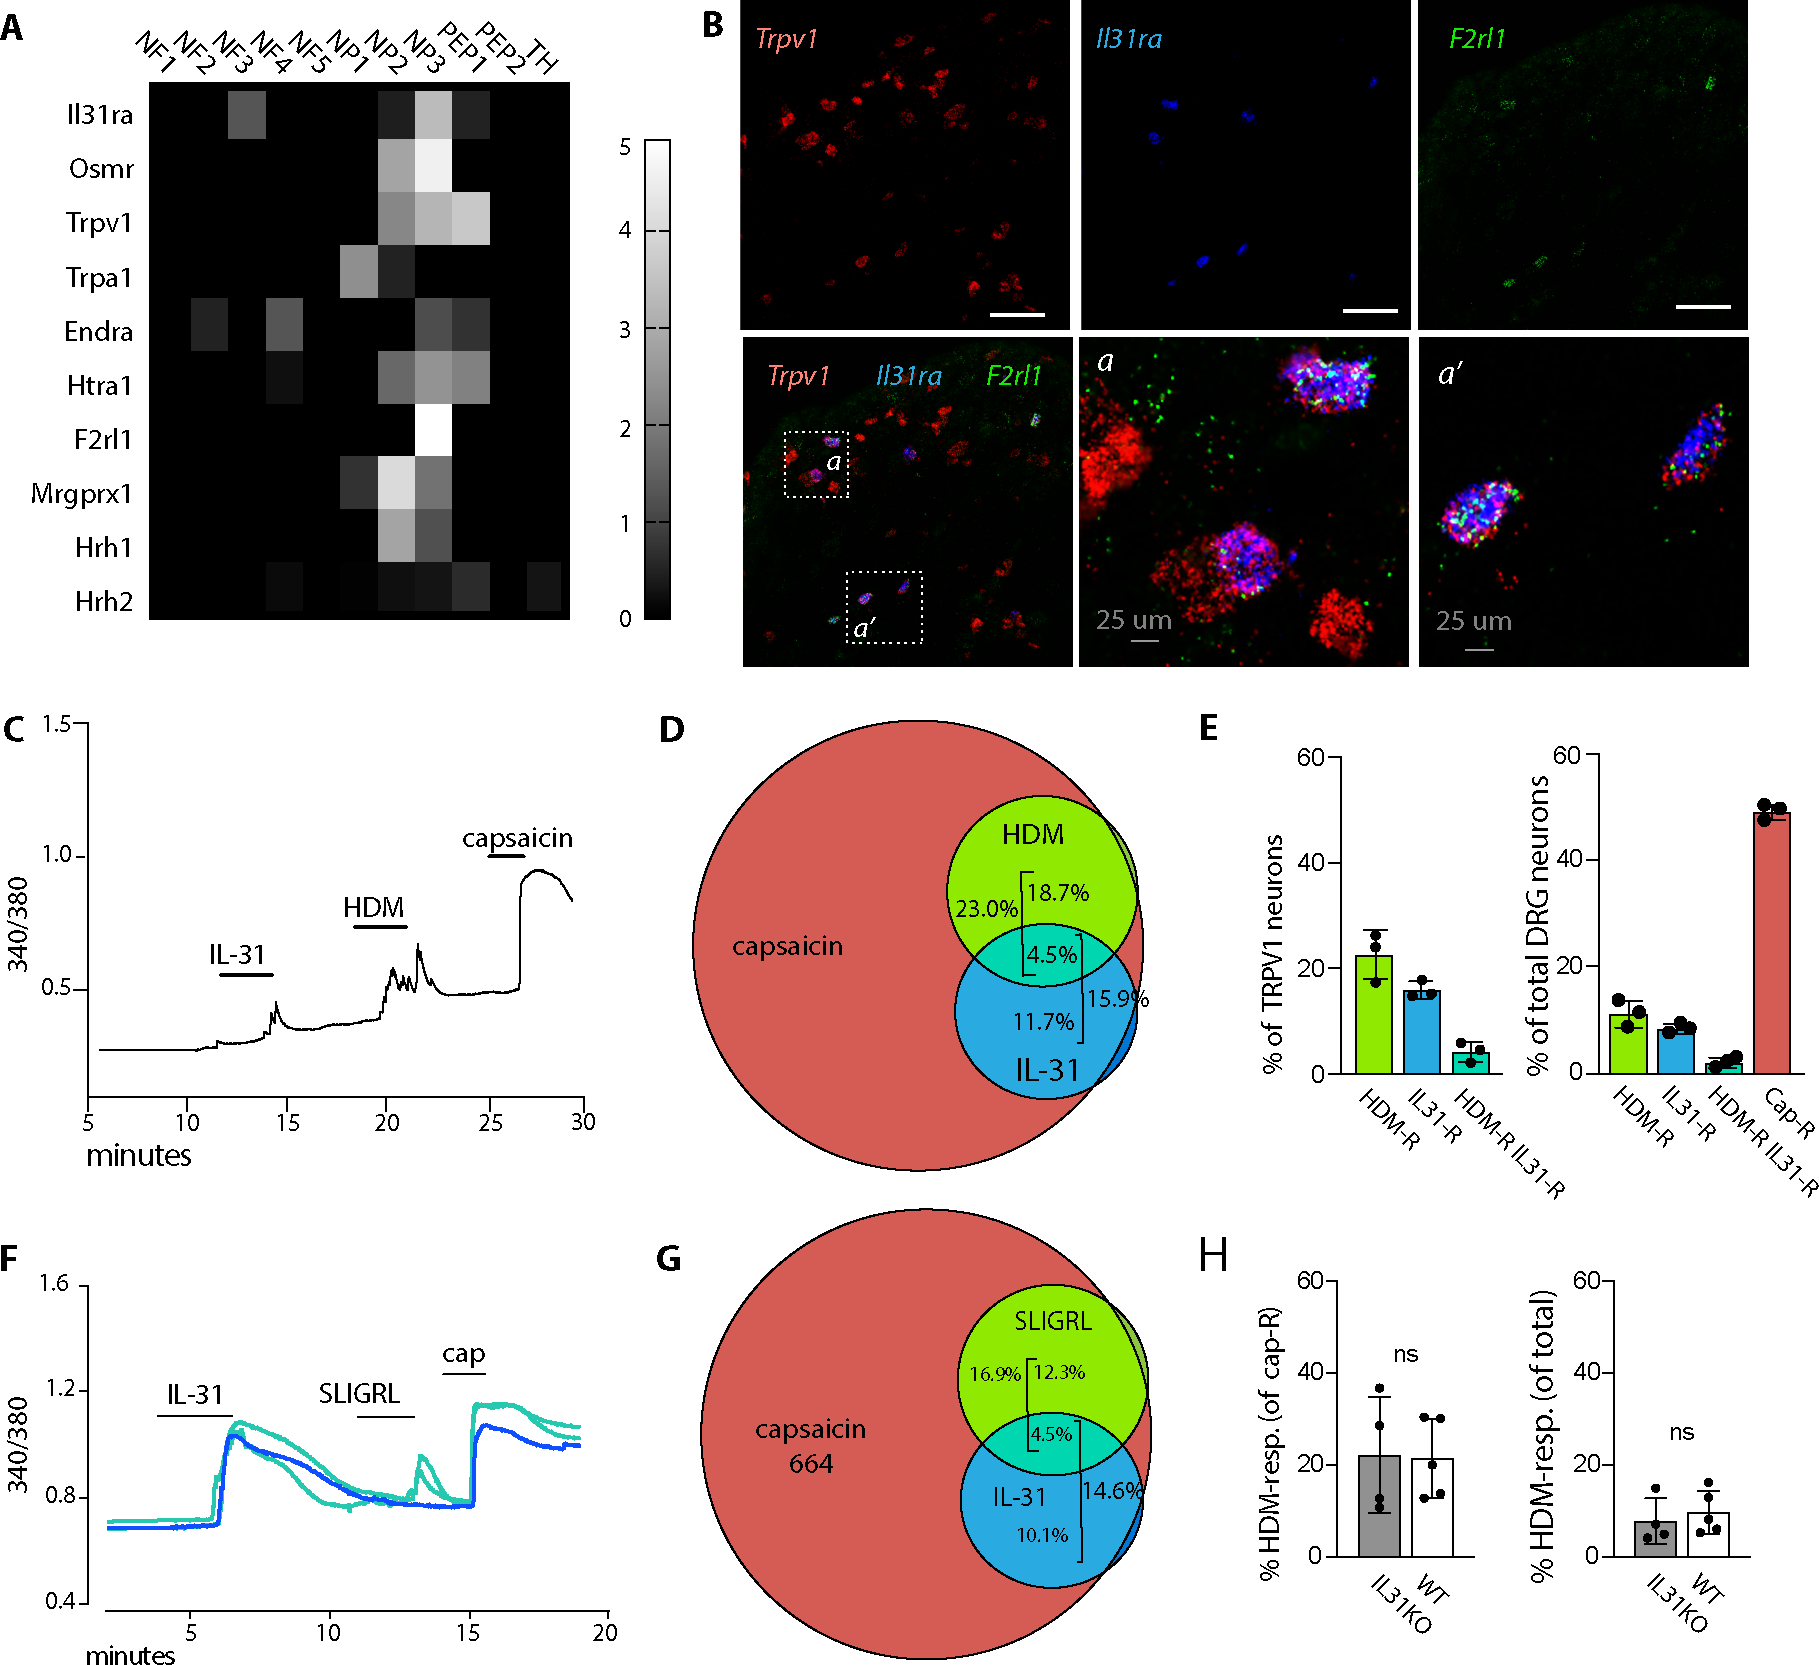
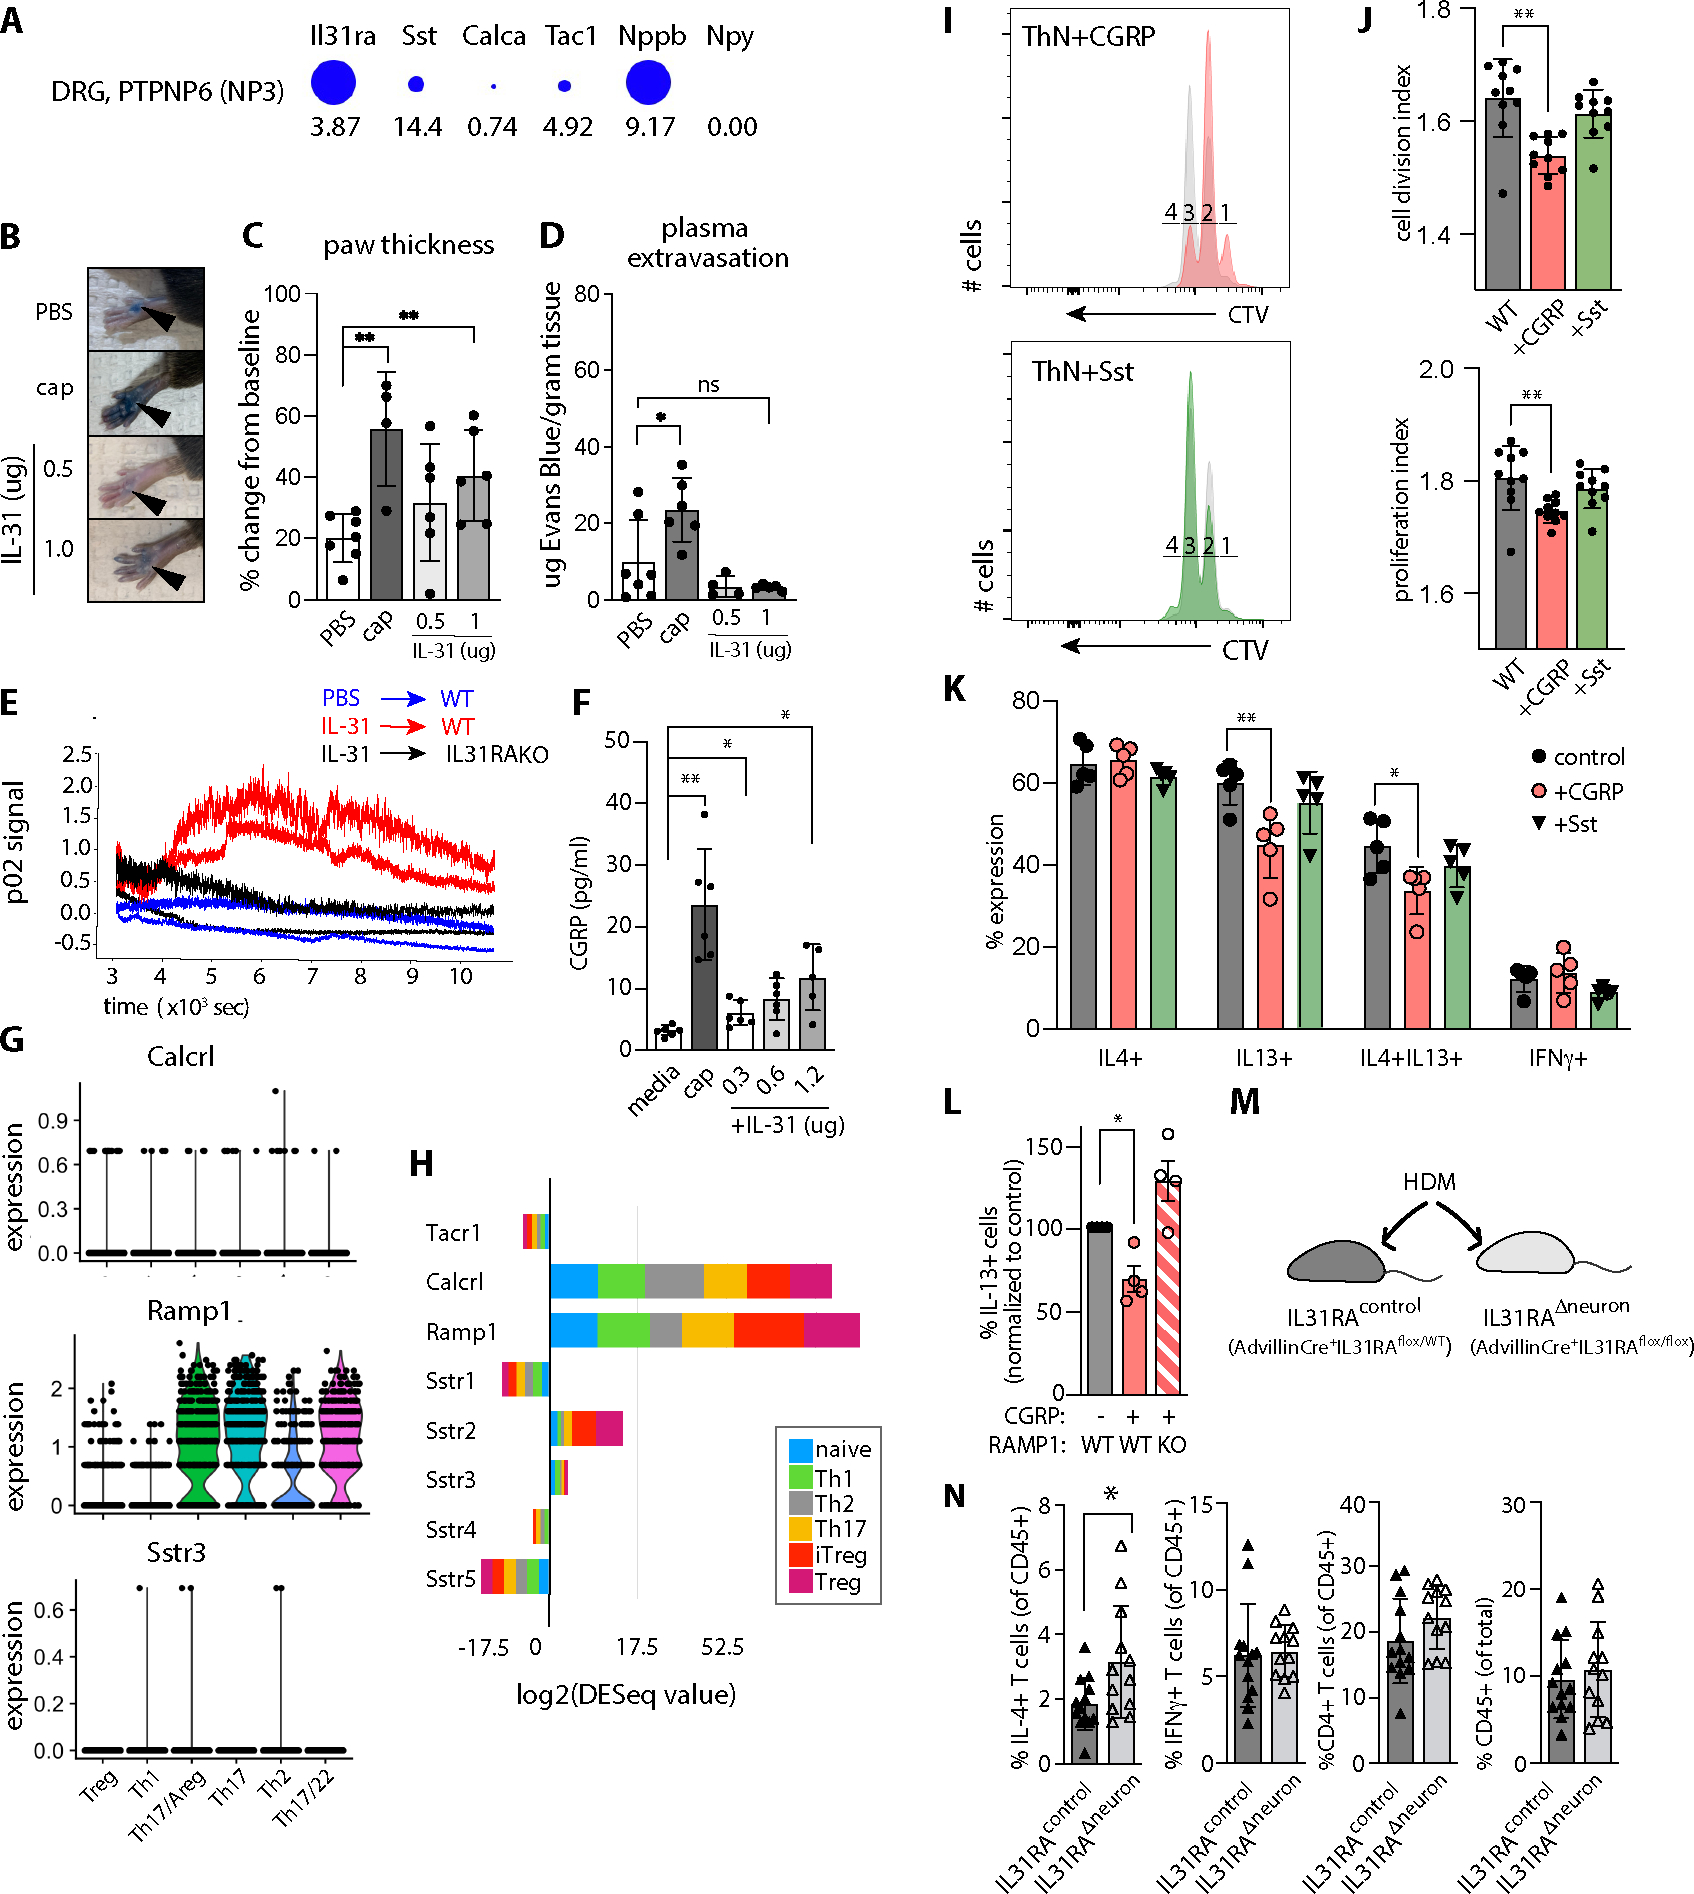
Despite robust literature associating IL-31 with pruritic inflammatory skin diseases, its influence on cutaneous inflammation and the interplay between inflammatory and neurosensory pathways remain unmapped. Here, we examined the consequences of disrupting Il31 and its receptor Il31ra in a mouse model of house dust mite (HDM)-induced allergic dermatitis. Il31-deficient mice displayed a deficit in HDM dermatitis-associated scratching, consistent with its well-established role as a pruritogen. In contrast, Il31 deficiency increased the number and proportion of cutaneous type 2 cytokine-producing CD4+ T cells and serum IgE in response to HDM. Furthermore, Il4ra+ monocytes and macrophages capable of fueling a feedforward type 2 inflammatory loop were selectively enriched in Il31ra-deficient HDM dermatitis skin. Thus, IL-31 is not strictly a proinflammatory cytokine but rather an immunoregulatory factor that limits the magnitude of type 2 inflammatory responses in skin. Our data support a model wherein IL-31 activation of IL31RA+ pruritoceptors triggers release of calcitonin gene-related protein (CGRP), which can mediate neurogenic inflammation, inhibit CD4+ T cell proliferation, and reduce T cell production of the type 2 cytokine IL-13. Together, these results illustrate a previously unrecognized neuroimmune pathway that constrains type 2 tissue inflammation in the setting of chronic cutaneous allergen exposure and may explain paradoxical dermatitis flares in atopic patients treated with anti-IL31RA therapy.


Conflict of interest statement

Competing interests: Authors declare that they have no competing interests.

Figures

Fig. 1.
Fig. 1.. HDM-sensitized IL31KO mice display a deficit in spontaneous scratching
(A) Schematic of the Il31 targeting construct (Il31tm1e(EUCOMM)Wtsi, MGI 1923649). The transgene interrupts the endogenous 3-exon Il31 locus (mm10 ch5:123480419–123482049, minus strand) at position 123481232, introducing loxp sites flanking exon 2. Genetic cross of this transgenic mouse to a β-actin Cre recombinase-expressing strain results in a frameshift mutation and generation of a nonsense transcript (see also Fig. S1). (B) Representative flow cytometry plots for intracellular cytokine staining of in vitro-differentiated Th1 and Th2 WT and IL31KO lymph node CD4+ T cells. Gates indicate percent IL-31+ of live CD4+ cells. (C) Representative flow cytometry plots of IL-4 and IL-13 expression in in vitro-differentiated WT Th2 CD4+ T cells (left panel all cells; right panel gated on IL-31+ cells as in B). (D) Schematic of the 8-week chronic HDM epicutaneous sensitization strategy; behavior monitoring was performed in week 0 (before treatment), week 5, and week 9. (E) Spontaneous scratching bouts (hindpaw) per 30 minute window, measured serially in a cohort of WT and IL31KO animals at week 0 (before treatment), week 5, and week 9 (after completion of treatment), ANOVA p= 0.0196 (*). (F) Spontaneous grooming bouts (forepaw) per 30 minutes, scored in the same videos as B. ANOVA p<0.0001 (****). Black circles, WT; open circles, IL31KO. For B-C, data are representative of 3 independent experiments and datapoints reflect biological replicates, n=3 mice per genotype per condition. For D-F, data are pooled from 2 independent experiments, each with n ≥4 mice per genotype. Each dot represents an individual mouse. Statistical significance was determined by unpaired 2-tailed student’s t-test (B-C) or one-sided Welch’s ANOVA (E-F). Only significant p-values are noted. For all experiments, ns = p>0.05, * = p<0.05, ** = p<0.01, *** = p<0.001, **** = p<0.0001. Error bars show mean +/−SD.
Fig. 2.
Fig. 2.. Increased cytokine-producing CD4+ T cells distinguish dermal infiltrates in HDM-treated IL31KO animals
(A) Representative H&E-stained tissue sections from control and HDM-treated dorsal neck skin at 10x magnification. Scale bar = 100 μm (B) Acanthosis (epithelial proliferation), epithelial hypergranulosis, and dermal inflammatory infiltrate scores for WT, IL31KO (KO), and IL31RAKO (RKO) mouse skin sections, control- or HDM-treated as indicated. Scoring metric: 0= none, 0.5=mild, 1=mild-moderate, 1.5= moderate, 2=severe. One-way Brown-Forsythe ANOVA p<0.0001 for all metrics; post-test pairwise p-values as indicated. (C) Flow cytometry-based quantification of total cellularity (p<0.0001), CD45+ (hematopoietic) cells (p<0.05), CD11b+SiglecF+ eosinophils, and CD4+ T cells (p<0.01). Cells shown per cm2 section of dorsal neck skin. Representative of >3 experiments, with n=3 controls and n≥6 for HDM-treated animals. See Fig. S3 for gating strategy. (D) Percent of HDM-treated skin CD4+ T cells that express IL-4, IL-13, IFN-γ, or IL-17A, as determined by flow cytometry after intracellular antibody staining. Pooled from 2 independent experiments including n=3 for controls and n≥6 mice for HDM. Significance was determined by unpaired 2-tailed student’s t-test. (E) Concatenated flow cytometry plots demonstrate gating for IL-4, IL-13 (left), IFN-γ, and IL-17A intracellular cytokine stains (right). (F) Cytokine expression data from D normalized by percent of CD45+ cells per sample. (G) Percent of HDM-treated WT, IL31KO, and IL31RAKO skin CD4+ T cells that express IL-4 (p<0.01), IL-13 (p<0.01), or IFN-γ ( p<0.01) as determined by flow cytometry after intracellular antibody staining. (H) ELISA-based quantification of serum IgE in WT or after 8 weeks of control- or HDM-treatment in WT and IL31KO. p<0.01. All data points reflect unique biological replicates. Error bars displayed as mean +/−SD. For all experiments, ns = p>0.05, * = p<0.05, ** = p<0.01, *** = p<0.001, **** = p<0.0001. One-sided Welch’s ANOVA with multiple comparisons testing was performed except when indicated. WT, black circles; IL31KO, open circles.
Fig. 3.
Fig. 3.. Selective expansion of cutaneous M2 macrophage subsets in HDM-treated IL31RAKO skin
(A) UMAP plot of merged WT and IL31RAKO scRNA-seq files (combined total 16,284 cells) demonstrates overall clustering by lineage (lymphoid vs myeloid). Individual cells are displayed by genotype using the Seurat shuffle command. Turquoise = WT cells; salmon = IL31RAKO cells. IL31RAKO and WT scRNA-seq files were each generated from sorted CD45+ cells pooled from n=4 animals per group. (B) UMAP plot after subclustering the myeloid cells indicated in A. Top: WT cells; Bottom: IL31RAKO cells. Cell identities of the 13 myeloid cell clusters (inset box) were determined by inspection of cell marker genes identified by differential gene expression (DEG) analysis (see Fig. S5). (C) Heat map depicting proportional representation of IL31KO and WT cells in each myeloid cluster, where numbers reflect the ratio of IL31RAKO to WT cells per cluster after normalization to correct for the 1.72-fold greater number of total cells resolved in the IL31RAKO sequencing file. (D) Dot plots depict expression of the top 10 DEGs for each macrophage cluster mapped across all macrophage clusters (clusters 0,1,3,4,5). (E) Dot plots depict expression of the top 10 DEGs for each dendritic cell cluster (clusters 2,6,7,8,9,13) mapped across all DC clusters. As indicated by the legend, the diameter of each circle indicates the proportion of cells in that cluster that express the gene, and the heat map indicates average expression per cell in that cluster by read count.
Fig. 4.
Fig. 4.. Macrophage subsets enriched in HDM-treated IL31RAKO skin are distinguished by transcripts encoding M2 markers, CCR2 ligands and IL4RA
(A) Violin plots depicting expression of M2 markers Mrc1, Sepp1, Cd163, and Folr2 mapped across myeloid clusters demonstrate enriched expression in multiple macrophage clusters, including 0 and 5. (B) Violin plot depicting expression of M2 marker gene Rentla (Fizz1). (C) Dot plot depicting expression of markers for Cx3cr1low tissue macrophages* in our scRNAseq macrophage clusters. *Genelist extracted from Chakarov et al, Table S3(26)). (D) Additional cluster 5 markers include Ccl7, Ccl8, and Ccl12, CCR2 ligands encoded in a chemokine cluster on mouse chromosome 11. (E) Ccr2 is broadly expressed by macrophages (clusters 0,1,3,4,5), monocyte-derived DCs (cluster 2), pDCs (cluster 9), and basophils/mast cells (cluster 12). (F) Monocle pseudotime plot depicts the developmental trajectory between monocyte and macrophage subpopulations (Seurat clusters 0, 1, 4, 5). DEG markers and branchpoints (1, 2, 3, 4) computationally defined by Monocle are available in Data file S1. Dots indicate individual cells colored to reflect their Seurat cluster identity. (G) Monocle pseudotime plot as in F. Dots indicate individual cells colored to reflect genetic identify (WT or IL31RAKO). (H) Violin plot (left) highlights expression of Il4ra in cluster 5 (CCL+ macrophages) and cluster 9 (pDCs). Split violin plots (right) reveal additional Il4ra expression in IL31RAKO cluster 4 (monocytes), cluster 7 (Cd207+DCs) and cluster 13 (mReg DCs) cells.
Fig. 5.
Fig. 5.. HDM and IL-31 activate partially-overlapping subsets of TRPV1+ sensory afferents
(A) Heat map depicts differential gene expression of select pruritogen receptors in dorsal root ganglia afferent neuron subsets, extracted from Usoskin et al(30). Scale indicates the maximum likelihood estimate of differential expression (log2fold change) in each DRG neuron subset calculated relative to all other DRG subsets, as described in Usoskin et al(30). (B) Representative images of Trpv1, Il31ra, and F2rl1 in situ hybridization in trigeminal ganglia (TG) tissue sections from untreated animals. (C) Representative 340/380 trace from calcium imaging of a Fura-2 loaded lumbar dorsal root ganglion (DRG) neuron double-responsive to IL-31 and HDM. Capsaicin response indicates that the neuron is TRPV1+. (D) Venn diagram indicating the proportion of WT DRG neurons responding to each of the indicated ligands (capsaicin, HDM, and recombinant IL-31). Capsaicin response marks TRPV1+ neurons. (E) Quantification of DRG neurons responsive to the indicated ligands. Each dot represents the average % responding cells from at least 4 coverslips from a single animal. Left panel TRPV1+ (capsaicin-responsive), right side all neurons. (F) Representative 340/380 traces from calcium imaging of Fura-2 loaded lumbar DRG neurons that were monoresponsive to IL-31 (blue) or double-responsive to IL-31 and SLIGRL (turquoise). Capsaicin (cap) responses indicate TRPV1+ neurons. (G) Venn diagram indicating the proportion of WT DRG neurons responding to each of the indicated ligands (capsaicin, SLIGR, and IL-31). (H) Quantification of % DRG neurons responsive to HDM in WT (black bars) or IL31KO (open bars). Each dot represents the average % responding cells from at least 4 coverslips from a single animal. Numbers indicate total responding neurons recorded from at least 4 mice per genotype (D, E, G); and 5 each of WT mice and IL31KO mice (H). Error bars displayed as mean +/−SD.
Figure 6.
Figure 6.. IL-31-induced neuronal CGRP release reduces T cell proliferation and IL-13 production.
A) Il31ra and neuropeptide expression in NP3 DRG neurons. Diameter indicates proportion of cells expressing the gene, numbers indicate expression relative to other sequenced cells in the dataset. Data extracted from (30, 62) using mousebrain.org visualization tools. B) Mouse hindpaw images after retro-orbital Evans Blue injection and plantar paw injection with PBS, capsaicin (cap) or recombinant mouse(rm) IL-31. Note: Focal blue injection site staining of stratum corneum is expected. C) Percent change in paw thickness immediately prior to and 15 minutes after PBS, capsaicin, or rmIL-31 intradermal paw injection. Mixed-effects model testing p=0.0282 (*), pairwise post-test probabilities n.s. D) Quantification of Evans Blue dye in paw tissue harvested 15 minutes after PBS, cap, or rmIL-31 intradermal injection. Mixed-effects model testing p=0.0123 (*), post-test probabilities nonsignificant. E) Quantification of local blood flow measured by Oxyflow probe applied to mouse paw, immediately after injection of IL-31 or PBS. F) CGRP concentration in TRG neuron culture media after 30 minute incubation with capsaicin or rmIL-31. Representative of 3 experiments. Welch’s one-way ANOVA 0.0006; post-test probabilities as indicated. G) Neuropeptide receptor expression in HDM-treated skin CD4+ T cell subsets. Tacr1 not detected. H) Neuropeptide receptor expression in in vitro-polarized CD4+ T cell subsets, data extracted from ThExpress(37). I) CellTrace Violet (CTV) dilution histograms as a measure of mouse lymph node CD4+ T cell proliferation in culture. Colored histograms depict T cells cultured in the presence of neuropeptides as indicated (CGRP orange, Sst green), overlaid on paired controls (grey). Numbers indicate cell division gates where 1 = undivided cells. J) Cell division index (upper panel) and proliferation index (lower panel) of CTV-labeled CD4+ T cells cultured +/−neuropeptides as indicated. Representative of 3 experiments. Wilcoxon matched-pairs signed rank test for division index p=0.0003, proliferation index p=0.0037). K) Effector cytokine expression in in vitro-differentiated CD4+ T cells cultured +/− neuropeptides: CGRP (orange bars), somatostatin (green bars), or no neuropeptide (control, grey bars). IL-4+ (left panel, n.s.), IL-13+ (left center; one-way Welch’s ANOVA p=0.0019, pairwise post-test significance as indicated), IL-4+IL-13+ (right center; one-way Welch’s ANOVA p=0.0042, pairwise post-test significance as indicated), or IFNγ+ (right, n.s.). L) Percent IL-13+ CD4+ T cells in in vitro-differentiated WT or RAMP1KO T cellscultured in the presence or absence of CGRP. Brown-Forsythe one-sided ANOVA, p=0.0108 (*). M) Advillin-Cre+.Il31raflox/flox (Il31raΔneuron) mice exhibit conditional ablation of Il31ra in Advillin+ cells (sensory and sympathetic neurons). Advillin-Cre+.Il31raflox/WT littermates were used as controls for HDM dermatitis (N). N) Flow cytometry-based quantification of skin cell populations from HDM-treated Advillin-Cre+IL31raflox/WT (=IL31raflox/WT) and Advillin+IL31raflox/flox (=IL31Δneuron) mouse dorsal skin: IFN-γ+ CD4+ T cells, IL-13+ CD4+ T cells, total CD4+ T cells, CD45+ cells. Representative of 2 experiments, n≥5/group for HDM-treated animals. Significance determined by unpaired 2-tailed student’s t-test. See Fig. S3 for gating strategy. Data points reflect biological replicates. Error bars displayed as mean +/−SD. For all experiments, ns = p>0.05, * = p<0.05, ** = p<0.01, *** = p<0.001, **** = p<0.0001.

References

    1. S. R. Dillon et al., Interleukin 31, a cytokine produced by activated T cells, induces dermatitis in mice. Nat. Immunol. 5, 752–760 (2004). - PubMed
    1. Cevikbas F et al., A sensory neuron-expressed IL-31 receptor mediates T helper cell-dependent itch: Involvement of TRPV1 and TRPA1. J. Allergy Clin. Immunol. 133, 448–460 (2014). - PMC - PubMed
    1. Kabashima K, Matsumura T, Komazaki H, Kawashima M, Nemolizumab JPSG, Trial of Nemolizumab and Topical Agents for Atopic Dermatitis with Pruritus. N. Engl. J. Med. 383, 141–150 (2020). - PubMed
    1. Stander S et al., Trial of Nemolizumab in Moderate-to-Severe Prurigo Nodularis. N. Engl. J. Med. 382, 706–716 (2020). - PubMed
    1. Takamori A et al., IL-31 is crucial for induction of pruritus, but not inflammation, in contact hypersensitivity. Sci. Rep. 8, 6639 (2018). - PMC - PubMed

Publication types