. 2023 Oct 13;9(41):eadi1411.
doi: 10.1126/sciadv.adi1411. Epub 2023 Oct 13.

Glial-derived mitochondrial signals affect neuronal proteostasis and aging

Affiliations

Glial-derived mitochondrial signals affect neuronal proteostasis and aging

Raz Bar-Ziv et al. Sci Adv. .

Abstract

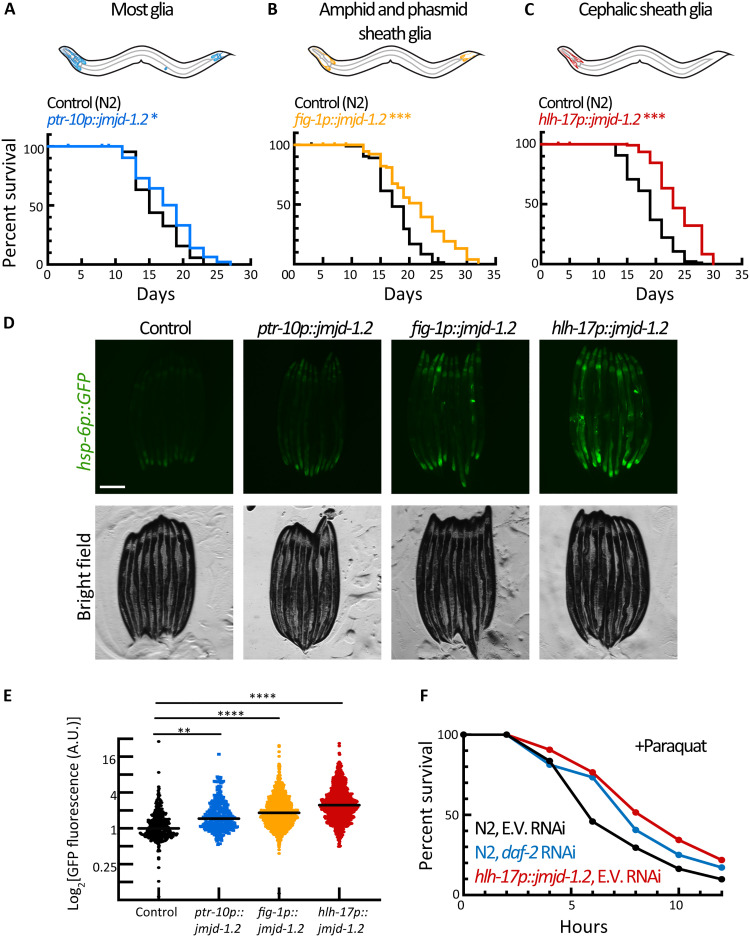
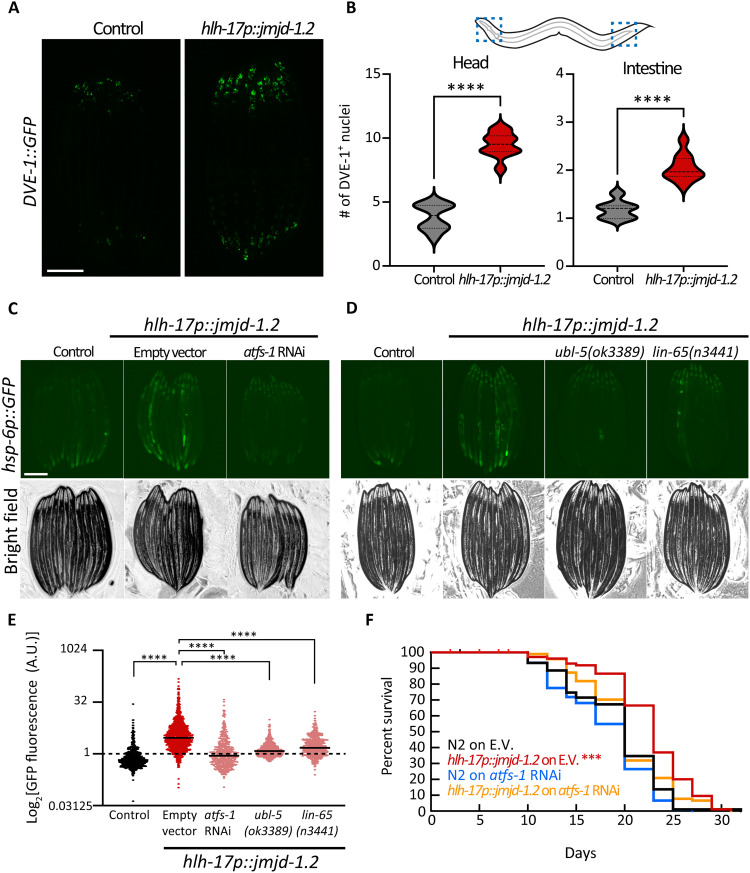
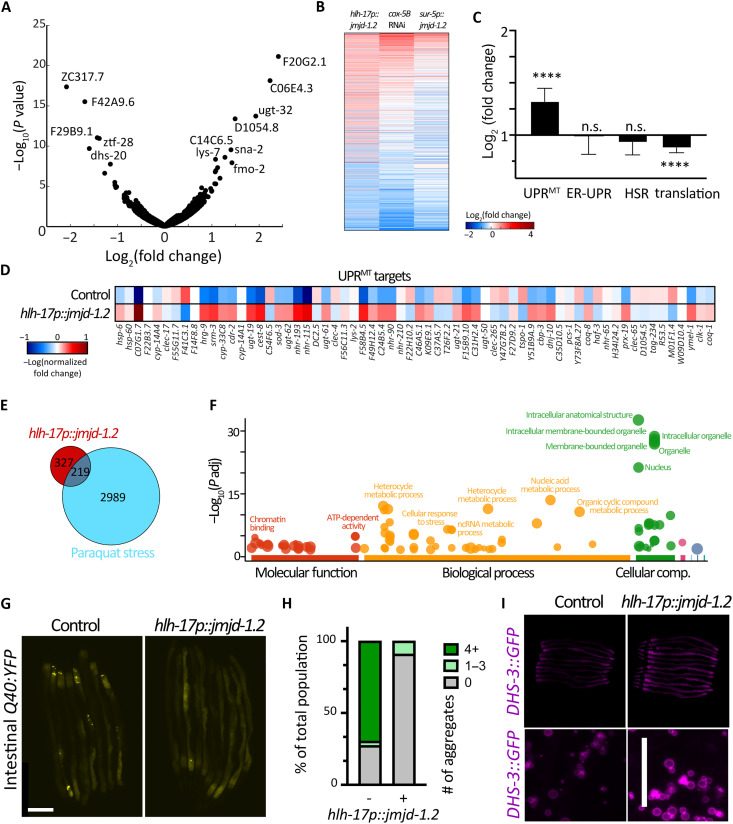
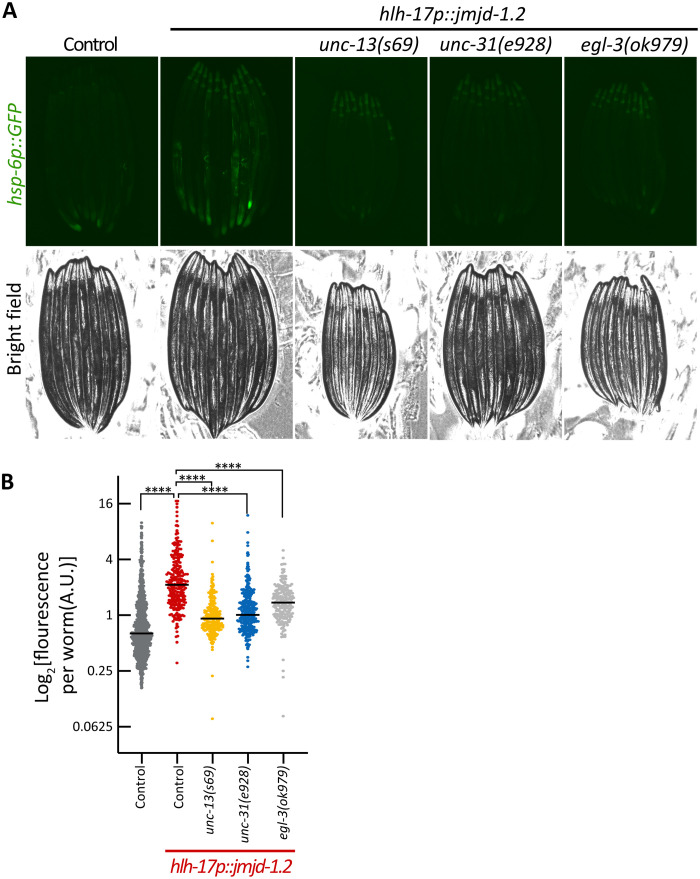
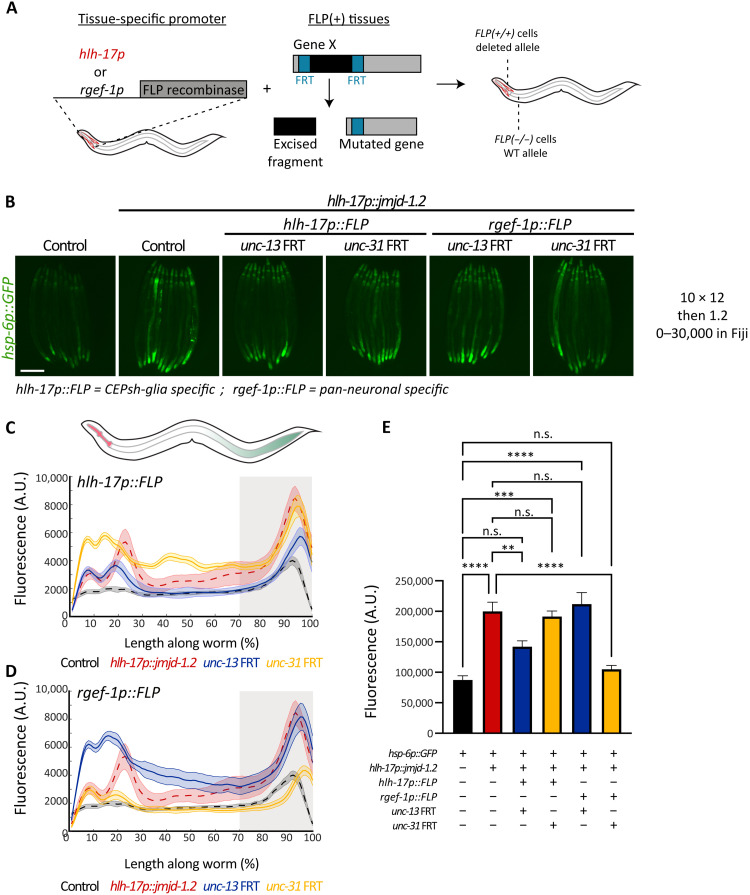
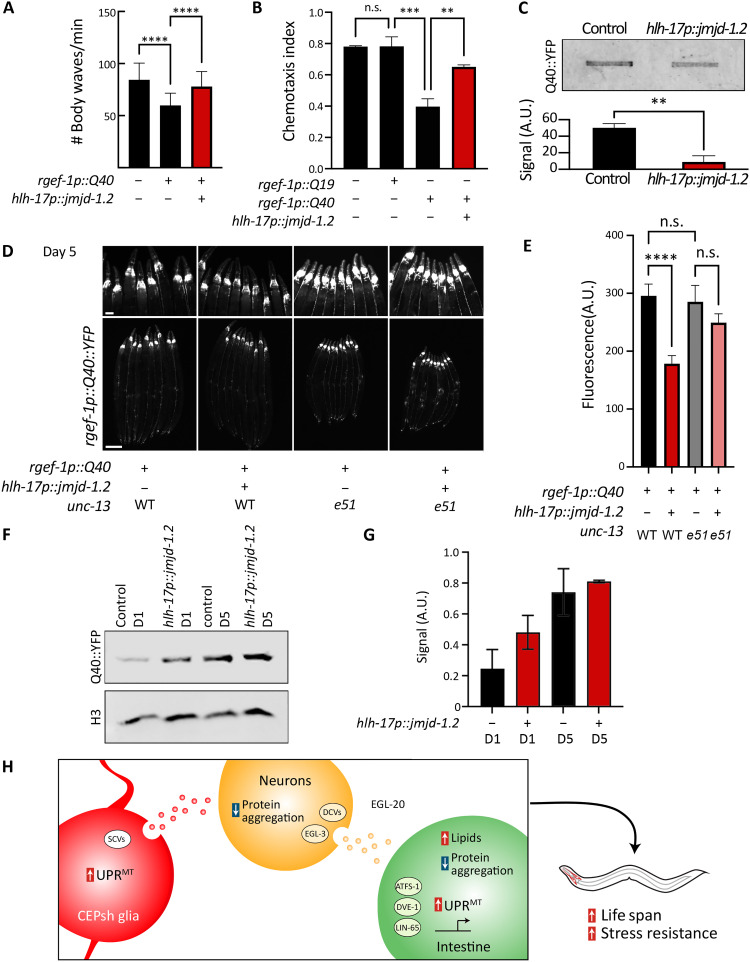
The nervous system plays a critical role in maintaining whole-organism homeostasis; neurons experiencing mitochondrial stress can coordinate the induction of protective cellular pathways, such as the mitochondrial unfolded protein response (UPRMT), between tissues. However, these studies largely ignored nonneuronal cells of the nervous system. Here, we found that UPRMT activation in four astrocyte-like glial cells in the nematode, Caenorhabditis elegans, can promote protein homeostasis by alleviating protein aggregation in neurons. Unexpectedly, we find that glial cells use small clear vesicles (SCVs) to signal to neurons, which then relay the signal to the periphery using dense-core vesicles (DCVs). This work underlines the importance of glia in establishing and regulating protein homeostasis within the nervous system, which can then affect neuron-mediated effects in organismal homeostasis and longevity.


Figures

Fig. 1.
Fig. 1.. Glial activation of jmjd-1.2 prolongs life span, improves stress resistance, and induces the cell nonautonomous UPRMT.
(A) Survival of animals expressing jmjd-1.2 in most glia (blue) compared to a control N2 population (black). *P = 0.0158. (B) Survival of animals expressing jmjd-1.2 in amphid and phasmid sheath glia (orange) compared to a control N2 population. Log-rank test, ***P < 0.001. (C) Survival of animals expressing jmjd-1.2 in the CEPsh glia (red) compared to a control N2 population. ***P < 0.001. (D) Representative fluorescent micrographs of UPRMT reporter worms (hsp-6p::GFP) expressing jmjd-1.2 under the indicated promoters. Scale bar, 250 μm. (E) Integrated fluorescence intensity is measured across an entire worm using a large-particle biosorter and normalized to size as described in Methods. Fold change was calculated normalized to a control (hsp-6p::GFP) population (n > 300 per group). One-way analysis of variance (ANOVA) with Tukey’s multiple comparisons test, **P < 0.01 and ****P < 0.0001. See also fig. S1G. A.U., arbitrary units. (F) Survival of animals expressing glial jmjd-1.2 (red) under paraquat stress as compared to a control population (black). Day 1 adult animals were exposed to 100 mM paraquat in M9 solution and scored every 2 hours for survival. Worms fed with daf-2 RNA interference (RNAi) were used as a positive control (green) (n = 60 per group); see also fig. S1H.
Fig. 2.
Fig. 2.. Nonautonomous activation of UPRMT in the periphery depends on cell-autonomous regulators of the pathway UPRMT.
(A) Representative fluorescent micrograph of UPRMT translational reporter worms (DVE-1::GFP) expressing jmjd-1.2 under the CEPsh glia (hlh-17) promoter at day 1 of adulthood. Scale bar, 250 μm. (B) The number of DVE-1::GFP foci (i.e., nuclei) was counted in a defined area per worm (n > 30), which we called “head” and distal “intestine” as shown in schematic. Significant changes were assessed relative to control by unpaired Student’s t test, ****P < 0.0001. (C and D) Representative fluorescent micrograph of UPRMT reporter worms (hsp-6p::GFP) expressing jmjd-1.2 either knocked down (C) or knocked out (D) for key regulators in UPRMT activation at day 1 of adulthood and quantified in (E), as in Fig. 1E (n > 450). One-way ANOVA with Tukey’s multiple comparisons test. n.s., not significant; ****P < 0.0001. See also fig. S2. (F) Survival of animals expressing jmjd-1.2 in CEPsh glia grown on either control (E.V.) or atfs-1 RNAi compared to N2 on E.V. (control); ***P < 0.001. Other conditions are not significantly different from control.
Fig. 3.
Fig. 3.. Activation of jmjd-1.2 in CEPsh glia reduces protein aggregation, increases lipid content in the intestine, and triggers the UPRMT transcriptional program.
(A) Changes in gene expression in CEPsh glia expressing jmjd-1.2 as compared to N2 control animals are represented in a volcano plot (for RNA-seq analysis, data are compared using two biological replicates for N2 control and three biological replicates for hlh-17p::jmjd = 1.2). (B) Differentially expressed genes in glial jmjd-1.2 worms compared to their change in published datasets of mitochondrial stress induced by electron transport chain knockdown by RNAi (cox-5B RNAi) or overexpression of jmjd-1.2 in all worm tissues (17). (C) The average change in gene expression of the indicated gene groups (see Methods) as compared to N2 control animals. UPRMT genes are shown in (D). HSR, heatshock response. (E) Overlap of induced genes in glial jmjd-1.2 worms with genes induced in paraquat stress. (F) Gene enrichment analysis was plotted using gProfiler (61). (G) Representative fluorescent micrographs of protein aggregation (Q44::YFP) in the intestine of worms expressing jmjd-1.2 under the CEPsh glia (hlh-17) promoter at day 3 of adulthood. Scale bar, 250 μm. (H) Quantification of number of fluorescent foci (i.e., aggregates) per worm using Fiji local extrema analysis (63) (n < 30). (I) Representative fluorescent images of lipid droplets reporter animals (DHS-3::GFP), either in control animals or animals expressing jmjd-1.2 in CEPsh glia cells at day 1 of adulthood. Images of aligned whole worms (n > 10) were acquired on a stereomicroscope (top) to visualize whole-animal changes in lipid droplet levels, and via high-resolution compound microscopy (bottom) to visualize size and morphology of lipid droplets. Quantification in fig. S3E.
Fig. 4.
Fig. 4.. Cell nonautonomous activation of the UPRMT in the intestine depends on the secretion of SCVs, DCVs, and neuropeptide processing.
(A) Representative fluorescent micrographs of UPRMT reporter worms (hsp-6::GFP) for animals with mutations in the secretion of SCVs (unc-13), DCVs (unc-31), and neuropeptide processing (egl-3) at day 1 of adulthood. Scale bar, 250 μm. (B) Quantification of UPRMT reporter worms (hsp-6::GFP) as in Fig. 1E (n > 200). ****P < 0.0001.
Fig. 5.
Fig. 5.. CEPsh glia require functional UNC-13 (SCV), while neurons require UNC-31 (DCV), to activate UPRMT in the periphery.
(A) Schematic of spatial mutation strategy. Expression of the flipase FLP D5 under the CEPsh glial-specific (hlh-17p) or pan-neuronal (rgef-1p) promoters, in combination with an independent FRT (FLP recognition target) allele of a gene of interest results in a tissue-specific mutation. (B) Representative fluorescent micrographs of the indicated strains at day 1 adult animals. Scale bar, 250 μm. (C and D) Median spatial profiles of the indicated animals (see Methods), for depletion in CEPsh glial cells (C) or neuronal cells (D) quantified with large particle biosorter (n > 50). The integrated fluorescence intensity of the 30% most posterior portion of the animals was calculated and plotted in (E). One-way ANOVA with Tukey’s multiple comparisons test, ***P < 0.001 and ****P < 0.0001.
Fig. 6.
Fig. 6.. Glial jmjd-1.2 rescues protein aggregation in neurons in an HD model via SCVs.
(A) Thrashing of animals expressing the aggregating polyQ tract Q40, with and without glial jmjd-1.2, measured using WormTracker (64) (n > 100). (B) Chemotaxis index of worms toward benzaldehyde (n > 200). (C) Filter retardation assay for Q40::YFP (39), with and without glial jmjd-1.2 (top) and its quantification using integrated intensity measurements in Fiji (bottom). Data are representative of three independent biological replicates. (D) Representative fluorescent micrographs of Q40::YFP for the annotated genotypes on day 5 of adulthood. See fig. S6 for images of worms at day 1. WT, animals expressing wild-type copy of unc-13; e51, animals expressing loss of function mutant unc-13(e51). (E) Integrated fluorescence intensity measurements of Q40::YFP in the head region of the animals (n > 30) using Fiji. One-way ANOVA with Tukey’s multiple comparisons test; **P < 0.01, ***P < 0.001, and ****P < 0.0001. (F) Representative blot of neuronal Q40::YFP protein at days 1 and 5 of adulthood in control (N2) and glial jmjd-1.2 (hlh-17p::jmjd-1.2) animals. Total Q40::YFP expression was measured via standard Western blots in whole worm lysates using a standard anti-GFP antibody. Signal intensity was quantified using integrated intensity measurements in Fiji in (G) and normalized to an H3 load control. Measurements in (G) were performed on two biological replicates, and data are presented as means ± SD. (H) Model of communication from glial cells to peripheral tissues. CEPsh glia use SCVs upon UPRMT activation to signal to neurons, which reduce protein aggregation and use DCVs, neuropeptide processing, and a WNT ligand to drive protein homeostasis and metabolic changes in the periphery.

Update of

References

    1. Douglas P. M., Dillin A., Protein homeostasis and aging in neurodegeneration. J. Cell Biol. 190, 719–729 (2010). - PMC - PubMed
    1. Koga H., Kaushik S., Cuervo A. M., Protein homeostasis and aging: The importance of exquisite quality control. Ageing Res. Rev. 10, 205–215 (2011). - PMC - PubMed
    1. Alcedo J., Flatt T., Pasyukova E. G., Neuronal inputs and outputs of aging and longevity. Front. Genet. 4, 71 (2013). - PMC - PubMed
    1. Taylor R. C., Berendzen K. M., Dillin A., Systemic stress signalling: Understanding the cell non-autonomous control of proteostasis. Nat. Rev. Mol. Cell Biol. 15, 211–217 (2014). - PMC - PubMed
    1. Sweeney P., Park H., Baumann M., Dunlop J., Frydman J., Kopito R., McCampbell A., Leblanc G., Venkateswaran A., Nurmi A., Hodgson R., Protein misfolding in neurodegenerative diseases: Implications and strategies. Transl. Neurodegener. 6, 6 (2017). - PMC - PubMed

Substances