. 2023 Oct 13;9(41):eadi7439.
doi: 10.1126/sciadv.adi7439. Epub 2023 Oct 13.

The phonon quantum of thermal conductance: Are simulations and measurements estimating the same quantity?

Affiliations

The phonon quantum of thermal conductance: Are simulations and measurements estimating the same quantity?

Carlos A Polanco et al. Sci Adv. .

Abstract

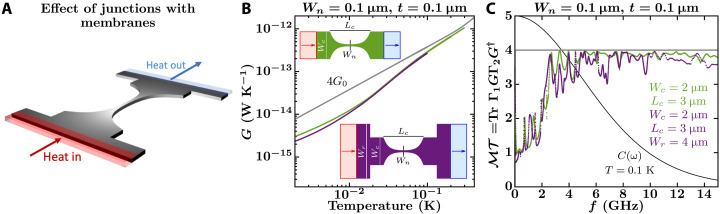
The thermal conductance quantum is a fundamental quantity in quantum transport theory. However, two decades after its first reported measurements and calculations for phonons in suspended nanostructures, reconciling experiments and theory remains elusive. Our massively parallel calculations of phonon transport in micrometer-sized three-dimensional structures suggest that part of the disagreement between theory and experiment stems from the inadequacy of macroscopic concepts to analyze the data. The computed local temperature distribution in the wave ballistic nonequilibrium regime shows that the spatial placement and dimensions of thermometers, heaters, and supporting microbeams in the suspended structures can noticeably affect the thermal conductance's measured values. In addition, diffusive transport assumptions made in the data analysis may result in measured values that considerably differ from the actual thermal conductance of the structure. These results urge for experimental validation of the suitability of diffusive transport assumptions in measuring devices operating at sub-kelvin temperatures.


Figures

Fig. 1.
Fig. 1.. Comparison of experimental and simulated thermal conductance.
(A) Simplified sketch of the top view of the experiment in (9). (B) Simplified sketch of a catenary-shaped structure connected to ideal thermal baths that drive heat across the nanowire. (C) Simplified sketch of the top view of the experiment in (14). (A) to (C) The catenary-shaped structure of interest is highlighted by a yellowish-shaded area. Outside this yellowish region is the measuring platform with the heat sources (heaters) represented by reddish regions, the thermometers by purple regions, and the heat sinks by blue regions. The suspended SiN sheets correspond to the gray-shaded regions. (D) Thermal conductance normalized by the QTC, G0=(π2kB2T)/(3h). Solid curves show our NEGF simulations for an infinitely long nanowire with a cross-sectional area of 180 nm by 60 nm (gray curve) and for a catenary-shaped structure (green curve) similar to that in Schwab’s experiment (9). Reddish triangles correspond to measurements in (9), and the dashed reddish curve shows previous calculations in (10). (E) NEGF calculations of thermal conductance for an infinitely long nanowire with a cross-sectional area of 100 nm by 100 nm (gray curve) and for catenary-shaped structures (blue, red, yellow, and purple curves) similar to those in Tavakoli’s experiments (14). Triangles show measurements in (14). (F and G) Total phonon transmission computed from NEGF for the nanowires and catenary-shaped structures of subfigure (D) and (E), respectively. The monotonically decreasing black curves correspond to the mode heat capacity (see Eq. 1) at the labeled temperatures normalized by 10/kB.
Fig. 2.
Fig. 2.. Effect on the thermal conductance of the junctions between the membranes and the catenary-shaped structure.
(A) Sketch of a catenary-shaped structure abruptly connected to wider nanoribbons at the edges. (B and C) NEGF calculations of the conductance, G, and total phonon transmission, ℳ𝒯, of a catenary-shaped structure with (purple curves) and without (green curves) abrupt junctions at the edges. The structures in question are shown as insets and are defined by Wc = 2 μm, Lc = 3 μm, Wn = 0.1 μm, t = 0.1 μm, and Wr = 4 μm. The monotonically decreasing black curve in (C) corresponds to the mode heat capacity (see Eq. 1) at the labeled temperature normalized by 5/kB. The gray curves in (B) and (C) show the conductance and total transmission of an infinitely long nanowire with a cross-sectional area of 0.1 μm by 0.1 μm.
Fig. 3.
Fig. 3.. Effect on the thermal conductance of the top contacts.
(A) Sketch of a catenary-shaped structure where heat is injected and ejected perpendicular to the plane of the structure. (B and C) NEGF calculations of the conductance, G, and total phonon transmission, ℳ𝒯, of a catenary-shaped structure with heat injected and ejected parallel (green curves) and perpendicular (yellow and purple curves) to the plane of the structure. For those structures with heat injected perpendicular to the structure plane, the contacts are semi-infinite squared nanowires with side a = 0.2 μm (yellow curves) and a = 0.6 μm (purple curves). The top views of the structures being compared are depicted as insets, with the catenary-shaped structures defined by Wc = 0.6 μm, Lc = 1 μm, Wn = 0.1 μm, and t = 0.1 μm. The gray curves in (B) and (C) show the conductance and total transmission of an infinitely long nanowire with a cross-sectional area of 0.1 μm by 0.1 μm.
Fig. 4.
Fig. 4.. Effect on the thermal conductance of the supporting beams.
(A) Sketch of a catenary-shaped structure with the supporting beams that hold the structure suspended. In this case, heat is injected perpendicular to the plane of the structure, and it is ejected parallel to the plane of the structure at the edges of the beams. (B and C) NEGF calculations of the conductance, G, and total phonon transmission, ℳ𝒯, of a catenary-shaped structure with (purple curves) and without (green curves) supporting beams. For the structure with beams, conductance and transmission are computed from the heater to all the heat sinks on the opposite side of the nanowire. Insets show the top view of the structures being contrasted, with the catenary-shaped structures defined by Wc = 1 μm, Lc = 1 μm, Wn = 0.1 μm, and t = 0.1 μm. The gray curves in (B) and (C) show the conductance and total transmission of an infinitely long nanowire with a cross-sectional area of 0.1 μm by 0.1 μm.
Fig. 5.
Fig. 5.. Simulation of Tavakoli’s platform to measure the thermal conductance of a nanowire.
(A and B) Top view of simulated measuring and calibration platforms. Heat is injected perpendicular to the structure plane but ejected parallel to that plane, similar to Fig. 4A. The catenary-shaped structure has dimensions Wc = 1 μm, Lc = 1 μm, Wn = 0.1 μm, and t = 0.1 μm, while each membrane is 1 μm by 1 μm, and the width of each supporting beam is 0.3 μm. The thermometer labeled T4 in (B) is below the heater. In addition, note that the heater is above the plane of the structure, while all the thermometers are in the top surface plane of the structure. (C) Simulated conductance measurements of the catenary-shaped structure within the measuring platform (purple, yellow, and orange dots). The green curve shows the conductance of the catenary-shaped structure with ideal heat baths at its edges, as shown by the inset, and the gray curve shows the conductance of an infinitely long nanowire with a cross section of 0.1 μm by 0.1 μm. (D) Simulated conductance measurements of the supporting beams (Gb and Gb*) within the calibration platform. Conductance is computed from the heater to all the heat sinks. (E to F) Computed temperature profiles at the top plane of the measuring and calibration platforms when the heater and chamber temperatures are set to Tinj = 120 mK and T0 = 100 mK, respectively.
Fig. 6.
Fig. 6.. Simulation of Schwab’s platform to measure thermal conductance of a nanowire.
(A) Top view of a simplified model of Schwab’s measuring platform. The heater injects energy perpendicular to the structure plane while the heat sinks draw energy parallel to that plane, like in Fig. 4A. The catenary-shaped structure is defined by Wc = 1 μm, Lc = 1 μm, Wn = 0.1 μm, and t = 0.1 μm, and the membrane is 1.1 μm by 1 μm. (B) Simulated measurements of thermal conductance of the catenary-shaped structure within the measuring platform (purple, yellow, and orange dots). The conductance of an infinitely long nanowire with a cross-section of 0.1 μm by 0.1 μm is given by the gray curve and that of the catenary-shaped structure with ideal heat baths, as shown in the inset, is given by the green curve. (C) Total phonon transmission for the infinitely long nanowire (gray curve), for the catenary-shaped structure with ideal heat baths (green curve), and for Schwab’s measuring platform. For the latter, transmission is computed from the heater to the heat sink on the left (red curve) and to that on the right (blue curve), as shown in the lower inset. (D) Computed temperature profile at the top plane of the measuring platforms when the heater and chamber temperatures are set to Tinj = 120 mK and T0 = 100 mK, respectively.
Fig. 7.
Fig. 7.. Non-Fourier features in the temperature profiles.
(A) Simulated temperature profile at the top plane of Tavakoli’s platform to measure thermal conductance of a nanowire. The system geometry equals that of Fig. 5A, but the heater and chamber temperatures are set to Tinj = 24 mK and T0 = 20 mK, respectively. The black arrow points to a local maximum temperature. (B) Average temperature of the measuring platform taken in the xy plane but not including the supporting beams (see dark gray region in the inset). The yellow and purple curves display local maximum temperatures at about −0.25 μm. (C) Average temperature of the measuring platform taken in the xy plane over the cross-section of 0.1 μm by 0.1 μm that overlaps with the nanowire (see darker gray region in the inset). The vertical line shows the right edge of the catenary-shaped structure, and the dashed lines are proportional to z−1.

References

    1. J. B. Pendry, Quantum limits to the flow of information and entropy. J. Phys. A. Math. Gen. 16, 2161–2171 (1983).
    1. J. P. Pekola, B. Karimi, Colloquium: Quantum heat transport in condensed matter systems. Rev. Mod. Phys. 93, 041001 (2021).
    1. S. Jezouin, F. D. Parmentier, A. Anthore, U. Gennser, A. Cavanna, Y. Jin, F. Pierre, Quantum limit of heat flow across a single electronic channel. Science 342, 601–604 (2013). - PubMed
    1. N. Mosso, U. Drechsler, F. Menges, P. Nirmalraj, S. Karg, H. Riel, B. Gotsmann, Heat transport through atomic contacts. Nat. Nanotechnol. 12, 430–433 (2017). - PubMed
    1. L. Cui, W. Jeong, S. Hur, M. Matt, J. C. Klöckner, F. Pauly, P. Nielaba, J. C. Cuevas, E. Meyhofer, P. Reddy, Quantized thermal transport in single-atom junctions. Science 355, 1192–1195 (2017). - PubMed