. 2023 Oct 13;9(41):eadg5109.
doi: 10.1126/sciadv.adg5109. Epub 2023 Oct 13.

Coinhibition of topoisomerase 1 and BRD4-mediated pause release selectively kills pancreatic cancer via readthrough transcription

Affiliations

Coinhibition of topoisomerase 1 and BRD4-mediated pause release selectively kills pancreatic cancer via readthrough transcription

Donald P Cameron et al. Sci Adv. .

Abstract

Pancreatic carcinoma lacks effective therapeutic strategies resulting in poor prognosis. Transcriptional dysregulation due to alterations in KRAS and MYC affects initiation, development, and survival of this tumor type. Using patient-derived xenografts of KRAS- and MYC-driven pancreatic carcinoma, we show that coinhibition of topoisomerase 1 (TOP1) and bromodomain-containing protein 4 (BRD4) synergistically induces tumor regression by targeting promoter pause release. Comparing the nascent transcriptome with the recruitment of elongation and termination factors, we found that coinhibition of TOP1 and BRD4 disrupts recruitment of transcription termination factors. Thus, RNA polymerases transcribe downstream of genes for hundreds of kilobases leading to readthrough transcription. This occurs during replication, perturbing replisome progression and inducing DNA damage. The synergistic effect of TOP1 + BRD4 inhibition is specific to cancer cells leaving normal cells unaffected, highlighting the tumor's vulnerability to transcriptional defects. This preclinical study provides a mechanistic understanding of the benefit of combining TOP1 and BRD4 inhibitors to treat pancreatic carcinomas addicted to oncogenic drivers of transcription and replication.


Figures

Fig. 1.
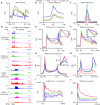
Fig. 1.. Combined drug treatment of topoisomerase 1 (TOP1) and bromodomain-containing protein 4 (BRD4) inhibitors shows synergy by killing pancreatic tumor cells both in vivo and in vitro.
(A) Scheme describing TOP1 regulation during pause release based on (14). BRD4 and TOP1 activities are required to overcome promoter-proximal pausing and enable efficient transcription elongation. (B) Primary responses observed upon 28 days of treatment (shaded area) for the pancreatic ductal adenocarcinoma (PDAC) patient-derived xenograft (PDX) model Bo103 treated with irinotecan (Irino) and JQ1 by intraperitoneal injection, alone or in combination in comparison to untreated controls. Growth curves are derived from mean values ± SEM (error bars). (C) Same as (B), but with the bromodomain-containing protein 4 (BRD4) inhibitor OTX015. Each asterisk represents a mouse that was taken out of the treatment cohort at the indicated time point because of health issues of the animal. The triangle indicates a mouse taken out of the experiment because one of the two tumors reached the maximum size criteria. Two mice with altogether four tumors were kept for follow-up beyond end of treatment on day 28 to assess tumor recurrency. (D) Representative immunohistochemistry images of Bo99 and Bo103 PDX tumor sections treated for 5 days with irinotecan and/or JQ1 stained for DNA [4′,6-diamidino-2-phenylindole (DAPI), blue], PanCK (gray), cleaved caspase 3 (green), and γH2AX (red). Scale bars, 100 μm. (E and F) Quantitation of nuclear γH2AX (E) and cellular cleaved caspase 3 (F) positivity from samples in (D) and fig. S1D. (G) Checkerboard assay of cultured Bo103 cells treated with SN38 and JQ1 in combination as indicated. The percentage of confluency after treatment is denoted by the numbers in the squares. Synergy determined using the delta Bliss model of additivity with more negative values showing stronger synergy (visualized by red/green color coding). Representative checkerboard of n = 3.
Fig. 2.
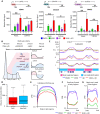
Fig. 2.. Transcription is synergistically inhibited by the combination treatment SN38 + JQ1.
(A) Topoisomerase 1 covalent adduct detection sequencing (TOP1 CAD-seq) profile at the 2500 most expressed genes between transcription start site (TSS) and transcription end site (TES) in Bo103 cells treated with dimethyl sulfoxide (DMSO), SN38, or SN38 + JQ1 for 1 hour. Data represented as count per million reads (CPM). Average of biological duplicates. (B) TOP1 occupancy at the TSS of the 2500 most expressed genes (±5 kb) in Bo103 cells after 1 hour of treatment. Average of biological duplicates. (C) Bromodomain-containing protein 4 (BRD4) occupancy at the TSS of the 10,000 most expressed genes (±5 kb) in Bo103 cells after 4 hours. Average of biological duplicates. (D) Genome Browser tracts of (SH)–linked alkylation for the metabolic sequencing of RNA (SLAM-seq) T > C conversion, nonexonic SLAM-seq, RNA polymerase II (RNAPII)–Ser2-P, and CSTF64 chromatin immunoprecipitation sequencing with spike-in control (ChIP-Rx-seq) reads along the gene body and downstream of the gene RPS12 for all treatment conditions after 4 hours. (E and F) SLAM-seq reads containing T > C conversions (E) and SLAM-seq nonexonic reads (F) from Bo103 cells plotted between TSS and TES of the 10% longest protein-coding genes after 4 hours of treatment. Inset shows the gradient of the linear regression between TSS and TES (SLAM and NERD indices, respectively; DMSO and JQ1 overlap, SN38 and SN38 + JQ1 overlap). Average of biological triplicates. *P < 0.05 for DMSO versus SN38 and DMSO versus SN38 + JQ1 comparisons, Student’s t test. (G) RNAPII–Ser2-P occupancy at the 10,000 most expressed genes in Bo103 cells after 4 hours of treatment. Inset shows the distribution of RNAPII–Ser2-P around TSS. Average of biological duplicates. (H) CSTF64 occupancy at the 10,000 most expressed genes in Bo103 cells after 4 hours of treatment. Average of biological duplicates. (I and J) SLAM-seq reads containing T > C conversions (I) and SLAM-seq nonexonic reads (J) from Bo103 cells plotted in the 100-kb downstream of the TES of protein-coding genes after 4 hours of treatment. Average of biological triplicates.
Fig. 3.
Fig. 3.. Readthrough transcription is associated with high levels of expression and RNA polymerase II (RNAPII) pausing.
(A) Comparison of expression level as reads per kilobase per million (RPKM) and gene length of detected genes producing downstream-of-gene (DoG) transcript after SN38 + JQ1 treatment and the generated list of non-DoGs. (B) Nonexonic (SH)–linked alkylation for the metabolic sequencing of RNA (SLAM-seq) reads plotted for the 100-kb region downstream of the transcription end site (TES) of DoG and non-DoG genes in untreated [dimethyl sulfoxide (DMSO)] or SN38 + JQ1–treated (4 hours) Bo103 cells. Average of biological triplicates. (C) CSTF64 occupancy around TES of DoG and non-DoG genes in Bo103 cells after 4 hours. Average of biological duplicates. (D) Boxplot showing RNAPII pausing index of DoG, non-DoG, and all expressed genes. Whiskers indicate lowest and highest values no further than 1.5× interquartile range. (E) Boxplot showing the distance from the TES of high-stringency DoGs and non-DoGs to the next expressed gene. Whiskers indicate lowest and highest values no further than 1.5× interquartile range; outliers are excluded. (F) H3K36me3 occupancy 10-kb downstream of the TES of DoG and non-DoG genes in Bo103 cells after 4 hours of treatment with DMSO or SN38 + JQ1. Average of biological duplicates.
Fig. 4.
Fig. 4.. Readthrough transcription induced by SN38 + JQ1 enhances firing of dormant origins by chromatin decompaction.
(A) Readthrough transcription persists in S phase upon treatment with SN38 + JQ1, as detected at selected region downstream of the downstream-of-gene (DoG) genes SERP1, SEC61B, and BPNT2 after 4 hours [n = 3, relative to dimethyl sulfoxide (DMSO) control; error bars represent SD]. *P < 0.05 and **P < 0.01, Student’s t test. (B) Scheme of Repli-seq. The approach allows for determination of early and late replicated regions in the genome. (C) Example Genome Browser tracks of replication timing (RT) (E/L), early (E), and late (L) replication upon Bo103 cell treatment with DMSO, SN38, JQ1, or SN38 + JQ1. Early (pink) and late (light blue) replicated regions are denoted by colored boxes underneath the tracks. Average of biological duplicates. (D) Boxplot showing the distance downstream from the transcription end site (TES) of DoGs and non-DoGs in early replicated regions to the next early-to-late border (P < 0.0005). Whiskers indicate lowest and highest values no further than 1.5× interquartile range; outliers are excluded. (E) H3K36me3 peaks in late replicated regions in Bo103 cells treated with DMSO, SN38, JQ1, or SN38 + JQ1 for 4 hours. Average of biological duplicates. (F) Repli-seq E read coverage at early replicated regions. Average of biological duplicates. (G) Repli-seq L read coverage at late replicated regions. Average of biological duplicates.
Fig. 5.
Fig. 5.. SN38 + JQ1 treatment induces readthrough transcription-dependent replication stress in S phase and cell stress signaling in G1 and G2 phases.
(A) Top: Schematic of treatment. Bottom: Immunofluorescence quantitation of γH2AX intensity in S phase (EdU-positive) upon dimethyl sulfoxide (DMSO), SN38, JQ1, or SN38 + JQ1 treatment ± 2 μM flavopiridol or 15 μM XL-413 for 6 hours. Mean represented by +, whiskers extend to 10 to 90%. a.u., arbitrary units. Representative plot of n = 3. ***P < 0.001, Student’s t test. n.s., not significant. (B) Flow cytometry analysis of EdU incorporation in S phase cells after DMSO, SN38, JQ1, or SN38 + JQ1 treatment ± 15 μM XL-413 after 6 hours. Whiskers extend to 10 to 90%. Representative plot of n = 3. (C) Top: Schematic of treatment. Bottom: Flow cytometry quantitation of p27-positive cells in G1 and G2 phases of the cell cycle upon DMSO, SN38, JQ1, or SN38 + JQ1 treatment ± 2 μM flavopiridol after 6 hours (n = 4; error bars represent SD). *P < 0.05 and ***P < 0.001, Student’s t test.
Fig. 6.
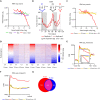
Fig. 6.. Irinotecan + JQ1 in patient-derived xenografts (PDXs) triggers readthrough transcription and does not show emergent resistance over time.
(A) Moving average of fold change (log2) derived from exonic RNA-seq reads of treated (irinotecan, JQ1, and irinotecan + JQ1) versus untreated Bo99 PDX plotted against the gene length (log2). Average of biological duplicates. (B) Top: Dosing and harvesting schedule. Bottom: Example growth curve of two Bo99 PDX tumors, subjected to 3 cycles of treatment with irinotecan + JQ1. (C) Same as (A), but Bo103 PDX was treated with irinotecan + JQ1 for 4, 12, and 24 hours and compared to untreated Bo103 PDX. Average of three to four tumors per condition. (D) Fold change (log2) of RNA-seq reads of Bo103 PDX for each time point versus untreated. (E) Nonexonic RNA-seq reads of Bo103 PDX plotted between the transcription start site (TSS) and transcription end site (TES) of the 10% longest protein-coding genes. Inset shows the gradient of the linear regression between TSS and TES (NERD index). Average of three to four tumors per condition. *P < 0.05, Student’s t test. (F) Nonexonic RNA-seq reads of Bo103 PDX plotted in the 20-kb region downstream of the TES of protein-coding genes. Average of three to four tumors per condition. (G) Venn diagram of genes producing downstream-of-gene (DoG) transcripts detected in cultured Bo103 cells and in the Bo103 PDX after 4 hours of SN38/irinotecan + JQ1 treatment.
Fig. 7.
Fig. 7.. Transcription is preferentially affected in Bo103 patient-derived xenografts (PDXs) upon irinotecan + JQ1 compared to normal mouse cells.
(A) Moving average of fold change (log2) of exonic RNA-seq reads from Bo103 PDX treated with irinotecan + JQ1 for 4 hours and normal mouse cells. Average of four tumors per condition. (B) Nonexonic RNA-seq reads from normal mouse cells plotted between the transcription start site (TSS) and transcription end site (TES) of the 10% longest protein-coding genes. Inset shows the gradient of the linear regression between TSS and TES (NERD index). Average of three to four tumors per condition. No significant difference between NERD indexes. (C) Nonexonic RNA-seq reads of PDX tumors and normal mouse cells from Bo103 PDXs treated for 4 hours with irinotecan + JQ1. Reads are plotted in the 100-kb region downstream of the TES of protein-coding genes. Data expressed as count per million (CPM) and normalized to the corresponding CPM values at 0 hours. Average of four tumors per condition. (D) Statistically significant (adjusted P < 0.05) differentially expressed (DE) up- and down-regulated genes in Bo103 PDX tumor and associated mouse normal cells upon irinotecan + JQ1 for 4 hours. (E) Gene set enrichment analysis (GSEA) for the gene ontology term apoptosis [normalized enrichment score = 1.50, false discovery rate (FDR) = 0.026] plotting gene enrichment after 4 hours irinotecan + JQ1 of Bo99 PDX tumor. (F) Relative expression of the core enriched apoptosis genes from (E) in Bo99 and Bo103 PDX tumors, both human cancer and mouse normal cells. (G) Working model. Under untreated conditions, transcription and replication are coordinated with replication initiating in open, highly transcribed regions. Upon SN38/irinotecan + JQ1 treatment, readthrough transcription affects the chromatin state and induces dormant origin firing in late replicated areas. This will interfere with the established replication timing (RT) pattern leading to replication stress, DNA damage, and cell cycle arrest.

References

    1. Sur I., Taipale J., The role of enhancers in cancer. Nat. Rev. Cancer 16, 483–493 (2016). - PubMed
    1. Bradner J. E., Hnisz D., Young R. A., Transcriptional addiction in cancer. Cell 168, 629–643 (2017). - PMC - PubMed
    1. Soucek L., Whitfield J., Martins C. P., Finch A. J., Murphy D. J., Sodir N. M., Karnezis A. N., Swigart L. B., Nasi S., Evan G. I., Modelling Myc inhibition as a cancer therapy. Nature 455, 679–683 (2008). - PMC - PubMed
    1. Guenther M. G., Lawton L. N., Rozovskaia T., Frampton G. M., Levine S. S., Volkert T. L., Croce C. M., Nakamura T., Canaani E., Young R. A., Aberrant chromatin at genes encoding stem cell regulators in human mixed-lineage leukemia. Gene Dev. 22, 3403–3408 (2008). - PMC - PubMed
    1. Taub R., Kirsch I., Morton C., Lenoir G., Swan D., Tronick S., Aaronson S., Leder P., Translocation of the c-myc gene into the immunoglobulin heavy chain locus in human Burkitt lymphoma and murine plasmacytoma cells. Proc. Natl. Acad. Sci. U.S.A. 79, 7837–7841 (1982). - PMC - PubMed

MeSH terms