. 2023 Oct 13;9(41):eadh1134.
doi: 10.1126/sciadv.adh1134. Epub 2023 Oct 13.

A noncanonical function of SKP1 regulates the switch between autophagy and unconventional secretion

Affiliations

A noncanonical function of SKP1 regulates the switch between autophagy and unconventional secretion

Jie Li et al. Sci Adv. .

Abstract

Intracellular degradation of proteins and organelles by the autophagy-lysosome system is essential for cellular quality control and energy homeostasis. Besides degradation, endolysosomal organelles can fuse with the plasma membrane and contribute to unconventional secretion. Here, we identify a function for mammalian SKP1 in endolysosomes that is independent of its established role as an essential component of the family of SCF/CRL1 ubiquitin ligases. We found that, under nutrient-poor conditions, SKP1 is phosphorylated on Thr131, allowing its interaction with V1 subunits of the vacuolar ATPase (V-ATPase). This event, in turn, promotes V-ATPase assembly to acidify late endosomes and enhance endolysosomal degradation. Under nutrient-rich conditions, SUMOylation of phosphorylated SKP1 allows its binding to and dephosphorylation by the PPM1B phosphatase. Dephosphorylated SKP1 interacts with SEC22B to promote unconventional secretion of the content of less acidified hybrid endosomal/autophagic compartments. Collectively, our study implicates SKP1 phosphorylation as a switch between autophagy and unconventional secretion in a manner dependent on cellular nutrient status.


Figures

Fig. 1.
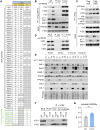
Fig. 1.. Binding of SUMOylated SKP1 to PPM1B decreases SKP1 phosphorylation on Thr131.
(A) Immunoblot of denaturing IP with a control immunoglobulin G (IgG) or an antibody against SUMO1 in HCT116 cells. Arrowheads, SUMO-SKP1 (black) and endogenous SKP1 (Endo. SKP1) (gray). (B) Immunoblot after IP with Flag tag from HEK293T cells transfected with Flag-SKP1, Myc-UBC9, SLX4, and hemagglutinin (HA)–tagged SUMO-1, SUMO-2, or SUMO-3. Control without transfection of SUMO plasmids is shown in the left lane. Whole-cell extract (WCE) controls are shown at the bottom. (C and D) Immunoblot for indicated proteins after denaturing IP from lysates of HEK293T cells expressing Flag-tagged SKP1WT, SKP1K142R, SKP1K163R, or SKP1K142R/K163R (SKP1RR). All cells expressed HA-SUMO1 and Myc-UBC9 plasmids with indicated amount of SLX4 plasmid. WCE controls are shown at the bottom (C). (E and F) Table of PSMs to SKP1 and PPM1B detected in the MS analysis (E) or immunoblot (F) for the proteins of Flag co-IP from HEK293T cells transfected with SUMOylation-enriching plasmids (HA-SUMO1, Myc-UBC9, and SLX4) and Flag-tagged SKP1WT or SKP1RR. Control co-IP without transfection of SUMOylation-enriching plasmids is shown in the left lane in (F). WCE controls are shown at the bottom (F). (G) Immunoblot for proteins of affinity precipitation with Strep tag from HEK293T cells transfected with SUMOylation-enriching plasmids (HA-SUMO1, Myc-UBC9, and SLX4), 2Strep-SKP1, and Flag-tagged SENP1 or SENP2. Control without transfection of SUMOylation-enriching plasmids is shown in the left lane. WCE controls are shown at the bottom. (H) Immunoblot in HeLa, HCT116, and RPE1 cells after treatment with a control siRNA (−) or siRNA against PPM1B (si-PPM1B) (+). (I) Immunoblot of SKP1WT and SKP1RR clones after treatment with a control siRNA (−) or si-PPM1B (+). Each experiment was performed a minimum of three times with similar results.
Fig. 2.
Fig. 2.. SKP1 phosphorylation on Thr131 promotes its interaction with the V-ATPase and V-ATPase assembly, independently of its binding to F-box proteins.
(A) Table of PSMs to proteins coimmunoprecipitated (co-IPed) from HEK293T cells transfected with SKP1WT, SKPT131A (phospho-mutant), and SKP1F139A/I41A (SKP1FI; F-box binding mutant) detected in the MS analysis. (B) Immunoblot of Flag co-IP from HEK293T cells transfected with Flag-tagged SKP1WT, SKP1T131A, and SKP1T131E (phospho-mimetic) after treatment without (−) or with (+) siRNA to PPM1B (si-PPM1B). WCE controls are shown at the bottom. (C) Immunoblot of proteins co-IPed from cells expressing Flag-tagged V0A or V0D1 after treatment with (+) or without (−) si-PPM1B. WCE controls are shown at the bottom. (D) Immunoblot of proteins co-IPed with endogenous V1B2 in cells treated without (−) or with (+) si-PPM1B. WCE controls are shown on the left, and IP with control rabbit IgG is in the middle lanes. (E) Immunoblot of proteins in homogenate (H), cytosol (C), lysosomes (Ly), or LE/MVBs isolated from cells expressing SKP1WT or SKP1T131A. (F) Immunoblot of proteins co-IPed with endogenous V1B2 in homogenate (Hom), cytosol (Cyt), or LE/MVBs isolated from cells expressing SKP1WT or SKP1T131A. WCE and co-IPs with control IgGs (IP-IgG) are shown on the left lanes. (G) Measurement of pH in LE/MVBs isolated from SKP1WT or SKP1T131A cells using the ratiometric LysoSensor Yellow/Blue DND-160 probe. n = 15 measurements from three independent experiments. Each experiment was performed a minimum of three times with similar results. Data are means ± SEM and individual values. Unpaired t test (G) was used. Differences were significant for **P < 0.01.
Fig. 3.
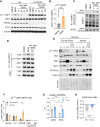
Fig. 3.. Nutrient deprivation induces SKP1 phosphorylation, enhancing LE/MVB acidification.
(A and B) Representative immunoblot (A) of HeLa cells treated with a control siRNA (NS) or si-PPM1B and incubated in complete DMEM or at indicated times after 1-hour incubation in EBSS and subsequent reintroduction of full DMEM (Min. after EBSS). Quantification of change in pT131-SKP1 levels upon 1-hour EBSS incubation is shown in (B). n = 6 independent experiments. (C and D) Immunoblot of proteins co-IPed with endogenous SUMO-1 in HeLa cells (C) or with Flag-tagged SKP1 in cells expressing this protein (D) maintained in complete DMEM or at indicated times after 1-hour incubation in EBSS and subsequent reintroduction of full DMEM (Min. after EBSS). (E and F) Representative immunoblot (E) of the indicated fractions isolated from livers of rats fed ad libitum (Fed) or starved for 24 hours (Starved). Homogenate (H), cytosol (C), LE/MVBs (LE), and lysosomes active for chaperone-mediated autophagy (Lys C) or macroautophagy (Lys M). Quantification (F) of pT131-SKP1 levels relative to total SKP1 levels in each fraction. n = 5 rats. (G and H) pH measured with ratiometric LysoSensor Yellow/Blue DND-160 probe in isolated LE/MVBs from SKP1WT or SKP1T131A cells maintained in DMEM or EBSS (G) and change (Δ) in pH in HeLa cells expressing SKP1WT or SKP1T131A upon incubation in EBSS for 1 hour (H). n = 5 or 15 independent experiments (G) or 7 independent experiments (H). Each experiment was performed a minimum of three times with similar results. Data are means ± SEM and individual values. Unpaired t test [(B) and (H)] and two-way ANOVA with Bonferroni’s multiple comparisons post hoc test [(F) and (G)] were used. Differences were significant for *P < 0.05, **P < 0.01, ****P < 0.0001. ns, not significant.
Fig. 4.
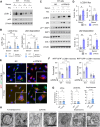
Fig. 4.. SKP1 phosphorylation enhances amphisome degradative capacity during starvation.
(A and B) Immunoblot (A) of SKP1WT or SKP1T131A HeLa cells grown in DMEM supplemented with (+) or without (−) serum for 8 hours. Where indicated, cells were treated with ammonium chloride and leupeptin (N/L) to inhibit endolysosomal proteolysis. Quantification (B) of LC3B-II flux (left) and p62 degradation (right). n = 6 independent experiments. (C and D) Immunoblot (C) of HeLa cells treated without (−) or with (+) si-PPM1B after incubation in DMEM supplemented with (+) or without (−) serum for 8 hours. Where indicated, cells were treated with N/L. Quantification (D) of LC3B-II flux (top) and p62 degradation (bottom). n = 3 to 6 independent experiments. (E and F) Macroautophagy activity in cells expressing SKP1WT and SKP1T131A transduced with the GFP-RFP-LC3B tandem fluorescent reporter and with si-PPM1B or a control (NS). Representative images (E) and quantification (F) of neutral pH LC3B+ compartments (GFP+; RFP+ puncta) (left) and LC3B+ acidic compartments (GFP; RFP+ puncta) (right). n > 250 cells for two cell lines each. Nuclei are highlighted with 4′,6-diamidino-2-phenylindole (DAPI). (G) Morphometric quantification from electron micrographs of the abundance of APGs, LE/MVBs, and amphisomes in HeLa cells expressing SKP1WT or SKP1T131A. Images were independently quantified by two experts blinded to the cell line genotype. n ≥ 20 fields per cell line, two cell lines each. (H) Representative electron micrographs of APGs, LE/MVBs, and amphisomes in SKP1T131A cells. Scale bar, 0.5 μm. Data are means ± SEM and individual values. Two-way ANOVA with Tukey’s multiple comparisons post hoc test [(B) and (F)] and unpaired t test [(D) and (G)] were used. Two-way ANOVA with Tukey’s multiple comparisons post hoc test for (D) is shown in the raw and statistic data file to show significant increase for both conditions upon serum removal. Differences were significant for *P < 0.05, **P < 0.01, ***P < 0.001, ****P < 0.0001.
Fig. 5.
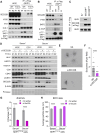
Fig. 5.. SKP1 dephosphorylation promotes exosome secretion.
(A) Immunoblot of cell culture medium subjected to differential ultracentrifugation to recover large ECVs (10,000g), small ECVs (100,000g), and precipitated free soluble protein (TCA). (B) Representative transmission electron micrographs of isolated ECVs. Scale bar, 200 nm. (C and D) Representative images from immune-EM with an antibody against CD63 (C) and quantification (D) of CD63+ vesicles in the small ECV fraction from SKP1WT and SKP1T131A HeLa cells. Scale bars, 200 μm; n = 60 images. (E) Immunoblot of WCE and ECVs from SKP1WT and SKP1T131A HeLa cells cultured in DMEM with (+) or without (−) serum for 16 hours. Ponceau shows different electrophoretic patterns. (F and G) Number of vesicles by NanoFCM analysis in ECV fractions isolated from culture medium of SKP1WT and SKP1T131A cells (F) or SKP1WT cells treated with control siRNA (Ctrl) or si-PPM1B in Serum+ or Serum conditions for 16 hours. (G). n = 3 independent experiments. (H) Immunoblot of WCE and ECVs from HeLa cells expressing SKP1WT and treated without (−) or with (+) si-PPM1B cultured in DMEM supplemented (+) or not (−) with serum for 16 hours. (I) Log2 fold change (Log2FC) in protein abundance between ECVs isolated from SKP1WT or SKP1T131A HeLa cells. Gray, nonsignificant proteins. Enriched GO terms are color-labeled, and representative proteins for each pathway are shown. Each experiment was performed a minimum of three times with similar results. Data are means ± SEM and individual values. Unpaired t test [(D) and (F)] or two-way ANOVA with Bonferroni’s multiple comparisons post hoc test (G) was used. Differences were significant for *P < 0.05, **P < 0.01, ****P < 0.0001.
Fig. 6.
Fig. 6.. SEC22B mediates SKP1-triggered protein secretion.
(A and B) Immunoblot of proteins from Flag co-IP in HeLa cells expressing Flag-tagged SKP1WT or SKP1T131A (A) or Expi293F cells transfected with Flag-tagged SKP1WT, SKP1T131A, or SKP1F139A/I141A (FI) (B). WCE controls are shown in the left lanes. Co-IPs in (A) and (B) were performed after treatment with the DSS cross-linking agent (1 mM) for 1 hour. (C) Immunoblot of proteins from Flag co-IP in HeLa cells expressing empty vector control (EV) or Flag-tagged wild-type (WT) SEC22B (SEC22BWT) or a form of SEC22B that cannot bind SKP1 (SEC22BK38A). (D) Immunoblot of WCE and ECVs obtained from the culture medium of HeLa cells expressing SKP1T131A after treatment with a control siRNA (−) or si-SEC22B (+), and cultured in DMEM supplemented (Serum+) or not (Serum) with serum for 16 hours. Ponceau shows different electrophoretic pattern of WCE and ECV fractions. (E and F) Representative images from immune-EM with an antibody against CD63 (E) and quantification (F) of CD63+ vesicles in the small ECV fraction from HeLa cells expressing SKP1T131A after treatment with a control siRNA (NS) or si-SEC22B. Scale bars, 200 μm; n = 60 images. (G and H) Number of secreted vesicles (G) and ECV size (H) based on NanoFCM analysis from ECVs isolated from culture medium of SKP1T131A cells treated with control siRNA (Ctrl) or si-SEC22B cultured in DMEM supplemented (+) or not (−) with serum for 16 hours. n = 3 independent experiments with >4000 vesicles per condition. Representative histograms are shown in fig. S9E. Each experiment was performed a minimum of three times with similar results. Data are means ± SEM and individual values. Unpaired t test (F) or two-way ANOVA with Bonferroni’s multiple comparisons post hoc test [(G) and (H)] was used. Difference was significant for ****P < 0.0001.
Fig. 7.
Fig. 7.. SKP1 phosphorylation regulates the starvation-induced switch between unconventional secretion and degradation by autophagy.
Proposed working model for the effect of SKP1 phosphorylation on the fate of autophagic cargo. (Top) Under nutrient-rich conditions, SUMOylation of SKP1 promotes its association with and dephosphorylation by PPM1B. Unphosphorylated SKP1 binds SEC22B on the LE/MVB membrane and promotes extracellular release of autophagic content delivered to these compartments upon LE/MVB fusion with APGs to form amphisomes. (Bottom) Upon nutrient deprivation, phosphorylation of SKP1 present in LE/MVBs promotes its binding to and assembly of V-ATPase subunits to increase LE/MVB acidification. The lower pH of amphisomes contributes to increased autophagic degradation under these conditions.

References

    1. S. Kaushik, A. M. Cuervo, Proteostasis and aging. Nat. Med. 21, 1406–1415 (2015). - PubMed
    1. B. Levine, Autophagy and cancer. Nature 446, 745–747 (2007). - PubMed
    1. A. Fleming, M. Bourdenx, M. Fujimaki, C. Karabiyik, G. J. Krause, A. Lopez, A. Martín-Segura, C. Puri, A. Scrivo, J. Skidmore, S. M. Son, E. Stamatakou, L. Wrobel, Y. Zhu, A. M. Cuervo, D. C. Rubinsztein, The different autophagy degradation pathways and neurodegeneration. Neuron 110, 935–966 (2022). - PMC - PubMed
    1. Q. Zheng, T. Huang, L. Zhang, Y. Zhou, H. Lu, H. Xu, X. Wang, Dysregulation of ubiquitin-proteasome system in neurodegenerative diseases. Front. Aging Neurosci. 8, 303 (2016). - PMC - PubMed
    1. M. D. Petroski, R. J. Deshaies, Function and regulation of cullin-RING ubiquitin ligases. Nat. Rev. Mol. Cell Biol. 6, 9–20 (2005). - PubMed

Substances