. 2023 Oct 13;9(41):eade3816.
doi: 10.1126/sciadv.ade3816. Epub 2023 Oct 13.

Acquired resistance to KRAS G12C small-molecule inhibitors via genetic/nongenetic mechanisms in lung cancer

Affiliations

Acquired resistance to KRAS G12C small-molecule inhibitors via genetic/nongenetic mechanisms in lung cancer

Atish Mohanty et al. Sci Adv. .

Abstract

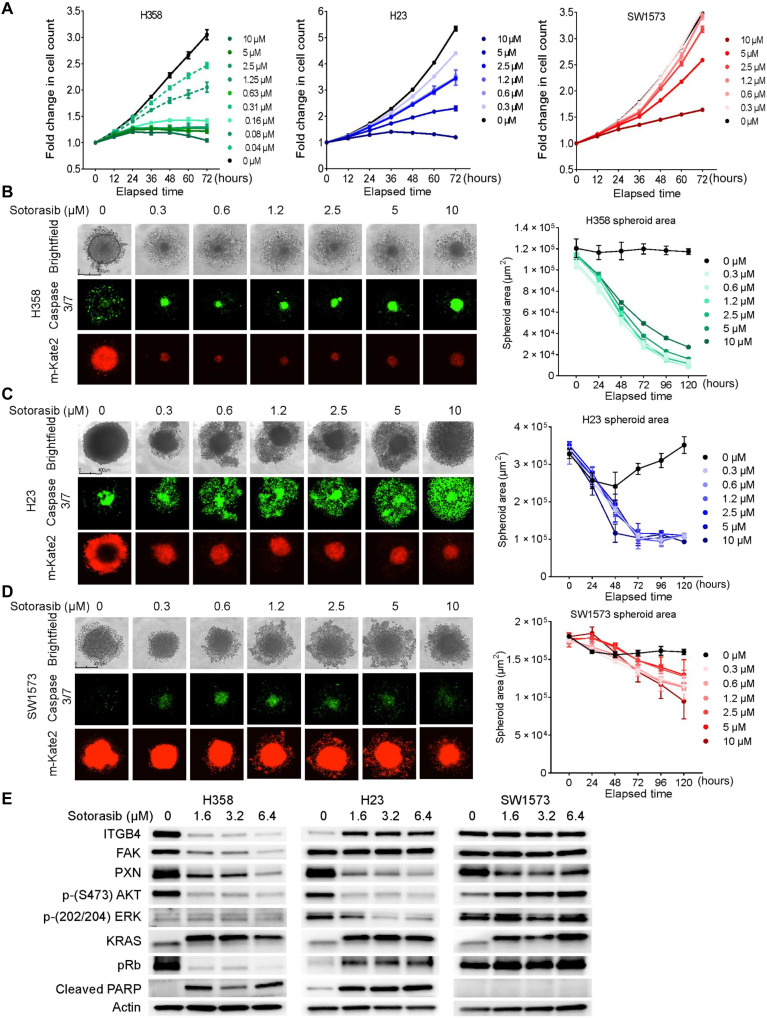
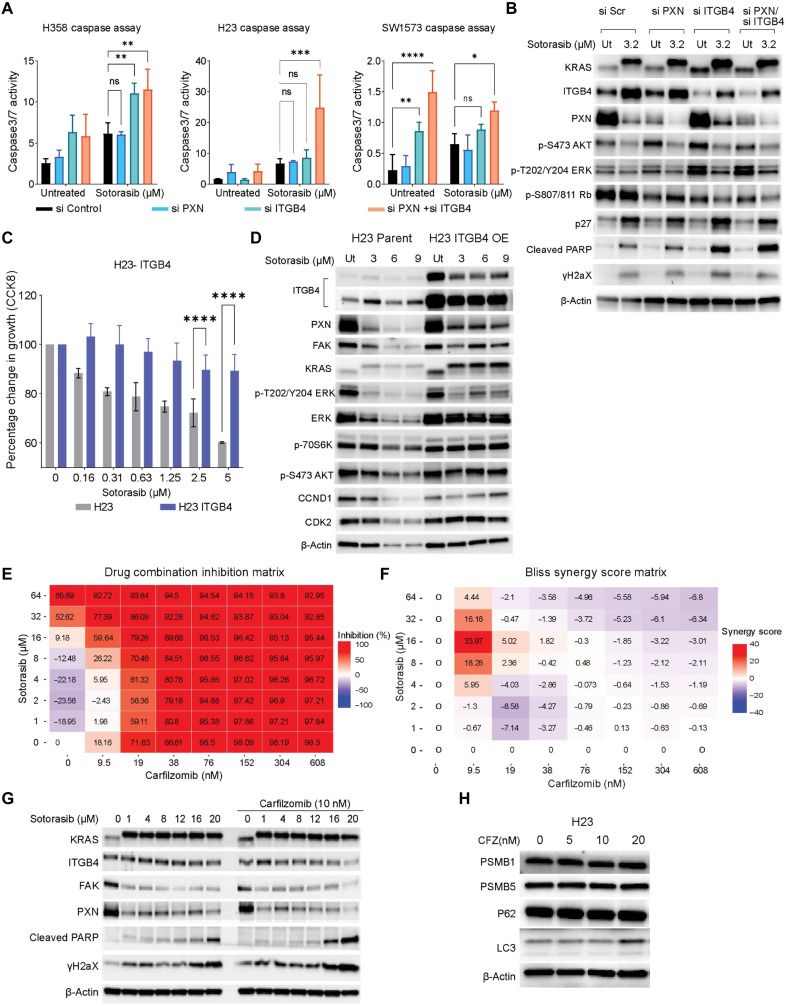
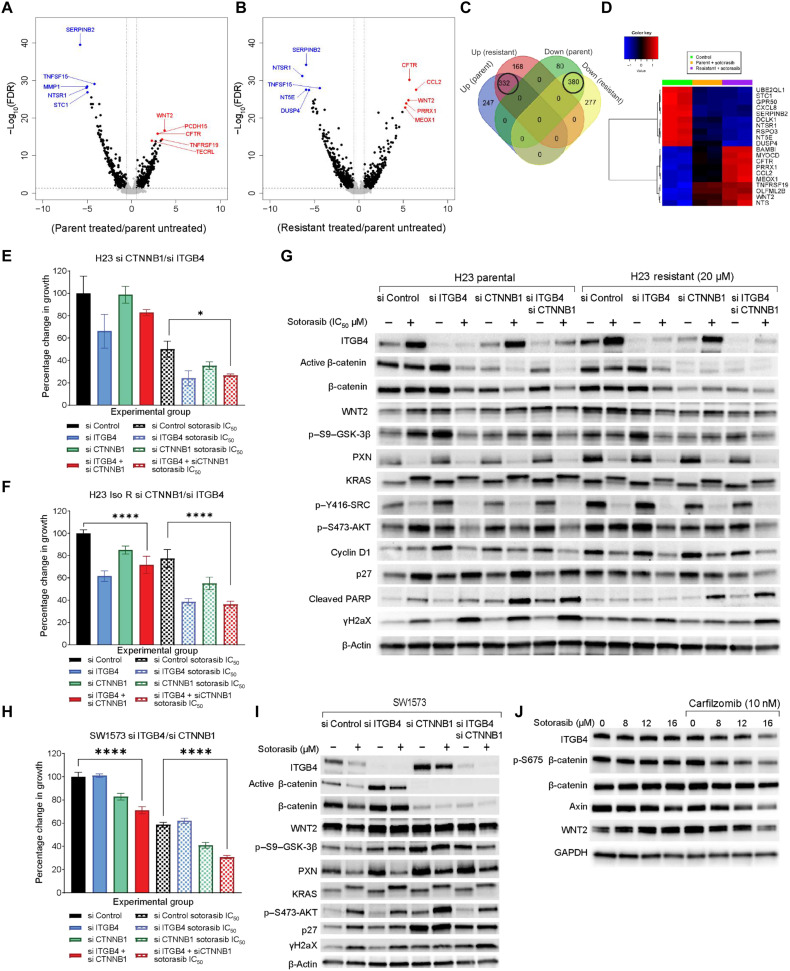
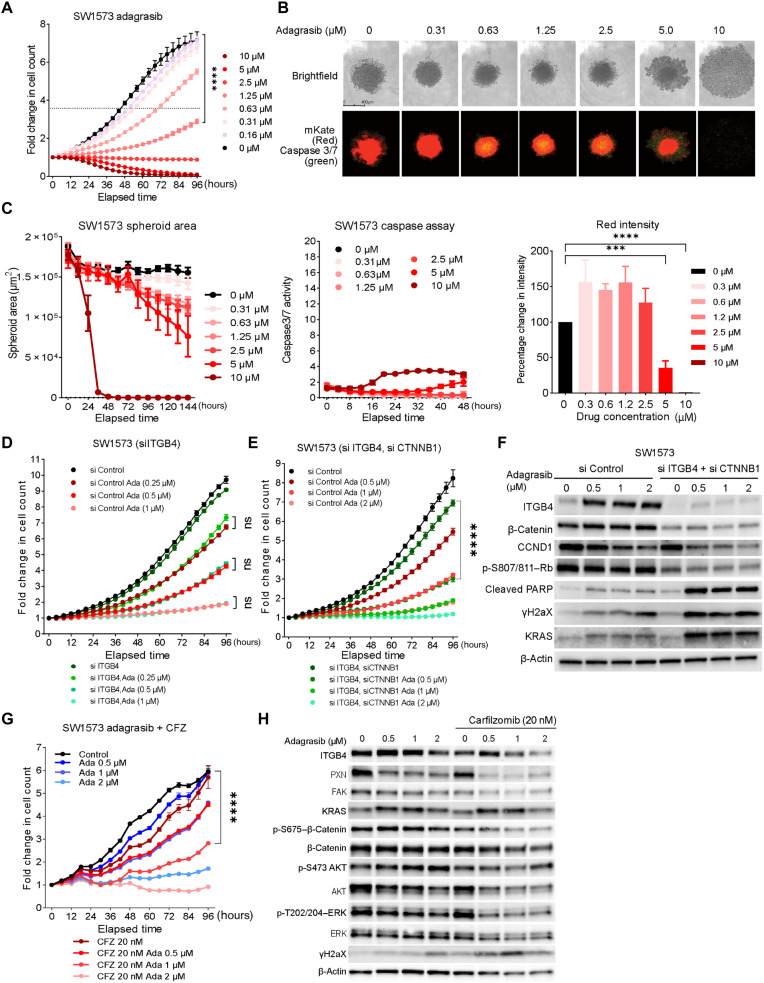
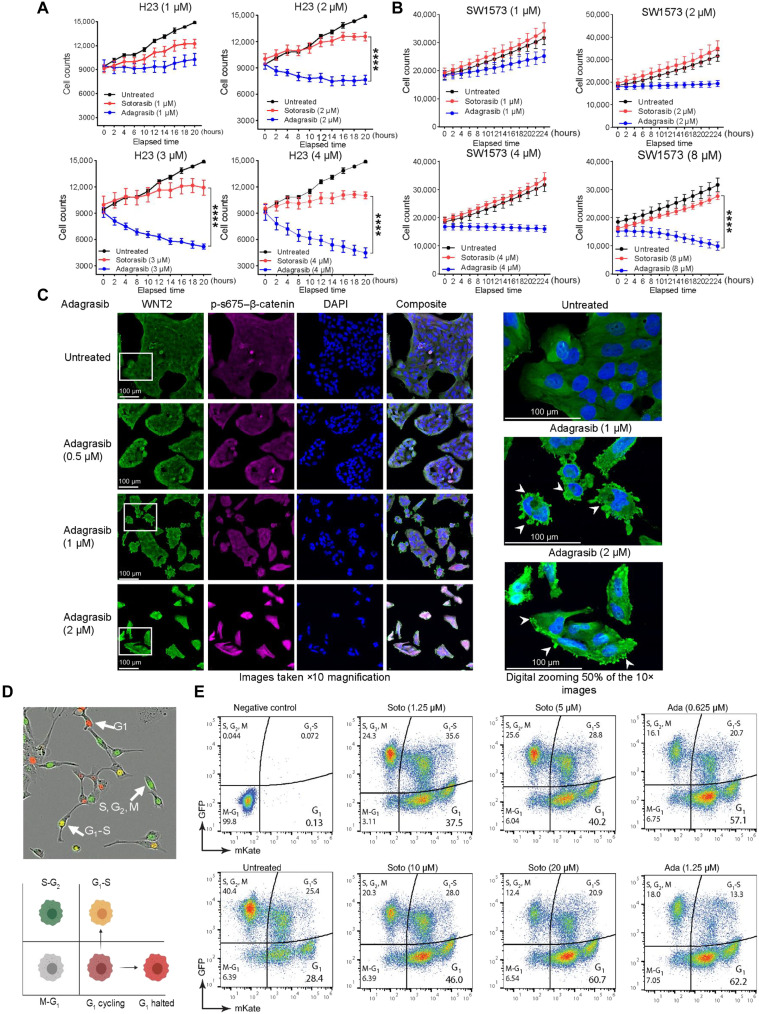
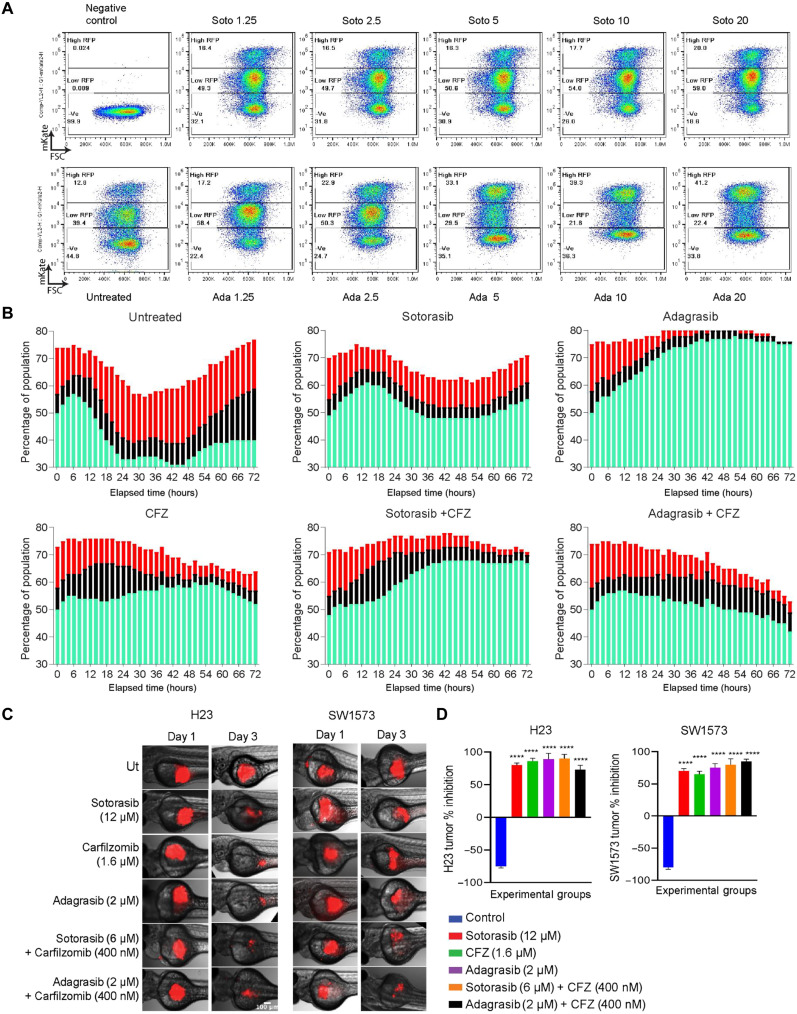
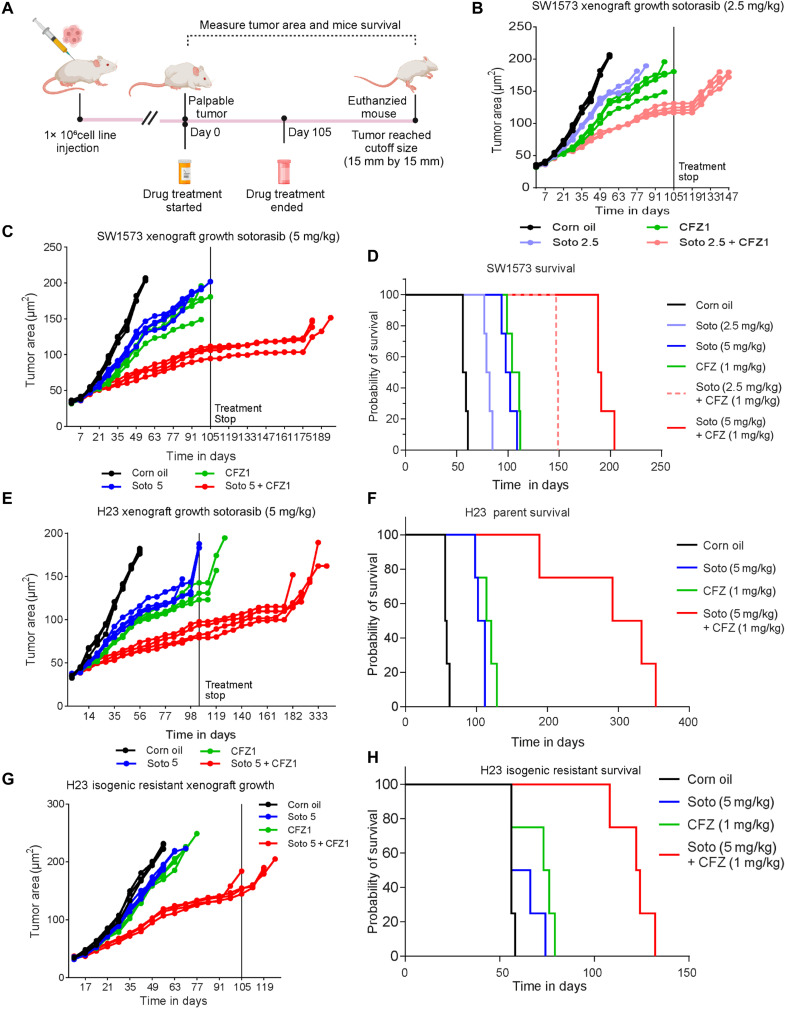
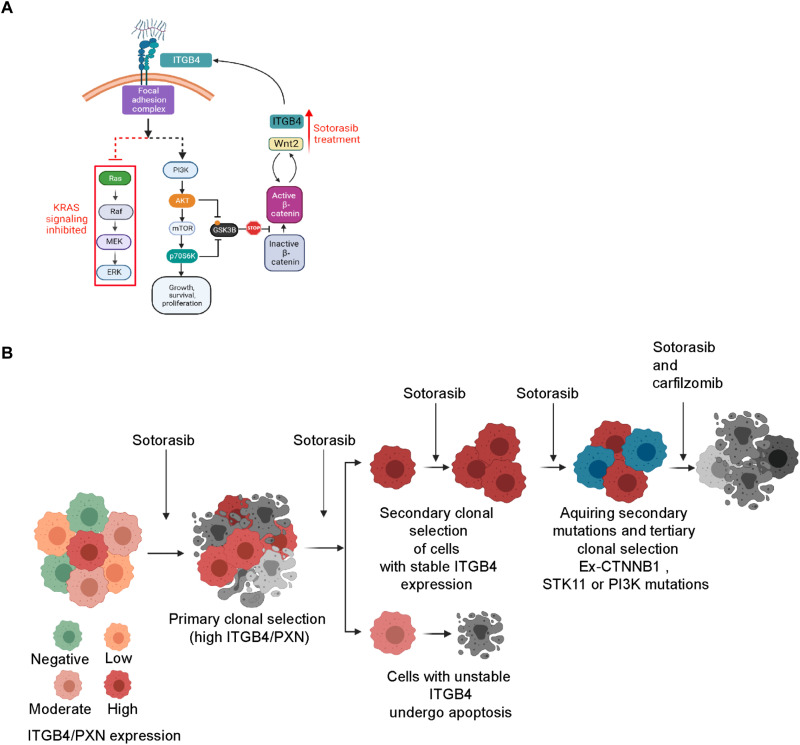
Inherent or acquired resistance to sotorasib poses a substantialt challenge for NSCLC treatment. Here, we demonstrate that acquired resistance to sotorasib in isogenic cells correlated with increased expression of integrin β4 (ITGB4), a component of the focal adhesion complex. Silencing ITGB4 in tolerant cells improved sotorasib sensitivity, while overexpressing ITGB4 enhanced tolerance to sotorasib by supporting AKT-mTOR bypass signaling. Chronic treatment with sotorasib induced WNT expression and activated the WNT/β-catenin signaling pathway. Thus, silencing both ITGB4 and β-catenin significantly improved sotorasib sensitivity in tolerant, acquired, and inherently resistant cells. In addition, the proteasome inhibitor carfilzomib (CFZ) exhibited synergism with sotorasib by down-regulating ITGB4 and β-catenin expression. Furthermore, adagrasib phenocopies the combination effect of sotorasib and CFZ by suppressing KRAS activity and inhibiting cell cycle progression in inherently resistant cells. Overall, our findings unveil previously unrecognized nongenetic mechanisms underlying resistance to sotorasib and propose a promising treatment strategy to overcome resistance.


Figures

Fig. 1.
Fig. 1.. NSCLC KRAS G12C cell lines respond to sotorasib at varying concentrations.
(A) NSCLC cell lines (H358, H23, and SW1573) with a KRAS G12C mutation were treated with an increasing concentration (0.3 to 10 μM) of sotorasib, and fold change in cell count was determined throughout 72 hours. Two-way ANOVA was used to calculate the statistical significance for each time point and for each drug concentration. n = 3 per group. (B) H358 cell line–derived spheroids were treated with an increasing concentration (0.3 to 10 μM) of sotorasib, and images were taken with the IncuCyte Live Cell Imaging System on day 5. Red fluorescence indicates cell viability, and green fluorescence indicates caspase 3/7 activity. The kinetics of the spheroid area was captured and plotted as graphs beside the images. Ordinary one-way analysis of variance (ANOVA) was used to calculate the statistical significance for each time point and each drug concentration. n = 4 per group. (C and D) Effect of increasing concentration of sotorasib on the H23- and SW1573-derived spheroids. Ordinary one-way ANOVA was used to calculate the statistical significance for each time point and for each drug concentration. n = 4 per group. (E) Immunoblot showing changes in the expression of KRAS and downstream signaling molecules upon sotorasib treatment (1.6, 3.2, and 6.4 μM).
Fig. 2.
Fig. 2.. Inhibition of the ITGB4/PXN axis with siRNA or CFZ sensitizes cells to sotorasib treatment.
(A and B) Effect of PXN and ITGB4 single knockdowns and double knockdown with sotorasib on caspase activity after 72 hours of drug treatment. Two-way ANOVA was used to calculate the statistical significance for each group (si Control, si PXN, si ITGB4, and si PXN + si ITGB4. n = 3 per group; ns, not significant; *P < 0.05, **P < 0.001, ***P = 0.0001, and ****P < 0.0001). (B) Immunoblot confirmed knockdown with ITGB4 and PXN siRNA, and effect of sotorasib on protein expression and signaling after 72 hours was determined. (C) H23 cells with ITGB4 overexpression (OE) were treated with an increasing concentration (0.3 to 5 μM) of sotorasib for 72 hours to determine the percentage change in cell growth. (D) H23 cells with ITGB4 overexpression were treated with an increasing concentration (3 to 9 μM) of sotorasib for 72 hours to determine the effect on protein expression and signaling with immunoblot. (E and F) SW1573 cells were treated with eight different concentrations of sotorasib and CFZ in the form of a matrix to determine the % inhibition of proliferation. Synergy scores were calculated and represented as a Bliss synergy matrix. (G) SW1573 cells were treated with an increasing concentration of sotorasib (1 to 20 μM) without or with the addition of CFZ (10 nM) for 72 hours to determine changes in protein expression and signaling by immunoblot. (H) Immunoblot showing changes in the component of proteasomal complex or autophagy-associated genes.
Fig. 3.
Fig. 3.. RNA sequencing reveals WNT2 up-regulation upon sotorasib treatment.
Volcano plot representing gene expression changes between (A) H23 parental cells, sotorasib treated versus untreated, and (B) isogenic resistant H23 cells compared to parental cells. Statistical significance was calculated for control verse treatment. n = 3 per group. (C) Number of overlapping and unique genes that were up-regulated or down-regulated with respect to treatment represented as a Venn diagram. (D) Heatmap representing top 10 overlapping up-regulated and down-regulated genes based on average fold change. (E and F) Effect of 3.2 μM sotorasib on H23 parental or isogenic resistant (Iso R) cells having knockdown of ITGB4 or CTNNB1 or both represented as percent change in growth at 96 hours (bar graph), respectively. Two-way ANOVA was used to calculate the statistical significance for each time point and for each condition (si Control, si ITGB4, si CTNNB1, si CTNNB1 + si ITGB4; n = 3 per group; ****P < 0.0001. (G) Immunoblot confirmed knockdown of ITGB4 and β-catenin in H23 parental cells and H23 sotorasib (20 μM) resistant cells. These cells were also treated with 3.2 μM sotorasib for 72 hours to identify changes in protein expression and signaling. (H) Representing the effect of ITGB4 and CTNNB1 single knockdown or double knockdown together with 10 μM sotorasib as a percent change in growth. Two-way ANOVA was used to calculate the statistical significance for each time point and each condition (si Control, si PXN, si ITGB4, and si PXN + si ITGB4; n = 3 per group; ****P < 0.0001. (I) Immunoblot showing knockdown of ITGB4 and β-catenin and changes in expression of active β-catenin, γH2AX, and p27 in SW1573 cells. (J) Immunoblot showing the reduction in the expression of WNT2, ITGB4, phospho, and total β-catenin in the SW1573 treated with sotorasib and CFZ drug combination.
Fig. 4.
Fig. 4.. Adagrasib is effective in inhibiting sotorasib-resistant NSCLC cells.
(A) Fold change in SW1573 cells growth with increasing concentration of adagrasib (0.6 to 10 μM). The dotted line represents a fold change in cell count, which corresponds to half of the total fold change shown by control cells. Statistical significance was calculated using two-way ANOVA for each time point and drug concentration. n = 3 per group; ****P < 0.0001. (B) IncuCyte images of SW1573 spheroids on day 5 of adagrasib (0.31 to 10 μM) treatment. (C) Changes in the spheroid area, caspase 3/7 activity, and red intensity. 10 μM adagrasib disintegrated the SW1573 spheroid and increased caspase 3/7 activity by threefold. Statistical significance was calculated using two-way ANOVA. n = 3 per group. (D) Live cell proliferation assay of ITGB4 siRNA-transfected SW1573 cells with and without adagrasib treatment for 96 hours. Two-way ANOVA was used to calculate the statistical significance (si Control or si ITGB4; n = 3 per group; ****P < 0.0001). (E) Effect of ITGB4/CTNNB1 double knockdown on SW1573 cells proliferation with and without adagrasib treatment for 96 hours (si Control, si ITGB4, Si CTNNB1, si CTNNB1 + si ITGB4; n = 3 per group; two-way ANOVA test, ****P < 0.0001). (F) ITGB4/CTNNB1double knockdown and adagrasib treatment induced expression of cleaved PARP, γH2AX expression, and inhibited Rb phosphorylation. (G) Inhibitory effect of adagrasib (0.5 to 2 μM) and CFZ (20 nM) on the SW1573 cell proliferation was additive. n = 3 per group. Two-way ANOVA test, ****P < 0.0001. (H) Immunoblot analysis of the signaling changes induced by adagrasib and CFZ combination. The combination treatment inhibited the expression of activated AKT, ERK, and β-catenin required for drug resistance.
Fig. 5.
Fig. 5.. KRAS G12C inhibitors have a differential effect on cell growth and progression.
(A) Effect of increasing concentrations (1 to 4 μM) of sotorasib and adagrasib exhibited different effects on cell proliferation over 24 hours in H23 cells. Two-way ANOVA was used for calculating statistical significance across various time points and for each drug concentration. n = 3. (B) Effect of KRAS inhibitors sotorasib or adagrasib increasing concentrations (1 to 8 μM) on SW1573 cells within 24 hours of drug treatment. Two-way ANOVA test was used to calculate the statistical significance. n = 3 sample per group. (C) Immunofluorescence image of SW1573 to support the dose dependent inhibitory effect of adagrasib on cell growth and expression of WNT2 (green) and phospsho-S675–β-catenin (magenta). The region of interest was zoomed 50% digitally to show membrane blebbing induced by adagrasib (white arrows). (D and E) Cell cycle dynamics were determined using IncuCyte Cell Cycle Lentivirus Reagent with fluorescence indicating cell cycle phase (brightfield image and schematic). Effect of increasing concentrations of sotorasib (1.25 to 20 μM) and adagrasib (0.6 to 1.25 μM) on cell cycle in SW1573 cells represented as pseudo color plots. The y axis of the plot represents events positive for GFP, and x axis represents the events positive for mKate2. mKate positive represents G1; GFP positive represents S, G2, and M; and double positive represents G1-S–transitioning cells.
Fig. 6.
Fig. 6.. KRAS G12C inhibitors have a differential effect on the cell cycle.
(A) Pseudo color plot representing the changes in the percentages of the G1 cell population with respect to drug treatment. The cells expressing low RFP (G1 cycling) and high RFP (G1 halted) are gated and analyzed for the increasing concentration of sotorasib (top row) and adagrasib (bottom row). The y axis of the plot represents events positive for mKate2, and x axis represents the forward scatter (FSC). (B) Cell cycle kinetics of the SW1573 cells was followed using the live cell imaging assay after drug treatment 10 μM sotorasib IC50 concentration, 10 μM adagrasib, 20 nM CFZ, sotorasib or adagrasib, and CFZ combination. Sotorasib and CFZ induced strong G1 arrest as done by adagrasib alone. The green bar represents G1 percent of the total population, the black bar represents S percent of the total population, and the red bar represents G2-M percent of the total population. (C) Red fluorescence dye–labeled H23 (left) and SW1573 (right) cells were xenotransplanted in zebrafish larvae, and images were taken after 3 days of 12 μM sotorasib, 2 μM adagrasib, 1.6 μM CFZ, 6 μM sotorasib + 0.4 μM CFZ, or 2 μM adagrasib + 0.4 μM CFZ treatment. (D) Percentage change in tumor growths was represented as bar graph against the experimental groups. The combination was effective at less concentration of the drugs. Statistical significance was calculated using one-way ANOVA. n = 10. ****P < 0.0001.
Fig. 7.
Fig. 7.. In vivo models confirm the sensitivity of cells to KRAS G12C inhibitors and CFZ combination treatment.
Mice xenografts were created using SW1573 cells to determine the antitumor effects of sotorasib, adagrasib, and CFZ and their combinations in vivo. (A) Schematic of in vivo study. (B and C) Changes in the tumor area changes (mm2) of xenografts with respect to sotorasib (2.5 or 5 mg/kg) or CFZ (1 mg/kg) single treatments and drug combination treatments [sotorasib (2.5 mg/kg) + CFZ (1 or 5 mg/kg) + CFZ (1 mg/kg)]. Statistical significance was calculated using one-way ANOVA. n = 5. ****P < 0.0001. (D) Survival probability of the mice harboring SW1573 cell line–derived xenografts. The combination treatment of sotorasib (2.5 mg/kg) + CFZ (1 or 5 mg/kg) + CFZ (1 mg/kg) has the highest median survival compared to single treatments. (E and F) Changes in the tumor area (mm2) of H23 cell line–derived xenografts with respect to sotorasib (5 mg/kg) or CFZ (1 mg/kg) single treatments or combination treatments [sotorasib (5 mg/kg) + CFZ (1 mg/kg)]. Survival probability of the mice harboring H23 cell line–derived xenografts. Statistical significance was calculated using one-way ANOVA. n = 5. ****P < 0.0001. (G and H). Changes in the tumor area (mm2) of H23 isogenic resistant cell line–derived xenografts and survival. The combination treatment of sotorasib (5 mg/kg) + CFZ (1 mg/kg) has the highest median survival compared to the single drug. Statistical significance was calculated using one-way ANOVA. n = 5. ****P < 0.0001.
Fig. 8.
Fig. 8.. Schematic representation of the signaling changes and evaluation of acquired resistance.
(A and B) A cartoon representation summarizing the cellular signaling involvement in sotorasib and the evolution of acquired resistant clones under continuous pressure. The cartoons were made using BioRender. PI3K, phosphatidylinositol 3-kinase. MEK, MAPK kinase.

References

    1. R. Salgia, Mutation testing for directing upfront targeted therapy and post-progression combination therapy strategies in lung adenocarcinoma. Expert Rev. Mol. Diagn. 16, 737–749 (2016). - PMC - PubMed
    1. R. S. Herbst, D. Morgensztern, C. Boshoff, The biology and management of non-small cell lung cancer. Nature 553, 446–454 (2018). - PubMed
    1. S. Dearden, J. Stevens, Y. L. Wu, D. Blowers, Mutation incidence and coincidence in non- small-cell lung cancer: Meta-analyses by ethnicity and histology (mutMap). Ann. Oncol. 24, 2371–2376 (2013). - PMC - PubMed
    1. H. Yang, S. Q. Liang, R. A. Schmid, R. W. Peng, New Horizons in KRAS-Mutant Lung Cancer: Dawn After Darkness. Front. Oncol. 9, 953 (2019). - PMC - PubMed
    1. S. Renaud, J. Seitlinger, P. E. Falcoz, M. Schaeffer, A. C. Voegeli, M. Legrain, M. Beau-Faller, G. Massard, Specific KRAS amino acid substitutions and EGFR mutations predict site-specific recurrence and metastasis following non-small-cell lung cancer surgery. Br. J. Cancer 115, 346–353 (2016). - PMC - PubMed

MeSH terms