. 2023 Nov 3;40(11):msad228.
doi: 10.1093/molbev/msad228.

Between but Not Within-Species Variation in the Distribution of Fitness Effects

Collaborators, Affiliations

Between but Not Within-Species Variation in the Distribution of Fitness Effects

Jennifer James et al. Mol Biol Evol. .

Abstract

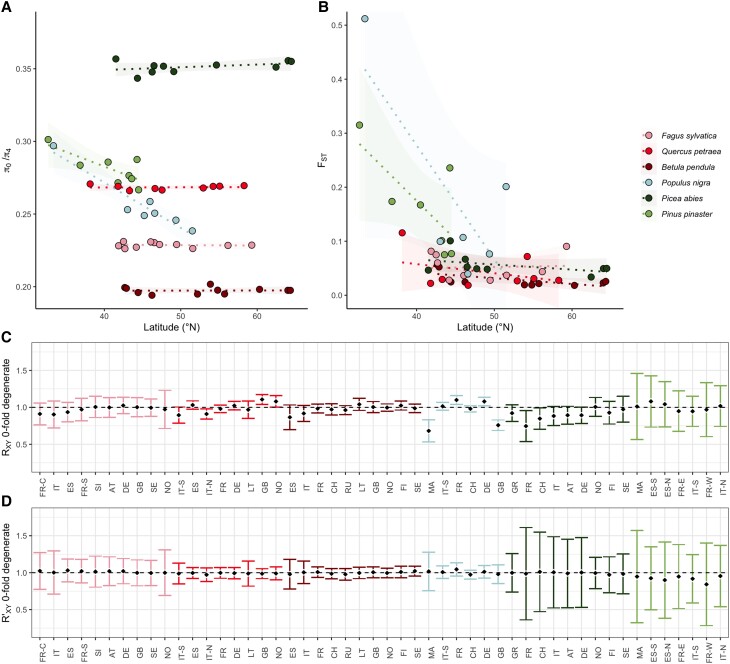
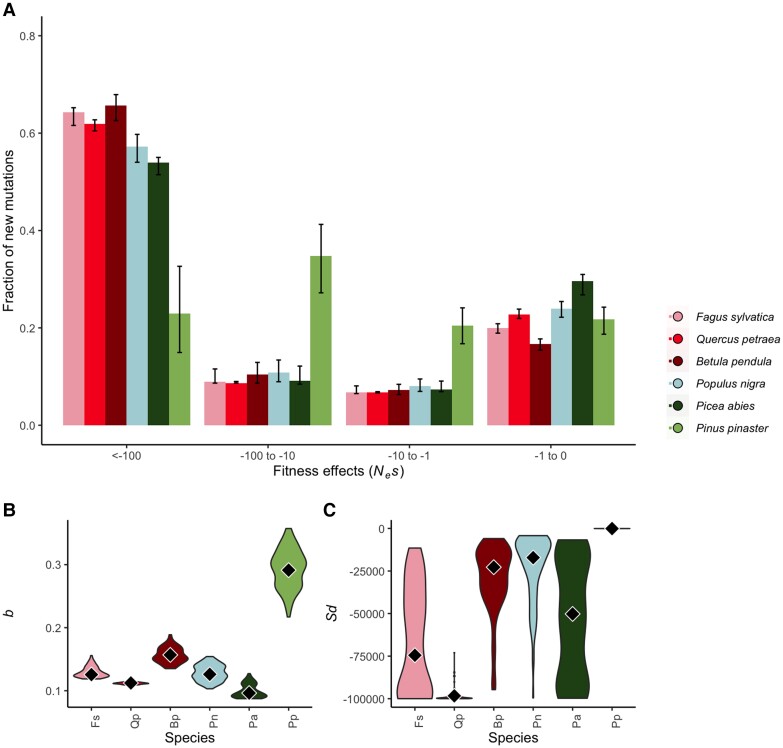
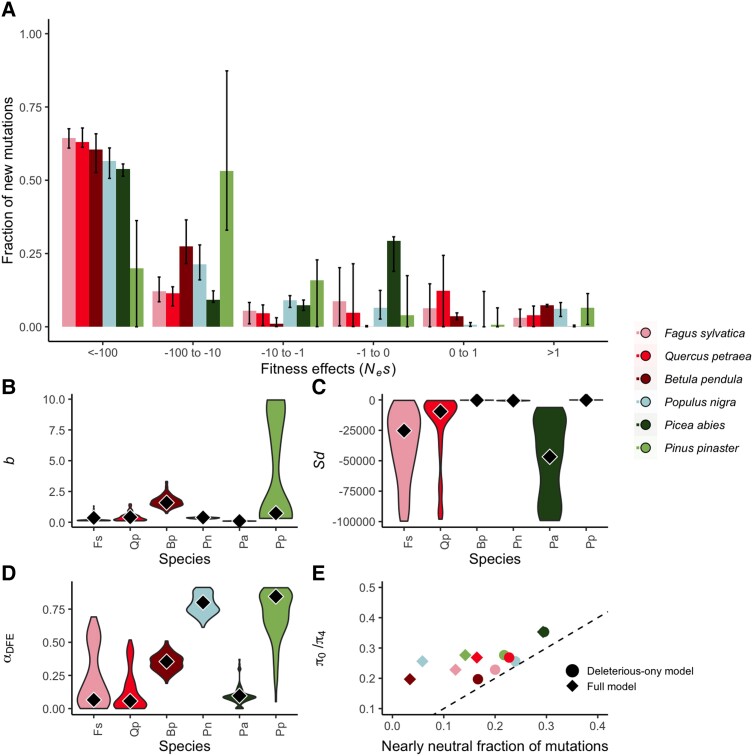
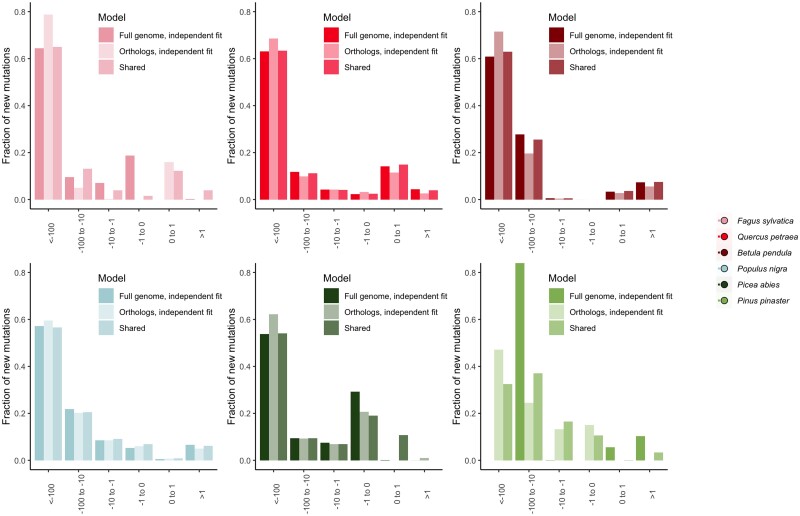
New mutations provide the raw material for evolution and adaptation. The distribution of fitness effects (DFE) describes the spectrum of effects of new mutations that can occur along a genome, and is, therefore, of vital interest in evolutionary biology. Recent work has uncovered striking similarities in the DFE between closely related species, prompting us to ask whether there is variation in the DFE among populations of the same species, or among species with different degrees of divergence, that is whether there is variation in the DFE at different levels of evolution. Using exome capture data from six tree species sampled across Europe we characterized the DFE for multiple species, and for each species, multiple populations, and investigated the factors potentially influencing the DFE, such as demography, population divergence, and genetic background. We find statistical support for the presence of variation in the DFE at the species level, even among relatively closely related species. However, we find very little difference at the population level, suggesting that differences in the DFE are primarily driven by deep features of species biology, and those evolutionarily recent events, such as demographic changes and local adaptation, have little impact.

Keywords: DFE; deleterious mutations; forest trees; population structure.


Figures

Fig. 1.
Fig. 1.
Levels of non-neutral diversity and mutation load are similar across populations within a species, despite different levels of population differentiation. The average π0/π4 per population for all species (A), and “focal” population pairwise FST (Wright's FST) for all species (B), using a “central” (see Methods) population per species as a reference, plotted against average sampling latitude for the focal population. Lines shown are linear regression slopes, along with their 95% confidence intervals. In (C), we plot Rxy for 0-fold degenerate, nonsynonymous sites, calculated per population, comparing focal populations (x) to a “central” (see Methods) reference population (y), while in (D), we plot Rxy for 0-fold degenerate, nonsynonymous sites, a measure which is normalized using putatively neutral 4-fold degenerate synonymous sites. In (C) and (D), black diamonds indicate the calculated values, while error bars are 95% confidence intervals on the estimate, calculated through jack-knifing. X axis labels are population codes, which begin with the two-letter country code of the sampling locations for each population, ordered by increasing latitude. The third letter provides additional location information for populations: C = Corsica, S = South, N = North, E = East, W = West (for exact sampling locations, see supplementary table S3, Supplementary Material online). Color codes for species, and species order, are consistent across all figure panels, with species ordered such that more closely related species are closer together.
Fig. 2.
Fig. 2.
Species differences in the deleterious-only DFE. (A) Shows the model-averaged discretized DFE, that is, the fraction of new mutations in each scaled fitness effect (Nes) category. Black bars indicate 95% confidence intervals on the estimated fraction, as estimated from model-averaged bootstrap replicates. (B) Violin plots of the shape parameter, b, and (C) Violin plots of the scale parameter Sd, for the gamma distribution of deleterious fitness effects per species. Black diamonds are the inferred model-averaged parameters, while violins show the 95% confidence intervals, as estimated from model-averaged bootstrap replicates.
Fig. 3.
Fig. 3.
Species differences in the full DFE. (A) Shows the model-averaged discretized DFE, that is, the fraction of new mutations in each scaled fitness effect (Nes) category. Black bars indicate 95% confidence intervals on the estimated fraction, as estimated from model-averaged bootstrap replicates. (B) Violin plots show the shape parameter, b, the scale parameter, (C) Sd, for the gamma distribution of deleterious fitness effects per species, (D) αDFE, the estimated fraction of substitutions inferred to be adaptive. Black diamonds are the inferred model-averaged parameters, while violins show the 95% confidence intervals, as estimated from model-averaged bootstrap replicates. In (E), we show the fraction of slightly deleterious (−1 < Nes < 0) mutations plotted against the ratio of 0- to 4-fold degenerate nucleotide diversity. Circles represent the fraction as inferred from the deleterious-only DFE model, diamonds represent the fraction as inferred from the full (advantageous and deleterious) DFE model. The dashed line indicates x = y. For P. abies, the diamond and circle overlap.
Fig. 4.
Fig. 4.
Discretized DFEs for each species, showing model comparisons for different categories of genes. Darkest bars show the independent fit for all genes, lightest bars show the independent fit for orthologs found in all species, intermediate bar shows the fit if the parameters are inferred to be shared across the all-species orthologs and the full dataset. We show model fits for the full DFE, including an estimate of the rate of ancestral allele misidentification, ɛanc, for all species.
Fig. 5.
Fig. 5.
DFE parameters are consistent across populations within a species for the full DFE. Shown are the model-averaged inferred parameters. We plot the shape (A) and scale (B) parameter of the gamma deleterious distribution of fitness effects, (C) αDFE, the proportion of substitutions that are expected to be adaptive, (D) the proportion of mutations inferred to be effectively neutral, that is, the fraction of mutations for which −1 < Nes < 1. Boxplots show the distribution of values per species, with outlier points indicated as black dots, and labeled by their population codes. Population codes always start with two letter country codes, S = South. For exact sampling locations, see supplementary table S3, Supplementary Material online.

References

    1. Agrawal AF, Whitlock MC. Environmental duress and epistasis: how does stress affect the strength of selection on new mutations? Trends Ecol Evol (Amst). 2010:25(8):450–458. 10.1016/j.tree.2010.05.003. - DOI - PubMed
    1. Bataillon T, Bailey SF. Effects of new mutations on fitness: insights from models and data. Ann N Y Acad Sci. 2014:1320(1):76–92. 10.1111/nyas.12460. - DOI - PMC - PubMed
    1. Bolívar P, Mugal CF, Rossi M, Nater A, Wang M, Dutoit L, Ellegren H. Biased inference of selection due to GC-biased gene conversion and the rate of protein evolution in flycatchers when accounting for it. Mol Biol Evol. 2018:35(10):2475–2486. 10.1093/molbev/msy149. - DOI - PMC - PubMed
    1. Booker TR. Inferring parameters of the distribution of fitness effects of new mutations when beneficial mutations are strongly advantageous and rare. G3 Genes|Genomes|Genetics. 2020:10(7):2317–2326. 10.1534/g3.120.401052. - DOI - PMC - PubMed
    1. Castellano D, Eyre-Walker A, Munch K. Impact of mutation rate and selection at linked sites on DNA variation across the genomes of humans and other homininae. Genome Biol Evol. 2020:12(1):3550–3561. 10.1093/gbe/evz215. - DOI - PMC - PubMed