. 2023 Oct 23;58(20):2048-2062.e7.
doi: 10.1016/j.devcel.2023.09.001. Epub 2023 Oct 12.

Adhesion-based capture stabilizes nascent microvilli at epithelial cell junctions

Affiliations

Adhesion-based capture stabilizes nascent microvilli at epithelial cell junctions

Caroline S Cencer et al. Dev Cell. .

Abstract

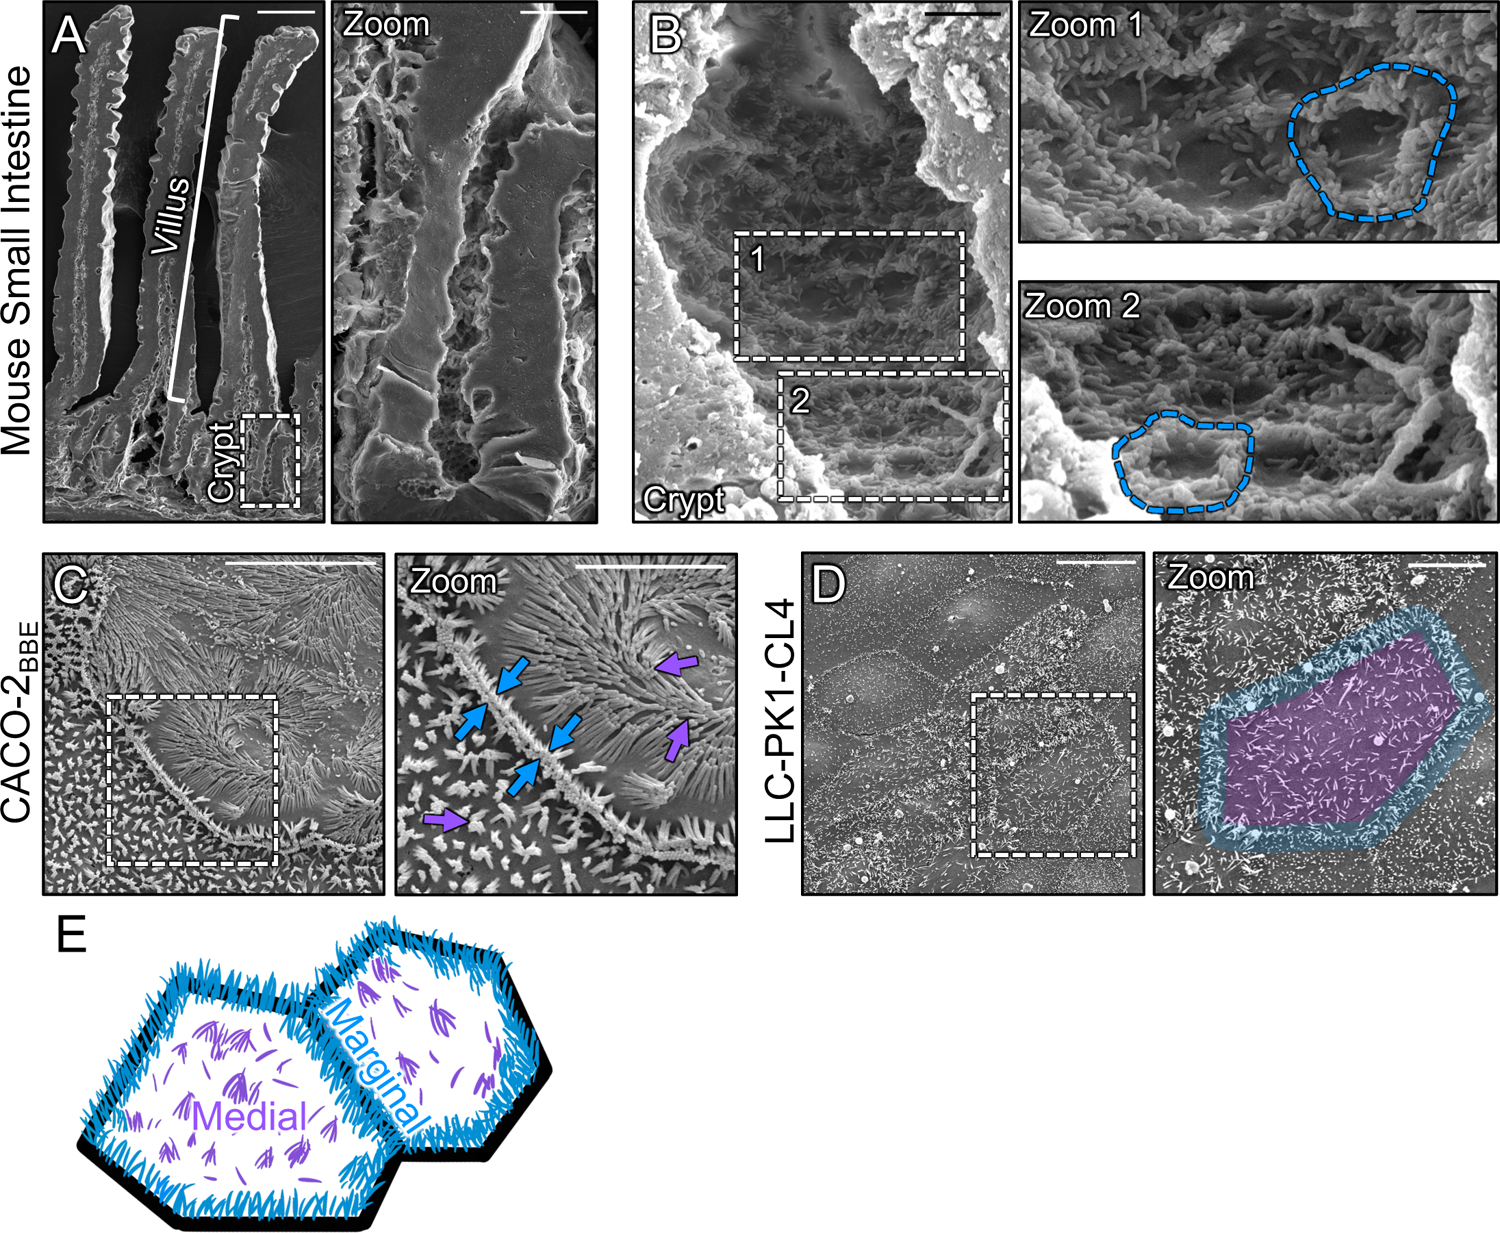
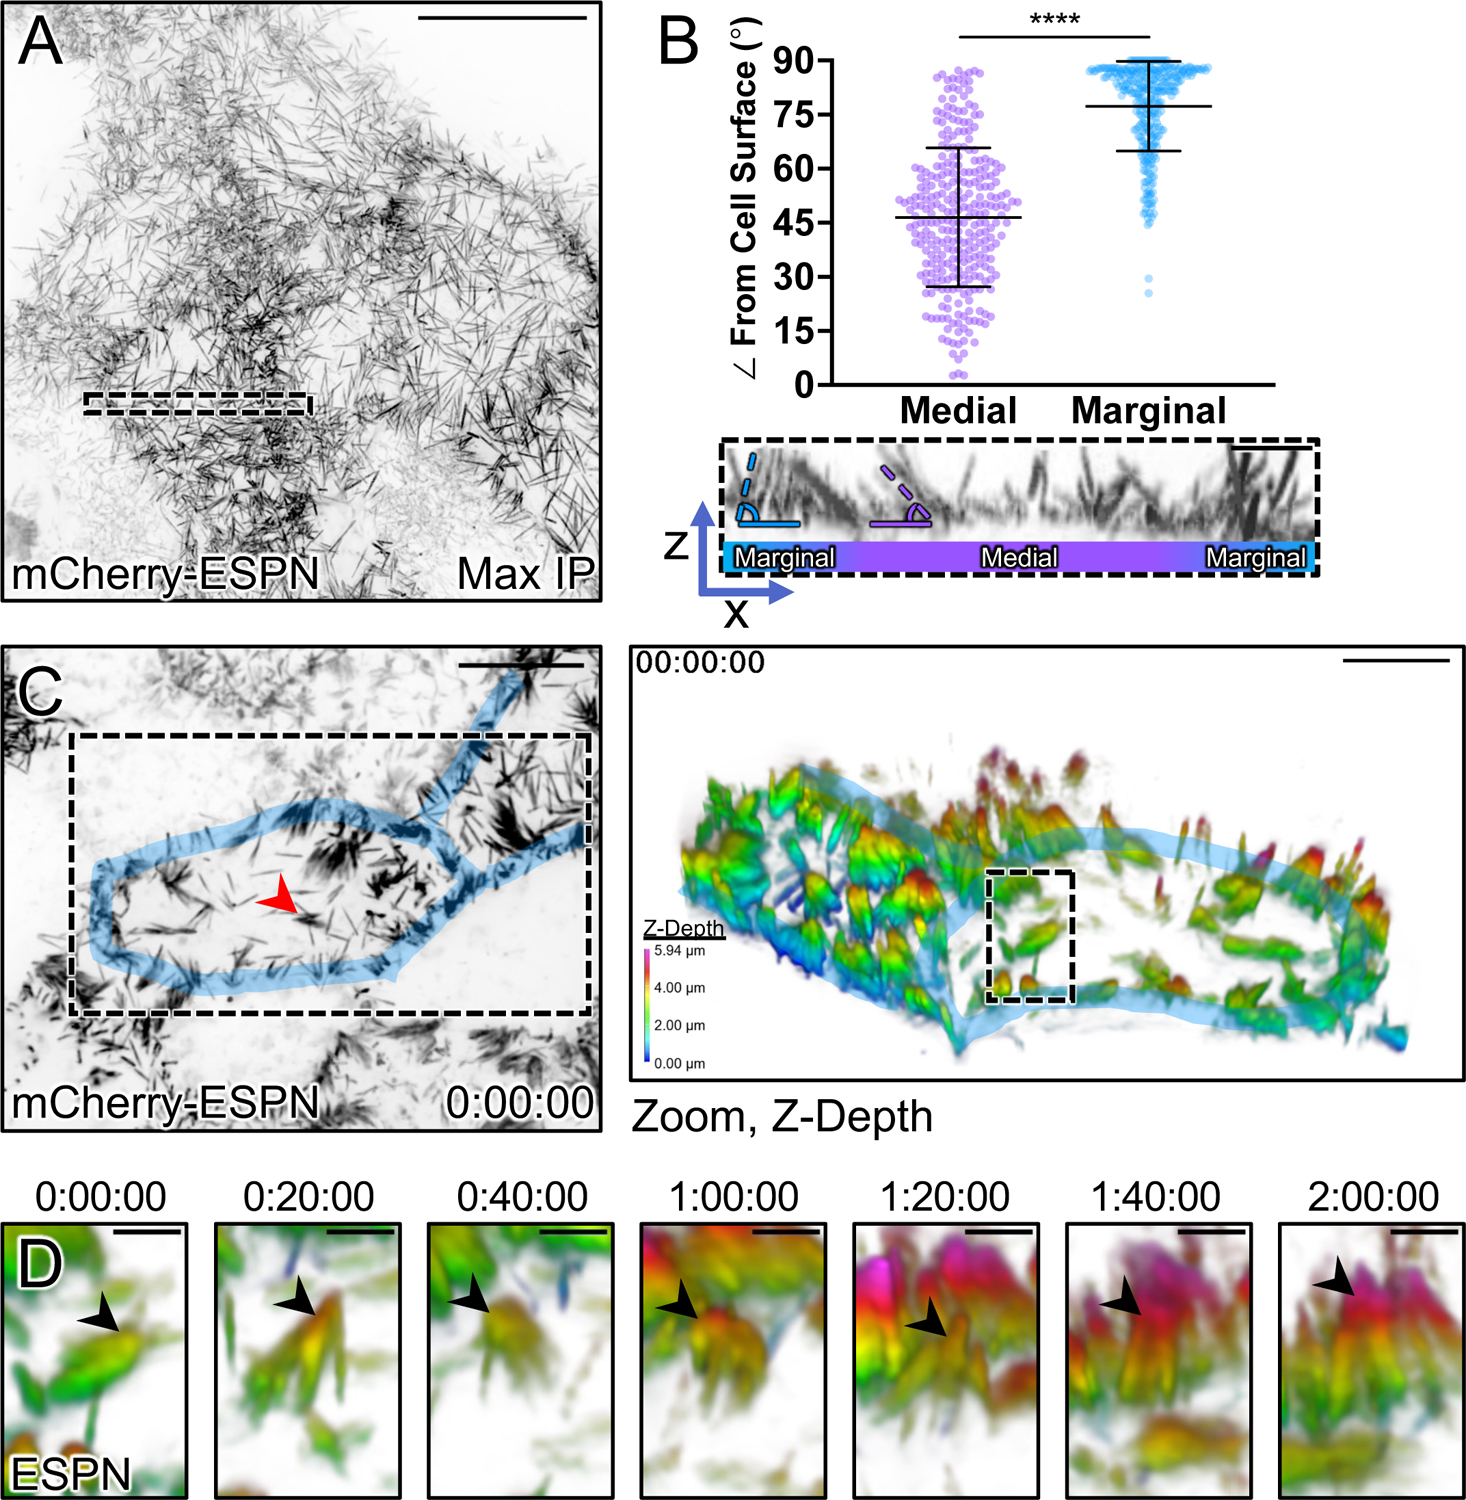
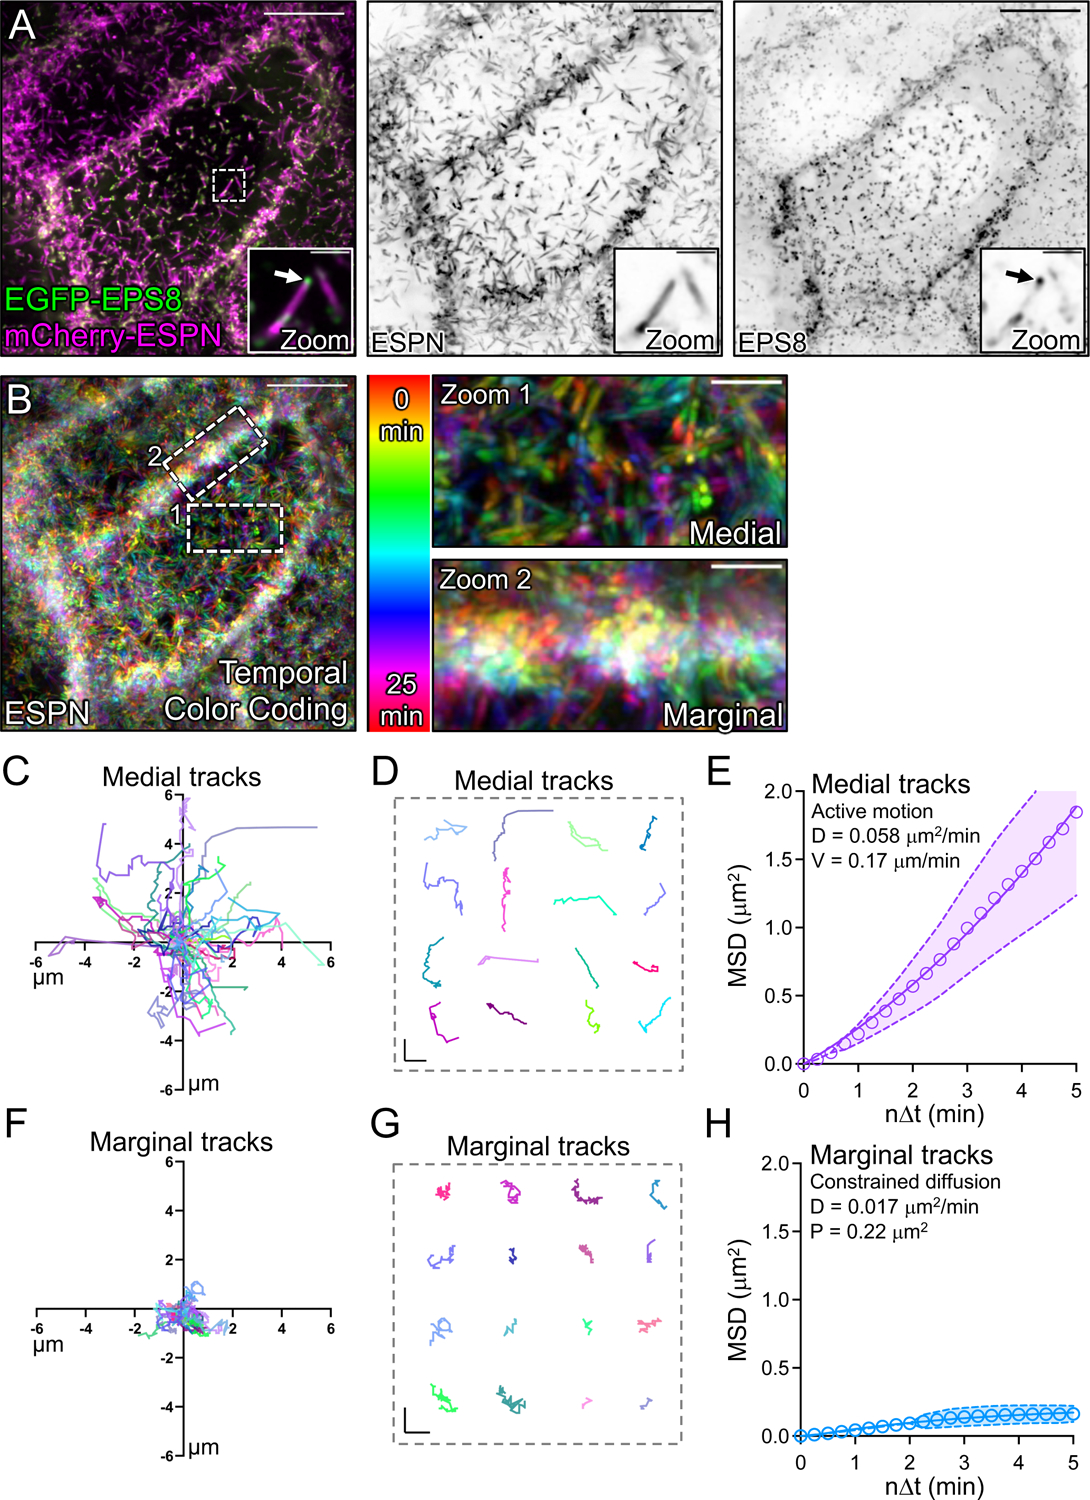
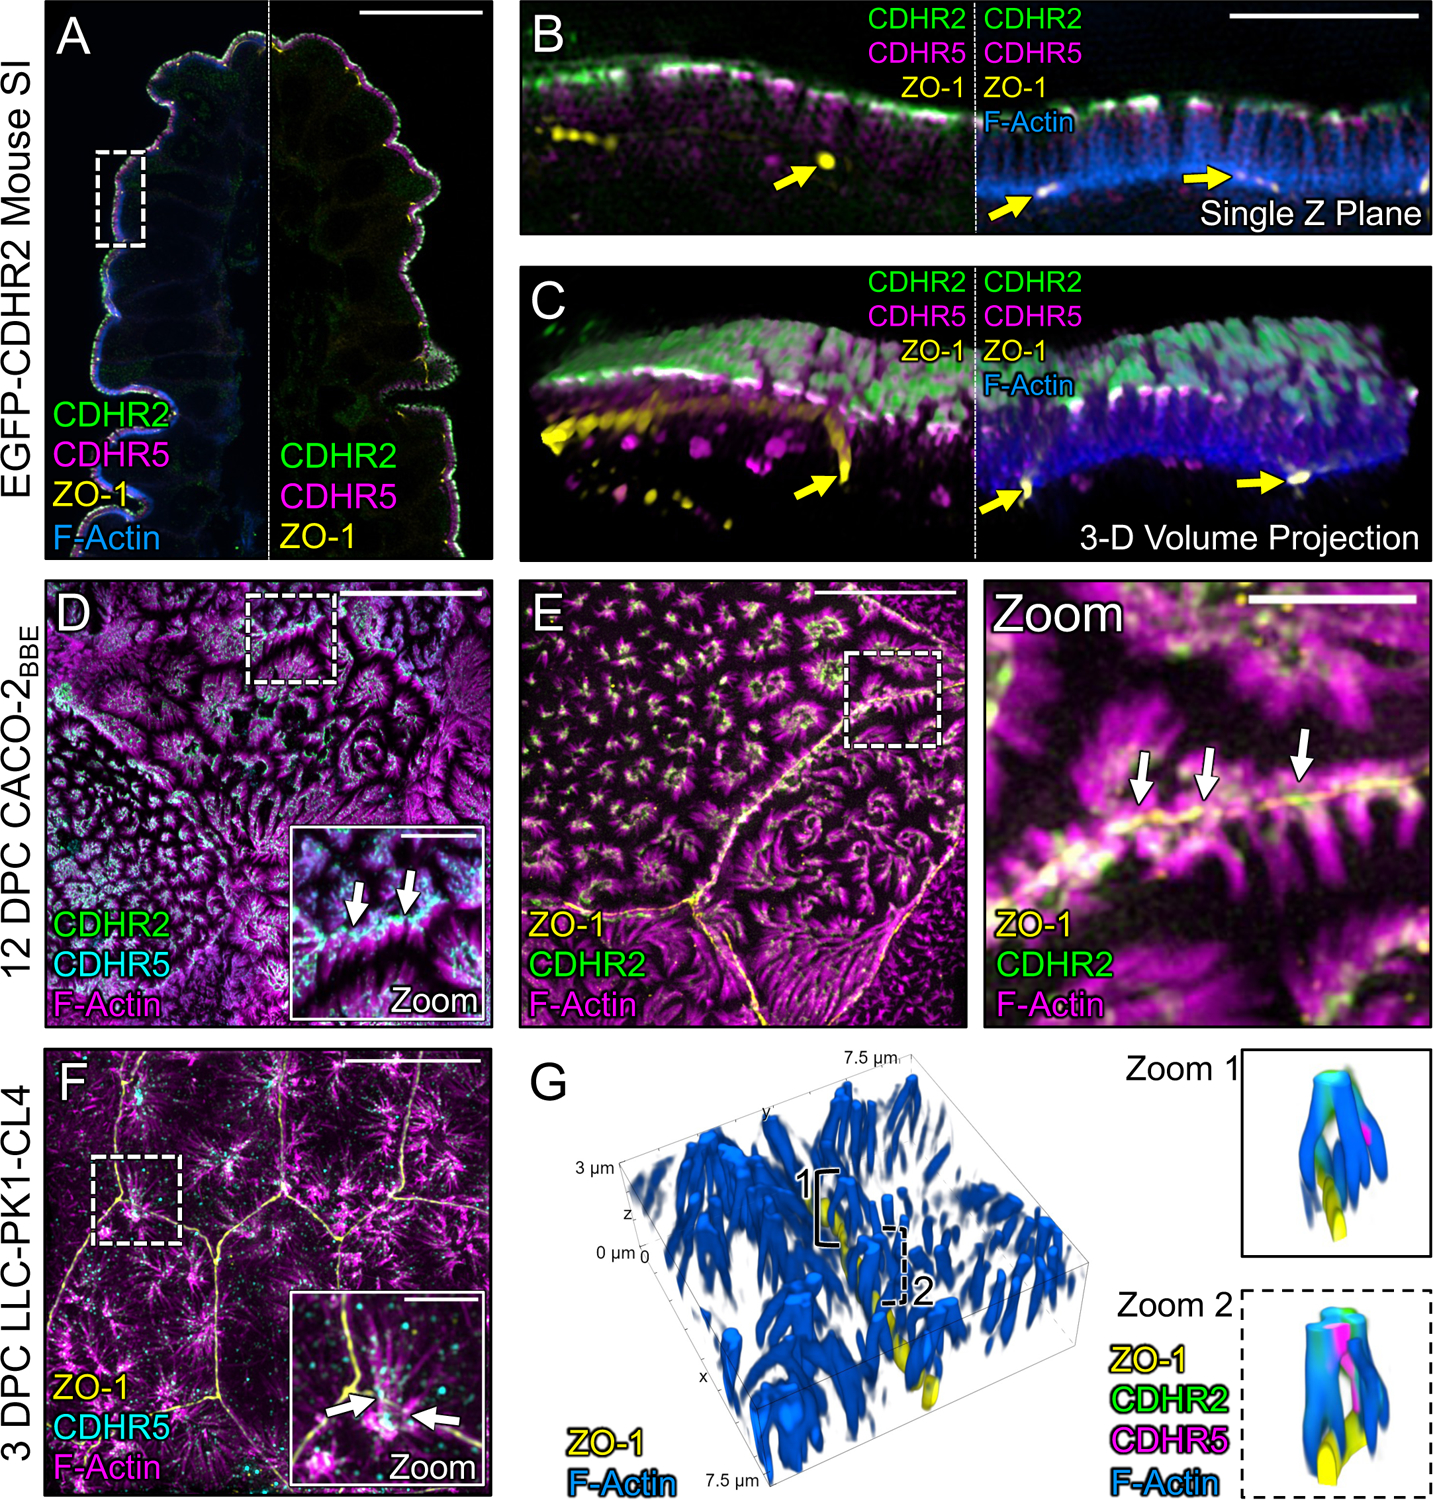
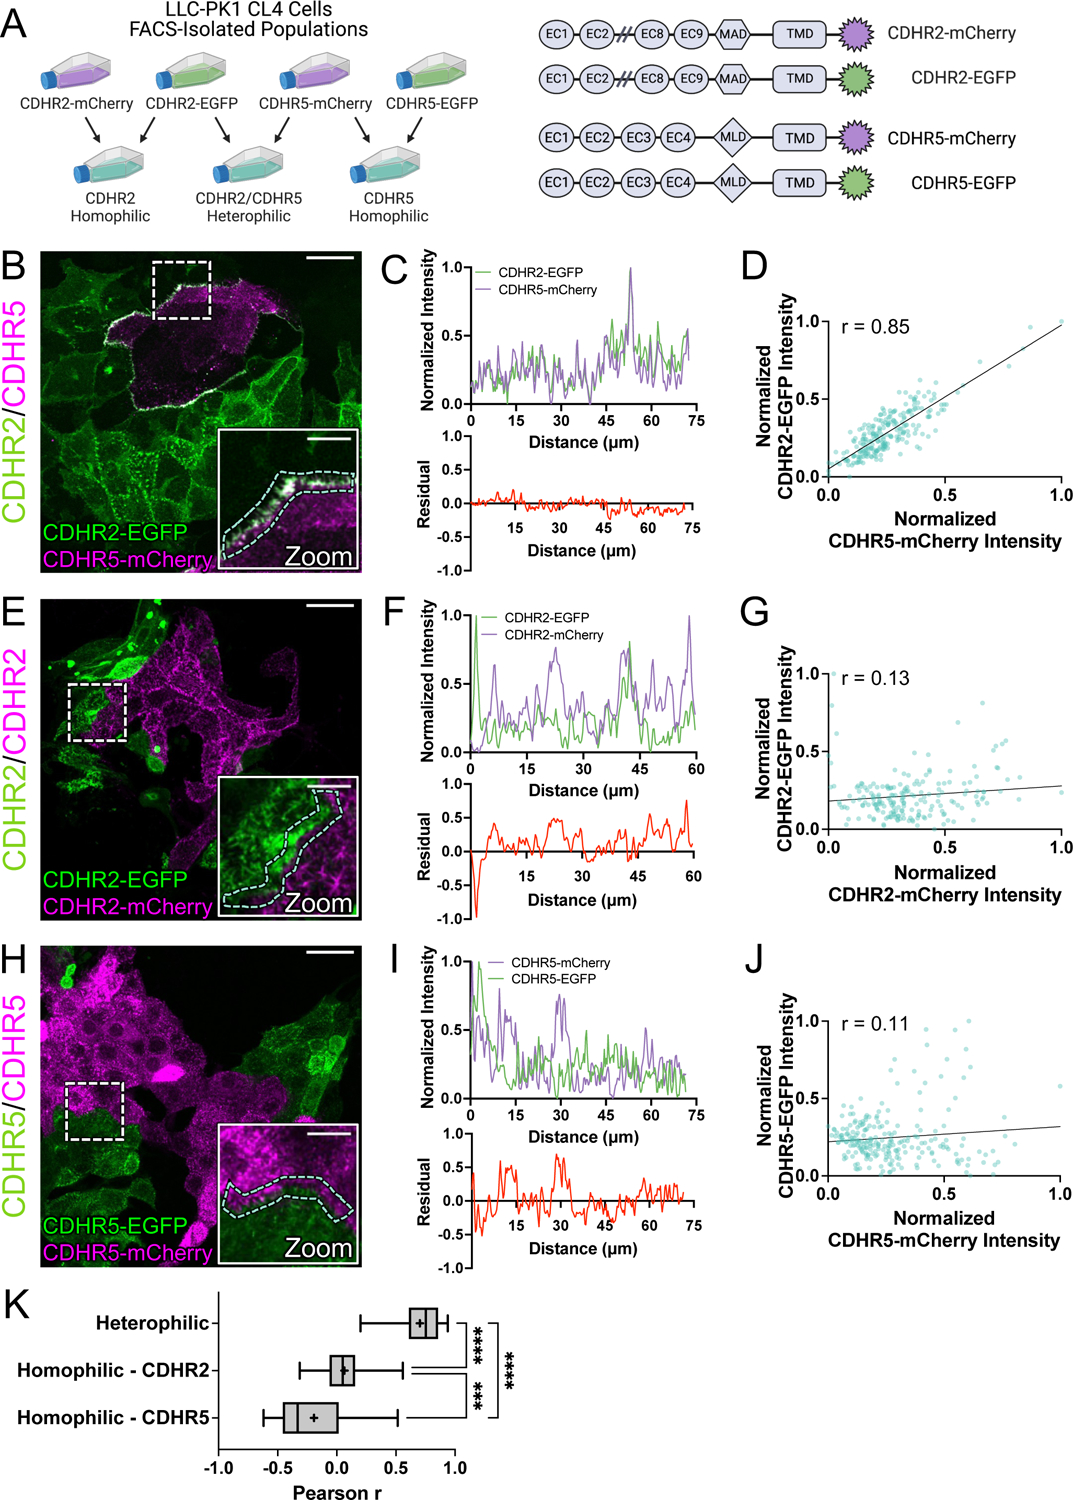
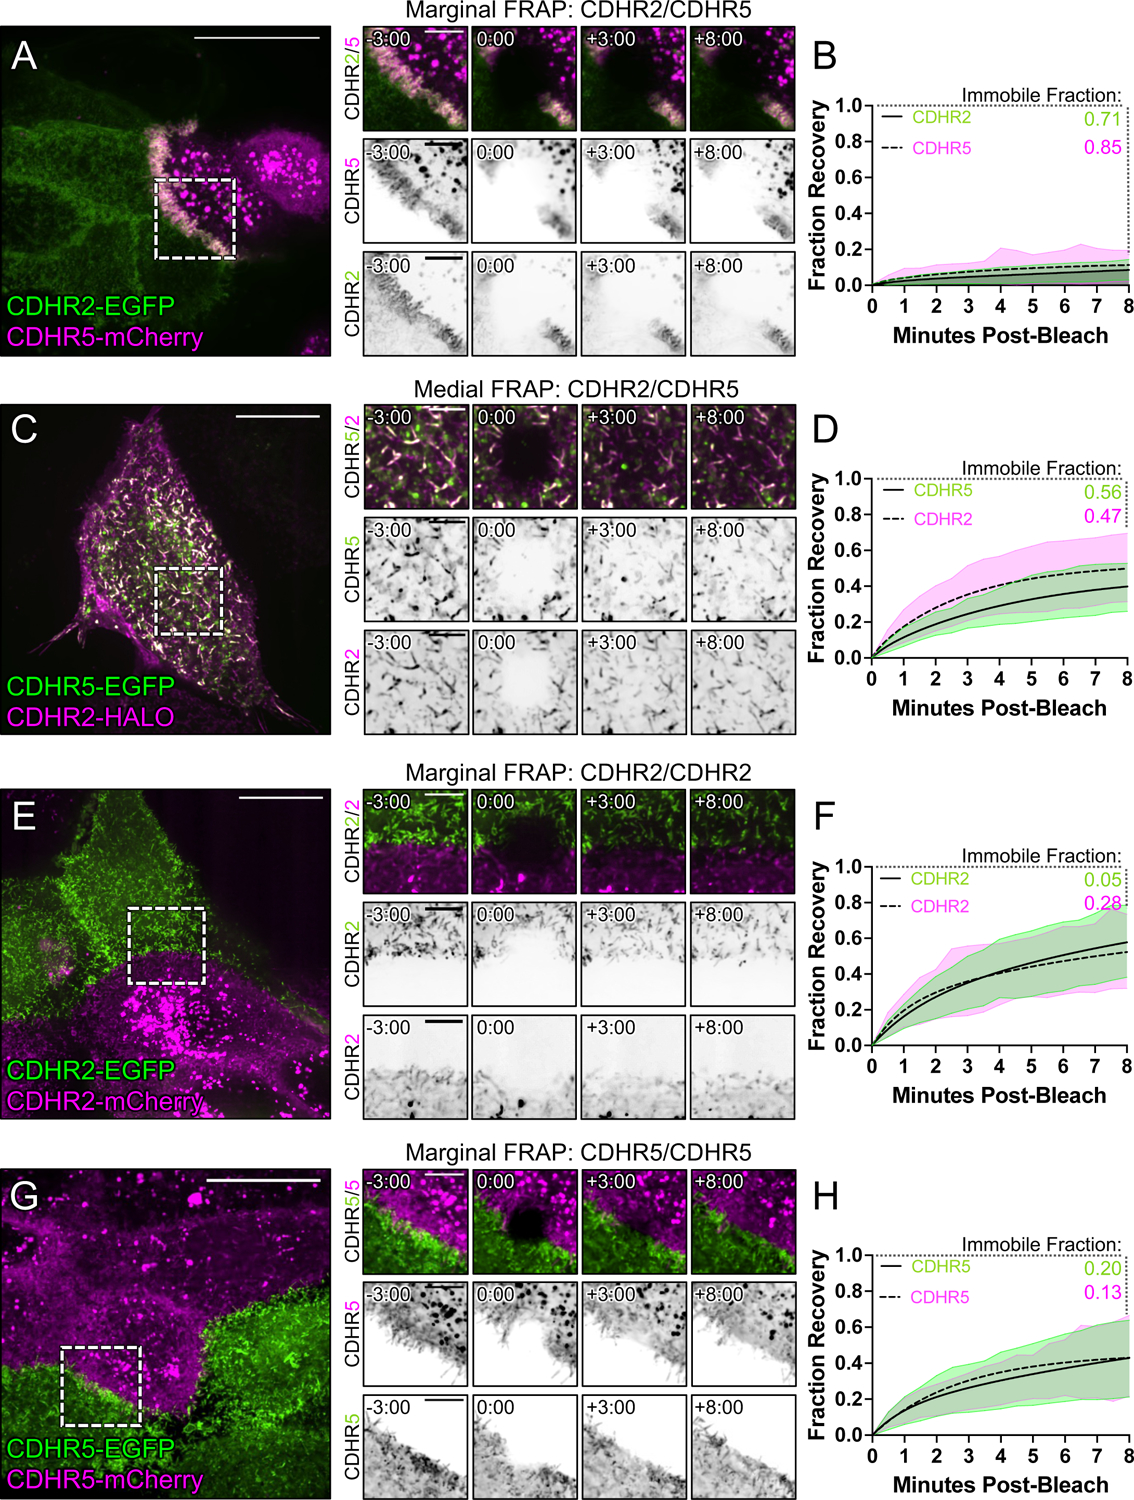
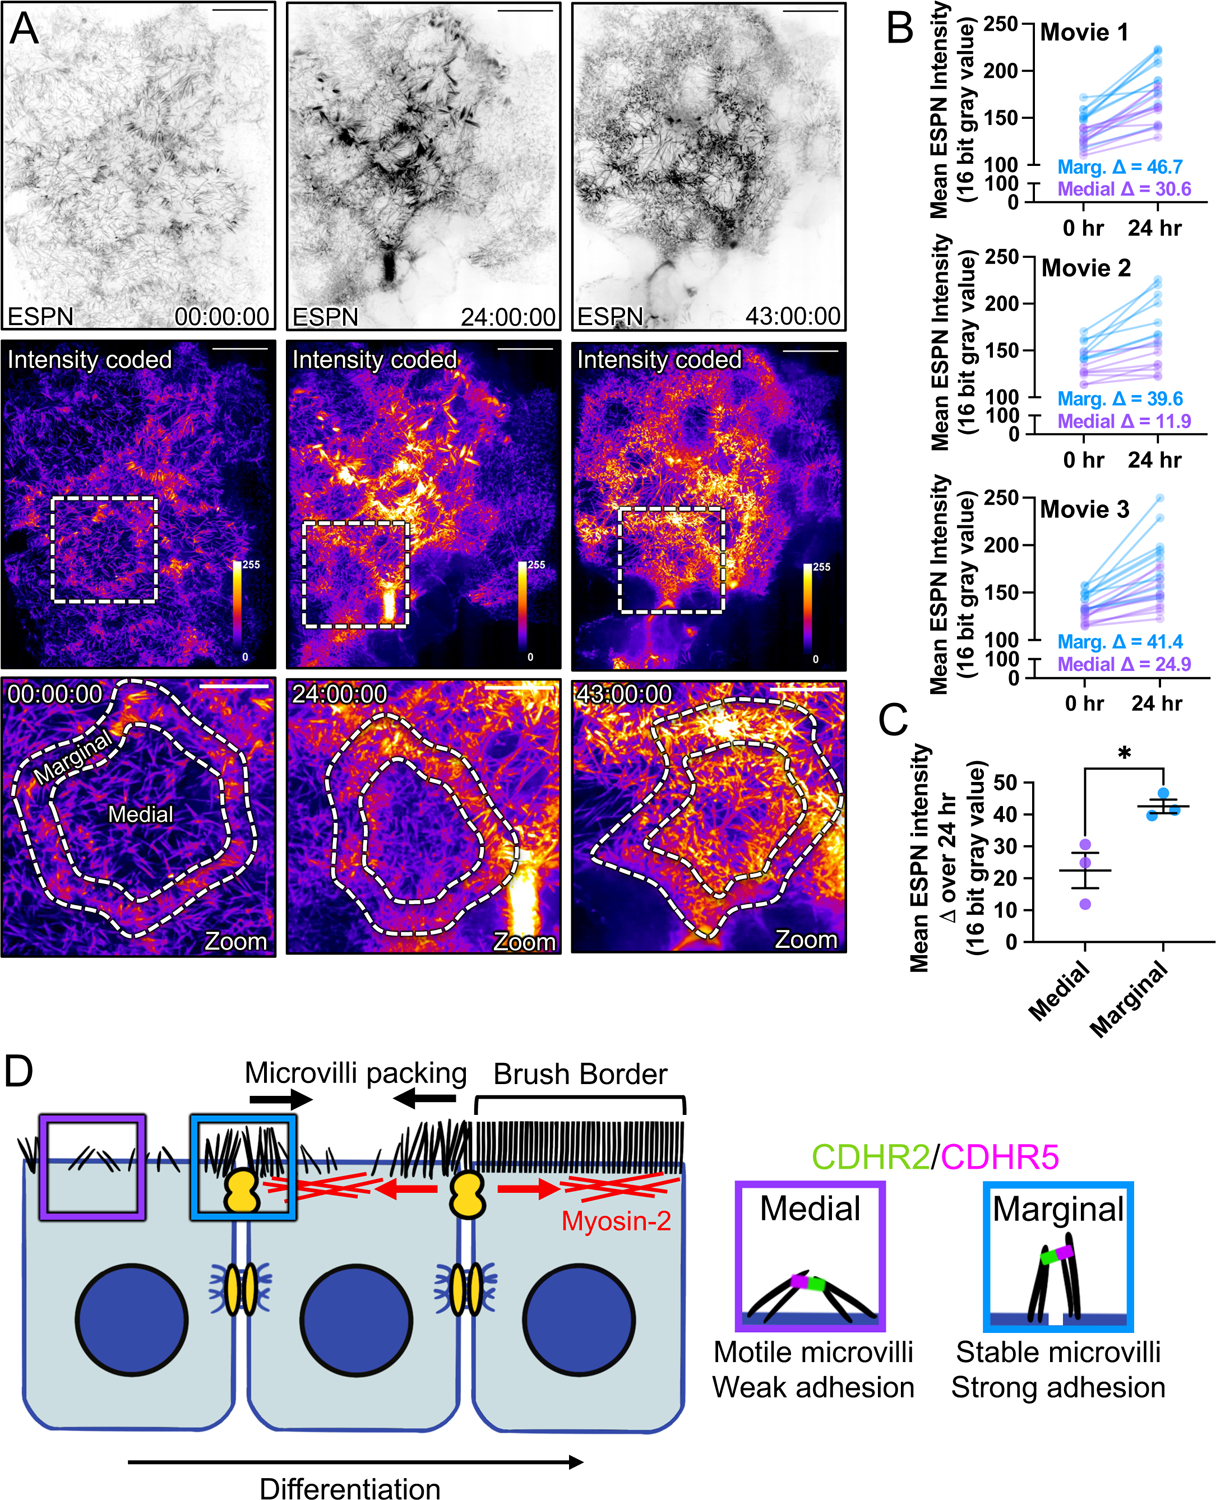
To maximize solute transport, epithelial cells build an apical "brush border," where thousands of microvilli are linked to their neighbors by protocadherin-containing intermicrovillar adhesion complexes (IMACs). Previous studies established that the IMAC is needed to build a mature brush border, but how this complex contributes to the accumulation of new microvilli during differentiation remains unclear. We found that early in differentiation, mouse, human, and porcine epithelial cells exhibit a marginal accumulation of microvilli, which span junctions and interact with protrusions on neighboring cells using IMAC protocadherins. These transjunctional IMACs are highly stable and reinforced by tension across junctions. Finally, long-term live imaging showed that the accumulation of microvilli at cell margins consistently leads to accumulation in medial regions. Thus, nascent microvilli are stabilized by a marginal capture mechanism that depends on the formation of transjunctional IMACs. These results may offer insights into how apical specializations are assembled in diverse epithelial systems.

Keywords: actin; brush border; cadherins; differentiation; intermicrovillar adhesion; transporting epithelia.


Conflict of interest statement

Declaration of interests The authors declare no competing interests.

Figures

Figure 1:
Figure 1:. Microvilli of differentiating transporting epithelial cells concentrate at cell margins.
(A) Scanning electron micrograph (SEM) of native mouse small intestine crypt-villus axis. (A, zoom) Zoom of the dashed box in A showing the crypt and transit amplifying zone. (B) High-magnification view of the crypt base with (B, zooms 1 and 2) showing an enrichment of microvilli at the margins of crypt cells (dashed blue outline). (C) SEM of 8 days post-confluence polarized CACO-2BBE cells. Dashed box represents zoom area. Arrows denote medial (purple) and marginal microvilli (blue). (D) SEM of sub-confluent porcine kidney proximal tubule LLC-PK1-CL4 (CL4) cells. Dashed box represents zoom area. Pseudo coloring represents medial area (purple) and marginal microvillar area (blue). (E) Schematic of the two distinct organizations of microvilli found on differentiating transporting epithelial cells, medial (purple) and marginal (blue). Scale bars: 50 μm (A), 10 μm (A, zoom), 2 μm (B), 1 μm (B, zooms), 10 μm (C), 5 μm (C, zoom), 20 μm (D), 10 μm (D, zoom).
Figure 2:
Figure 2:. Microvilli adopt a vertical orientation upon reaching cell margins.
(A) Maximum intensity projection (MaxIP) of live CL4 cells expressing mCherry-ESPN. (B) Orientation measurements of the angle (dashed outlines) of microvilli to the cell surface of medial microvilli (purple) compared to marginal microvilli (blue). Sample ROI of Z-projection under plot is taken from the dashed box in (A). (C) t = 0 MaxIP image of live mCherry-ESPN CL4 cells. Two neighboring cell margins are highlighted in blue, while the red arrowhead points to the microvilli cluster followed in (D). Right panel shows a 3D tilted volume of the dashed box in (C), coded in Z for cell depth (bottom left key). Cell margins are highlighted in blue. (D) Montage over 2 hours following the cluster marked with the red arrowhead/dashed box in (C). Arrowheads mark the distal ends of microvilli that transition to a vertical orientation upon reaching the marginal cell area, as shown by a change in Z-depth coding. Each point on the graph represents one angle taken from 17 cells; total of n = 295 medial and n = 309 marginal angles. Error bars represent mean ± SD. **** p ≤ 0.0001 Welch’s unpaired t-test. Mean medial angle is 46.5° ± 19.3° and mean marginal angle is 77.3° ± 12.4°. Scale bars: 20 μm (A), 1 μm (B), 10 μm (C, left), 5 μm (C, right), 1.5 μm (D).
Figure 3:
Figure 3:. Tip tracking analysis reveals that marginal microvilli are constrained in their movement.
(A, left panel) Live CL4 cells co-expressing EGFP-EPS8 and mCherry-ESPN. Dashed box represents zoom area with arrow marking EPS8 at the tip of a single microvillus. (A, right panels) Single inverted channel MaxIP images showing mCherry-ESPN and EGFP-EPS8 alone. (B) Temporal color-coding over 25 minutes (see vertical color key). (B, zooms) of (1) medial and (2) marginal ROIs taken from the dashed boxes in (B). (C) Rose plot of n = 53 XY tracks (μm units) of medial microvilli over 25 minutes. (D) Representative medial microvilli tracks taken from (C). (E) Mean square displacement (MSD) of 50 medial microvilli imaged for 5 minutes over 15 second intervals; magenta open circles represent mean MSD values, magenta color band indicates the 95% CI, and the solid magenta line indicates a best fit of the data to an active motion model with D = 0.058 μm2/min and V = 0.17 μm/min. (F) Rose plot of n = 28 XY tracks of marginal microvilli taken from 3 independent live cell imaging experiments over 25 minutes. (G) Representative marginal microvilli tracks taken from (F). (H) MSD analysis of n = 88 marginal microvilli; blue open circles represent the mean MSD values, blue color band indicates the 95% CI, and the solid blue line indicates a best fit to a constrained diffusion model with D of 0.017 μm2/min and a plateau of confinement at 0.22 μm2. Scale bars: 10 μm (A), 1.5 μm (A, zooms), 10 μm (B), 2.5 μm (B, zooms), 1 μm (D, G).
Figure 4:
Figure 4:. Marginal microvilli are linked via transjunctional CDHR2/CDHR5 adhesion complexes that extend across neighboring cell junctions.
(A) Single Z-plane confocal image of CDHR2-EGFP mouse small intestine stained for ZO-1 (yellow), EGFP (green), CDHR5 (magenta), and F-actin (blue). (B) Single plane SIM image of the stained villus section; approximated area marked by the dashed box in (A). (C) 3D volume projection of the section in (B). Yellow arrows in both images mark ZO-1 labeled tight junctions. (D) MaxIP laser-scanning confocal image of 12 DPC CACO-2BBE cells stained for CDHR2 (green), CDHR5 (cyan), and F-actin (magenta). Dashed box represents zoom area. White arrows point to tip localized CDHR2/CDHR5 adhesion complexes at cell margins. (E) MaxIP SIM image of 12 DPC CACO-2BBE cells stained for ZO-1 (yellow), CDHR2 (green), and F-actin (magenta). Dashed box represents zoom area. White arrows point to CDHR2/CDHR5 marked complexes at the junction of neighboring cells. (F) MaxIP SIM image of 3 DPC CL4 cells stained for ZO-1 (yellow), CDHR5 (cyan), and F-actin (magenta). (G) 3D tilted volume projection of 3 DPC CL4 cells stained for ZO-1 (yellow), CDHR2 (green), CDHR5 (magenta), and F-actin (blue). Brackets highlight instances of marginal microvilli on adjacent cells linked via CDHR2/CDHR5 transjunctional adhesion complexes (zoom 1 and 2). Scale bars: 20 μm (A), 5 μm (B), 5 μm (D), 2.5 μm (D, zoom), 10 μm (E), 2.5 μm (E, zoom), 10 μm (F), 2.5 μm (F, zoom).
Figure 5:
Figure 5:. Cell mixing experiments reveal robust heterophilic adhesion complexes between marginal microvilli.
(A, left) Schematic depicting cell mixing method for the C-terminally tagged cadherin overexpression constructs (A, right). (B) MaxIP laser scanning confocal image of mixed heterophilic CDHR2-EGFP and CDHR5-mCherry CL4 cell populations. Dashed box represents zoom area and cyan dashed outline represents sample linescan. (C, top) Normalized fluorescence intensity plot taken from a representative linescan along the mixed cell interface. (C, bottom) Plotted difference (residual) of mCherry signal from EGFP signal from the top linescan plot. (D) Pearson’s r correlation plot from the linescan in (C); r = 0.85. (E) MaxIP of mixed homophilic CDHR2-EGFP and CDHR2-mCherry CL4 cells. (F-G) Representative linescan and respective Pearson’s r correlation; r = 0.13. (H) MaxIP of mixed homophilic CDHR5-EGFP and CDHR5-mCherry CL4 cells. (I-J) Representative linescan and respective Pearson’s r correlation; r = 0.11. (K) Combined Pearson’s r values from n = 30 individual linescans of each cell mixing scenario from 3 independent fixation and staining experiments (10 linescans per experiment). Mean Pearson’s r values are denoted by a “+” for each scenario where heterophilic r = 0.70, homophilic CDHR2 r = 0.07, and homophilic CDHR5 r = −0.19. Ordinary one-way ANOVA with multiple comparisons; **** p ≤ 0.0001 and *** p ≤ 0.001. Scale bars: 30 μm (B, E, H), 10 μm (zoom insets).
Figure 6:
Figure 6:. FRAP analysis suggests that heterophilic, transjunctional adhesion complexes are stable.
Mixed CL4 cells forming (A) marginal heterophilic, (C) medial heterophilic, (E) marginal homophilic CDHR2, and (G) marginal homophilic CDHR5 adhesion complex interfaces. Dashed boxes outline the photobleached ROI shown in the recovery montages on right. (B, D, F, H) Fluorescence recovery is plotted over the course of 8 minutes with the immobile fractions as written for each protein channel. Immobile fractions were calculated from a two-phase association curve by subtracting the predicted plateau from 1 (100% fluorescence recovery). All plots represent 3 independent FRAP experiments of n20 ROIs from multiple cells. Scale bars: 20 μm (A, C, E, G), 5 μm (montages).
Figure 7:
Figure 7:. Long-term timelapse imaging reveals that microvilli accumulation at cell margins leads accumulation in medial regions during differentiation.
(A) MaxIP spinning disk confocal stills of live mCherry-ESPN expressing CL4 cells at t = 0, 24, and 43 hrs from a 43-hour acquisition. Intensity coded images show Fire LUT intensity profile of the mCherry-ESPN channel. Intensity scales from low (0; dark purple) to high (255; yellow/white) as denoted by LUT profile. Zooms at each time point are outlined by dashed boxes, with marginal and medial zones as marked. (B) Paired mean marginal and medial mCherry-ESPN intensities (16-bit gray value) at 0 and 24 hrs from three independent movies from n = 11 cells (movie 1), n = 8 cells (movie 2), and n = 11 cells (movie 3). The cut axes accounts for background mCherry signal. Mean Δ for the marginal and medial zones are denoted on each graph. (C) Mean ESPN intensity change over 24 hrs for medial (22.5 ± 5.7) and marginal (42.6 ± 3.5) zones. Error bars represent mean ± SEM. * p = 0.275 unpaired t-test. Scale bars: 20 μm (A-C), 10 μm (zooms). (D) An adhesion-based model for the marginal stabilization of microvilli during brush border assembly. Microvilli on nascent transporting epithelial cells initially organize into medial and marginal populations. Medial microvilli are highly motile while marginal microvilli are stable and stand at an orientation more vertical to the apical surface. Transjunctional CDHR2/CDHR5 heterophilic adhesion complexes span cell junctions and link marginal microvilli of neighboring cells. These complexes are long-lived, which leads to the accumulation of microvilli at the edges of cells that, in turn, may result in outside-in packing during differentiation.

Update of

References

    1. Coudrier E, Kerjaschki D, and Louvard D (1988). Cytoskeleton organization and submembranous interactions in intestinal and renal brush borders. Kidney Int 34, 309–320. 10.1038/ki.1988.183. - DOI - PubMed
    1. Sauvanet C, Wayt J, Pelaseyed T, and Bretscher A (2015). Structure, regulation, and functional diversity of microvilli on the apical domain of epithelial cells. Annu Rev Cell Dev Biol 31, 593–621. 10.1146/annurev-cellbio-100814-125234. - DOI - PubMed
    1. Mooseker MS, and Tilney LG (1975). Organization of an actin filament-membrane complex. Filament polarity and membrane attachment in the microvilli of intestinal epithelial cells. J Cell Biol 67, 725–743. 10.1083/jcb.67.3.725. - DOI - PMC - PubMed
    1. Ohta K, Higashi R, Sawaguchi A, and Nakamura K (2012). Helical arrangement of filaments in microvillar actin bundles. Journal of structural biology 177, 513–519. 10.1016/j.jsb.2011.10.012. - DOI - PubMed
    1. Helander HF, and Fandriks L (2014). Surface area of the digestive tract - revisited. Scand J Gastroenterol 49, 681–689. 10.3109/00365521.2014.898326. - DOI - PubMed

Publication types

LinkOut - more resources