. 2023 Nov 7;10(11):ENEURO.0297-23.2023.
doi: 10.1523/ENEURO.0297-23.2023. Print 2023 Nov.

Plasticity in Preganglionic and Postganglionic Neurons of the Sympathetic Nervous System during Embryonic Development

Affiliations

Plasticity in Preganglionic and Postganglionic Neurons of the Sympathetic Nervous System during Embryonic Development

April Ratliff et al. eNeuro. .

Abstract

Sympathetic preganglionic neurons (SPNs) are the final output neurons from the central arm of the autonomic nervous system. Therefore, SPNs represent a crucial component of the sympathetic nervous system for integrating several inputs before driving the postganglionic neurons (PGNs) in the periphery to control end organ function. The mechanisms which establish and regulate baseline sympathetic tone and overall excitability of SPNs and PGNs are poorly understood. The SPNs are also known as the autonomic motoneurons (MNs) as they arise from the same progenitor line as somatic MNs that innervate skeletal muscles. Previously our group has identified a rich repertoire of homeostatic plasticity (HP) mechanisms in somatic MNs of the embryonic chick following in vivo synaptic blockade. Here, using the same model system, we examined whether SPNs exhibit similar homeostatic capabilities to that of somatic MNs. Indeed, we found that after 2-d reduction of excitatory synaptic input, SPNs showed a significant increase in intracellular chloride levels, the mechanism underlying GABAergic synaptic scaling in this system. This form of HP could therefore play a role in the early establishment of a setpoint of excitability in this part of the sympathetic nervous system. Next, we asked whether homeostatic mechanisms are expressed in the synaptic targets of SPNs, the PGNs. In this case we blocked synaptic input to PGNs in vivo (48-h treatment), or acutely ex vivo, however neither treatment induced homeostatic adjustments in PGN excitability. We discuss differences in the homeostatic capacity between the central and peripheral component of the sympathetic nervous system.

Keywords: autonomic nervous system; chick embryo; homeostatic plasticity; sympathetic nervous system; synaptic scaling.


Conflict of interest statement

The authors declare no competing financial interests.

Figures
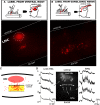
Figure 1.
Figure 1.
Location and calcium transients of lumbosacral SPNs in E10 embryos. A, Texas Red retrograde labeling from ventral root reveals two populations of neurons. One population is consistent with lateral motor column (LMC), the other population is medial, slightly dorsal of the central canal, consistent with Column of Terni. B, In separate experiments, the medial population of SPNs were also retrogradely labeled from the IGN, which did not result in labeling of limb motoneurons in the LMC. C, Of the 179 total cells imaged on medial surface, 81.0% were in the region between the central canal and halfway to the dorsal edge of the cord (highlighted in yellow), where SPNs reside. D, Calcium transients were observed using cells labeled by the calcium indicator Calcium green. The medial view of the hemicord revealed that both limb MNs and SPNs were active during evoked and spontaneous episodes of network activity (ΔF/F of >20%, N = 3 cords).
Figure 2.
Figure 2.
Intracellular chloride levels of MNs and SPNs were altered after synaptic blockade. A, Clomeleon electroporation into the neural tube at embryonic day 3 (E3). B, YFP, CFP, and merged image of ventral view of spinal cord were used to analyze chloride levels in somatic MNs in E10 spinal cord. Schematic at bottom left shows orientation of ventral view. C, Analysis of MNs showed significant reduction in YFP/CFP ratio in drug-treated group. In order to examine entire dataset while controlling for unbalanced number of cells observed between cords, hierarchical bootstrapping was implemented. This analysis of resampled data revealed lower ratios in GBZ-treated cells (1.79 ± 0.03) compared with vehicle (1.92 ± 0.05, p = 0.035,*). D, Left, Medial view of hemisected spinal cord was imaged for analysis of SPNs. Right, Merged YFP-CFP image, with SPNs designated with white arrow, at E10 in embryos which were labeled with Clomeleon at E3. E, Analysis of SPNs also revealed a reduction in ratio in GBZ-treated cells. Hierarchical bootstrapping test confirmed lower ratios in GBZ-treated cords compared with control cords (GBZ =1.66 ± 0.04, H2O = 1.86 ± 0.07, p < 0.0001,***). Finally, linear mixed effects test was performed on entire dataset, which determined difference between groups is explained by fixed effect of treatment group, not driven by random effects such as embryo number or experiment date (p < 0.005). See Extended Data Figure 2-1 for additional statistical treatment of data.
Figure 3.
Figure 3.
PGNs develop mature synaptic activity between E13 and E17. A, Schematic of PGN extracellular recording set up. B, Example traces at E17 show evoked response, including synaptically-driven discharge in PGNs (highlighted in green box, 10 ms), followed by a reduction in discharge after the addition of 100 μm Hex into the bath. C, The reduction of discharge was calculated across many trials for the following developmental stages: E10, E13, and E17 (gray lines represent individual experiments, green dashed line represents mean). Paired, two tailed t tests revealed the following: at E10, there was no difference in discharge after the addition of Hex (t(3) = 1.8, p = 0.17). At E13, there was a significant reduction in synaptic discharge with Hex (t(3) = 6.6, p < 0.01, **). At the E17 stage, the activity was significantly reduced after addition of 100 μm Hex (t(6) = −4.6, p < 0.005, ***).
Figure 4.
Figure 4.
Nicotinic blockade led to a change in excitability in PGNs that did not appear to be in a compensatory direction. A, Progressively increasing depolarizing current steps (500 ms in duration, intervals of 5 pA) were delivered every other second. B, Frequency/current (f/I) curve reveals the relationship between treatment condition and excitability of cells. Two-way repeated measures ANOVA revealed a main effect of input current on output number of action potentials, as well as a significant between-group effect of treatment (F(14) = 32.8, p < 0.0001). Because cords were not evenly sampled, and because of the hierarchical nature of the dataset, a linear mixed effect (LME) model was performed on a linear portion of the dataset (20 to 55 pA) to verify this effect of treatment group. This analysis showed a significant effect of treatment group (t(15.49) = −2.28, p = 0.037), and eliminated any effect of potential confounding factors such as experiment date. C, Schematic representation of parameters measured from individual spikes, summarized in Table 1. D, To confirm the effect using all input current values, logistic regression model was trained on a subset of data to predict the treatment group. When given naive data from the test dataset, the mean accuracy of the model was significantly greater than chance (mean accuracy = 82.7%, t(28) = 7.29, p < 0.001, ***). In comparison, the model’s accuracy when predicting treatment group for a shuffled dataset, was no better than chance (mean accuracy = 46.6%, not different from chance accuracy of 0.50 (t(28) = 0.63, p = 0.54), further validating the effect of treatment group. Error bars represent standard error.
Figure 5.
Figure 5.
Acute nicotinic blockade resulted in reduction of synaptic activity which did not recover over several hours. Ex vivo preparations of sympathetic chain tissue were used for extracellular recordings in baseline conditions, and during nicotinic blockade using either 50 or 100 μm hexamethonium (Hex). Synaptic activity was evoked using a train of three stimulations (20-Hz interval) every 5 min, and the resulting synaptic discharge was calculated at each time point. The synaptic discharge remained reduced for several hours, such that baseline levels of synaptic activity did not recover for 4–5 h of nicotinic blockade. In two experiments, washout of the drug was conducted. Synaptic activity returned after washout, demonstrating that the tissue was still healthy.

References

    1. Aarts E, Verhage M, Veenvliet JV, Dolan CV, Van Der Sluis S (2014) A solution to dependency: using multilevel analysis to accommodate nested data. Nat Neurosci 17:491–496. 10.1038/nn.3648 - DOI - PubMed
    1. Aye CYL, Lewandowski AJ, Oster J, Upton R, Davis E, Kenworthy Y, Boardman H, Yu GZ, Siepmann T, Adwani S, McCormick K, Sverrisdottir YB, Leeson P (2018) Neonatal autonomic function after pregnancy complications and early cardiovascular development. Pediatr Res 84:85–91. 10.1038/s41390-018-0021-0 - DOI - PMC - PubMed
    1. Ben-Ari Y (2002) Excitatory actions of GABA during development: the nature of the nurture. Nat Rev Neurosci 3:728–739. 10.1038/nrn920 - DOI - PubMed
    1. Black IB, Hendry IA, Iversen LL (1971) Trans-synaptic regulation of growth and development of adrenergic neurones in a mouse sympathetic ganglion. Brain Res 34:229–240. 10.1016/0006-8993(71)90278-2 - DOI - PubMed
    1. Calinescu AA, Liu T, Wang MM, Borjigin J (2011) Transsynaptic activity-dependent regulation of axon branching and neurotrophin expression in vivo. J Neurosci 31:12708–12715. 10.1523/JNEUROSCI.2172-11.2011 - DOI - PMC - PubMed

Publication types

MeSH terms