. 2023 Oct 13;6(12):e202302200.
doi: 10.26508/lsa.202302200. Print 2023 Dec.

The coenzyme A precursor pantethine enhances antitumor immunity in sarcoma

Affiliations

The coenzyme A precursor pantethine enhances antitumor immunity in sarcoma

Richard Miallot et al. Life Sci Alliance. .

Erratum in

  • Correction: The coenzyme A precursor pantethine enhances antitumor immunity in sarcoma.
    Miallot R, Millet V, Roger A, Fenouil R, Tardivel C, Martin JC, Tranchida F, Shintu L, Berchard P, Sousa Lanza J, Malissen B, Henri S, Ugolini S, Dutour A, Finetti P, Bertucci F, Blay JY, Galland F, Naquet P. Miallot R, et al. Life Sci Alliance. 2023 Nov 29;7(2):e202302479. doi: 10.26508/lsa.202302479. Print 2024 Feb. Life Sci Alliance. 2023. PMID: 38030222 Free PMC article.

Abstract

The tumor microenvironment is a dynamic network of stromal, cancer, and immune cells that interact and compete for resources. We have previously identified the Vanin1 pathway as a tumor suppressor of sarcoma development via vitamin B5 and coenzyme A regeneration. Using an aggressive sarcoma cell line that lacks Vnn1 expression, we showed that the administration of pantethine, a vitamin B5 precursor, attenuates tumor growth in immunocompetent but not nude mice. Pantethine boosts antitumor immunity, including the polarization of myeloid and dendritic cells towards enhanced IFNγ-driven antigen presentation pathways and improved the development of hypermetabolic effector CD8+ T cells endowed with potential antitumor activity. At later stages of treatment, the effect of pantethine was limited by the development of immune cell exhaustion. Nevertheless, its activity was comparable with that of anti-PD1 treatment in sensitive tumors. In humans, VNN1 expression correlates with improved survival and immune cell infiltration in soft-tissue sarcomas, but not in osteosarcomas. Pantethine could be a potential therapeutic immunoadjuvant for the development of antitumor immunity.


Conflict of interest statement

The authors declare that they have no conflict of interest.

Figures
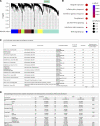
Figure S1.
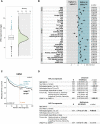
Figure S1.. VNN1 expression in human soft-tissue sarcomas and correlation with immune signatures and clinicopathological characteristics.
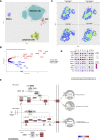
(A) Weighted Gene Correlation Network Analysis of 224 TCGA STS samples and 8,989 filtered genes showing eight robust gene clusters (module colors), including the 505-gene cluster containing VNN1 (light blue). (B) The seven MSigDB hallmarks significantly associated with the VNN1-containing gene cluster. (C) List of soft-tissue sarcoma datasets included in our analysis. (D) Clinicopathological characteristics of patients and samples in the whole population and according to the VNN1-based classification. VNN1-high versus low classes are based on the mean expression value as cut-off.
Figure 1.
Figure 1.. VNN1 expression has prognostic value in soft-tissue sarcomas.
(A) Box plot showing the distribution of mRNA expression levels of VNN1 in 1,377 tumor samples. (B) Correlations of VNN1 expression-based classes (high versus low using the mean expression value as cut-off) and immune variables. Forest plots of correlations with the following immune features: immune pathway activation (Gatza), innate and adaptive immune cell subpopulations (Bindea), Immunologic Constant of Rejection score, and cytolytic activity score associated with antitumor cytotoxic immune response, tumor inflammation signature and tertiary lymphoid structure signature associated with response to immune checkpoint inhibitors, and antigen-processing machinery score. The P-values are for the logit link test. N = 1,377, except for two modules indicated by “*” (Treg and pDC) that were informed in 1,152 cases. (C) Kaplan–Meier metastasis-free survival curves according to VNN1 expression (high versus low using the mean expression value as cut-off). The P-value is for the log-rank test. (D) Uni and multivariate prognostic analyses for metastasis-free survival. The VNN1 classes are based on the mean expression value as cut-off. The P-values are for the Wald test. Source data are available for this figure.
Figure S2.
Figure S2.. VNN1 expression in human soft-tissue sarcomas using a second more stringent cut-off and correlation with clinicopathological, immune, and metastasis-free survival (MFS) data.
(A) Clinicopathological characteristics of patients and samples in the whole population and according to VNN1-based classification. The VNN1-high-sd versus low-sd classes are based on the mean expression level of the whole series ±0.5 SD as cut-off. (B) Correlations of VNN1 expression-based classes and immune variables. The VNN1-high-sd versus low-sd classes are based on the mean expression level of the whole series ±0.5 SD as cut-off. (C) Kaplan–Meier MFS curves according to VNN1 expression (high-sd versus low-sd using the mean expression level of the whole series ±0.5 SD as cut-off). The P-value is for the log-rank test. (D) Univariate prognostic analyses for MFS. The VNN1 classes are based on the mean expression level of the whole series ±0.5 SD as cut-off. The P-values are for the Wald test.
Figure S3.
Figure S3.. Absence of prognostic value for metastasis-free survival of VNN1 expression in human bone sarcomas and osteosarcomas.
(A) List of bone sarcoma and osteosarcoma datasets included in the analysis. (B) Kaplan–Meier metastasis-free survival curves according to VNN1 mRNA expression in a cohort of 326 patients with bone sarcoma (left), and a sub-cohort of 94 patients with osteosarcoma (right). The P-values are for the log-rank test.
Figure 2.
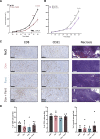
Figure 2.. Pantethine inhibits sarcoma growth.
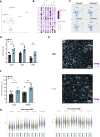
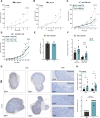
(A) Enzymatic reaction catalyzed by the Vanin1 pantetheinase: pantetheine is hydrolyzed by Vnn1 into cysteamine and vitamin B5 or pantothenic acid, the latter being the coenzyme A biosynthetic precursor (for the complete pathway of CoA synthesis, refer to Fig S4). (B) Schematic representation of the experimental design of murine MCA sarcoma model. (B, C, D) MCA205 tumor growth scored after daily injection of Pant in C57BL/6 mice (n = 88) (B) or nude mice (n = 26) (C). Tumor follow-up was interrupted on day 22 in nude mice as limits in authorized tumor sizes were reached. Two-way ANOVA with Šídák’s multiple comparisons test. Data are shown with SEM. (D, E, F) Effect of Pant therapy in MCA tumor-bearing mice receiving anti-CTLA4 (n = 7 per condition) (D); or anti-PD1 (n = 6 per condition) mAbs (E). (G) Growth of OsA orthotopic tumors receiving independent or combined doxorubicine or Pant therapy or vehicle control (n = 6 per condition). (D, E, H) Therapeutic effect of Pant therapy, alone (D) or combined with PD1 blockade (E) on B16F10 melanoma growth (n = 10 per condition). Source data are available for this figure.
Figure S4.
Figure S4.. Synthesis of coenzyme A from the pantothenate precursor.
Figure S5.
Figure S5.. Effect of pantethine metabolites on growth.
(A, B) Effect of administration of pantetheinase products cysteamine and Pan on MCA growth (A). (B) Effect of Vnn1-expression on MCA growth (n = 8) (B). (C, D) Immunochemistry analysis (C) and quantification (D) of paraffin-embedded OsA tumor samples using CD8, CD31 labeling, and necrosis scoring; n = 5–8. Source data are available for this figure.
Figure 3.
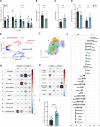
Figure 3.. Analysis of the myeloid compartment.
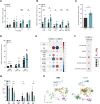
(A) Kinetic evaluation of the CD11b+/CD11b ratio by flow cytometry analysis of immune infiltrating cells in PBS or Pant tumors (n = 6–8 per condition). Mann–Whitney test; **P-value < 0.01. Gating strategies are explained in Fig S6. (B, C) Quantification of monocyte (B) and tumor-associated macrophage (TAM) (C) clusters among CD45+ cells by flow cytometry on D20 tumors. (D) Proportion of MHCIIlow and MHCIIhigh TAMs in total TAM (Ly6Clow F4/80+ CD64+) PBS and Pant-treated D20 tumors (n = 12). (E) Volcano plot representation of myeloid cell transcripts showing differential expression between Pant and PBS samples at D20. Dot colors refer to average log2FC: positive in red, negative in blue, below the threshold in black. (A, B, C, F) Individual uniform manifold approximation, projection, clustering, and population identification computed for the myeloid metacluster delineated 11 clusters: neutrophils, monocytes, Mono-TAM (A, B, C), inflammatory TAM, TAM TNFα/NFκB, moDC, CAF, M2, and Ki67 TAM. (G, H) Pearson’s residuals of TAM and APC cell clusters from single-cell dataset obtained from CD45-enriched cells from tumors harvested at day 20 and D28 of PBS or Pant-treated mice (n = 2). Cell subset enrichment is represented on a colored scale from red (enriched in PANT) to blue (enriched in PBS). (I) Quantification of cell contacts between CD8β+ and MHC II+ cells on D24 tumor sections shown in Fig S7E. Mann–Whitney test; ****P-value < 0.0001. (J) Proteomic profiling of tumor lysates represented by enrichment in Pant versus PBS condition (n = 4). Source data are available for this figure.
Figure S6.
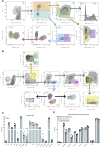
Figure S6.. Flow cytometric analysis of immune cells.
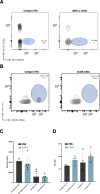
(A) Gating strategy for the analysis of CD45+ cells by flow cytometry shown in Fig 3A. (B) Gating strategy for the flow cytometry analysis of lymphoid populations. (C, D) Quantification of immune cells in lymph nodes (C) and spleen (D) at steady state or in the presence of a tumor, with or without Pant administration at D24.
Figure S7.
Figure S7.. Single-cell analysis of myeloid cells.
(A) Uniform manifold approximation, projection representation of the four metaclusters identified after analysis of the pooled single-cell experimental data: myeloid, APC, lymphoid and nonimmune cells called others. (B) Volcano plot highlighting the results of differential expression analysis in PBS versus Pant sample at day 28. The names of the top 10 up- and down-regulated genes sorted by P-value are highlighted. (C, D) Density plot representation of the myeloid metacluster for each experimental condition (C) showing the definition of 11 cell subsets (D) based on the preferential expression of cell-specific markers (Fig 3F) defining neutrophils (Ly6g, cluster 8), monocytes (Ly6c2, cluster 7), tumor-associated macrophage (TAM) subsets (Adgre1, clusters 2, 4–6, 10, 11), proliferating cells (mKi67, cluster 9) or cell signatures linked with activation or polarization pathways (cluster 11, TNF/NF-κB; cluster 10 and 2 for M1- versus M2-like phenotypes) (Fig 3F). (A, B, C) Transitional stages of TAM maturation were annotated mono-TAM (A, B, C) (clusters 4–6) as described (Liu & Cao, 2015). The color of circles represents the averaged normalized expression values across relevant cells, and their size is proportional to the proportion of corresponding cells. (E) Kyoto Encyclopedia of Genes and Genomes pathways graph representation of the pathway “Antigen processing and presentation” for myeloid cells at D20. Colored boxes show the relative logFC ratio computed during differential expression analysis (red = enriched in Pant; blue = enriched in PBS).
Figure S8.
Figure S8.. Single-cell analysis of APCs.
(A, B) Projection on an individual uniform manifold approximation, projection (A) and identification of dendritic cell clusters (B) based on the enhanced expression of specific markers for cDC1, cDC2, regulatory-like DC, proliferating DC, IFN-responsive monoDC, pDC, and B cells. (C) Density plot representation of the APC metacluster for each experimental condition. (D) Geometric mean fluorescence intensity of MHC II staining on tumor infiltrating APC at day 20 from PBS and Pant-treated mice evaluated by flow cytometry. (n = 5–7 per condition). Mann–Whitney test; **P-value < 0.01. (E) Immunofluorescence analysis of CD8β and MHC II staining on PBS and Pant tumor sections (n = 10) at day 20. The contact points between CD8β+ cells and MHC II+ cells were quantified and normalized by the number of CD8β+ cells present in the field. (F) Cytometric bead assay quantification of CCL2 and CXCL9 concentrations in tumor lysates at day 20 from PBS and Pant-treated mice (n = 7 per condition). Mann–Whitney test; **P-value < 0.01. *P-value < 0.05. (G) Normalized expression values as modulescore (Seurat) of previously defined antitumoral and protumoral genesets in different clusters from days 20 and 28 from PBS and Pant-treated tumors. Values are centered–scaled for each row. Source data are available for this figure.
Figure 4.
Figure 4.. Analysis of the lymphoid compartment.
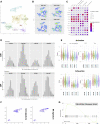
(A) Kinetic evaluation of the CD8+/CD4+ Treg cell ratio by flow cytometry among immune infiltrated cells in tumor from PBS or Pant samples (n = 5 per condition). Mann–Whitney test; * P-value < 0.05. Gating strategy shown in Fig S8B. (B) Relative numbers of tumor-infiltrating lymphocytes per mg of PBS and Pant tumors. (C) Quantification of OVA-specific CD8 T cells in tumor draining lymph node evaluated by flow cytometry using a SIINFEKL tetramer. (C, D) Flow cytometry analysis of effector molecule expression by CD8 T cells isolated from day 20 tumors and in vitro restimulated in the presence of PMA/ionomycin/brefeldin A (n = 6) (C). Mann–Whitney test; **P-value < 0.01; * P-value < 0.05. (E) Pearson’s residuals of lymphoid cell clusters from a single-cell dataset obtained from CD45-enriched cells from tumors harvested at day 20 and D28 of PBS or Pant samples (n = 2). (F) Graphic representation of Gene Set Enrichment Analyses performed in the proliferating CD8 T cell subset as indicated in Table 1. (G) Flow cytometry analysis of immune checkpoint expression by tumor-infiltrating lymphocytes from PBS and Pant-treated mice at day 28 (n = 6). Mann–Whitney test; **P-value < 0.01; * P-value < 0.05. (H) Projection of individual cell velocity as determined by scVelo analysis performed on each subset of lymphoid cells from D20 samples. Source data are available for this figure.
Figure S9.
Figure S9.. Single-cell analysis of lymphoid cells.
(A) Identification on individual uniform manifold approximation, projection projection of the 8 clusters segregating the lymphoid metacluster: NK1.1/ILC1, CD8+, activated CD8+, CD4+, Treg and Ki67 CD4+ T cells, Tregs, and NK cells, represented in the uniform manifold approximation, projection. (B, C) Density plot representation of the lymphoid metacluster for each experimental condition (B) and cell-specific marker-based identification of cell subset (C). (D) Representation of the number of coexpressed activation-associated genes (defined as positive) in CD8+ or CD4+ T cells under various experimental conditions. (E) Module score representation of normalized expression values averaged across cells for activation and exhaustion gene sets in CD4+ and CD8+ T cells from D20–D28 tumors. Values are centered–scaled for each row. (F) Relative expression of top 20 ILC (left) and NK (right) cells markers genes as described in the Materials and Methods section. (G) Graphic representation of the Gene Enrichment Analysis performed on NK1.1+ cells.
Figure 5.
Figure 5.. Requirements for Pant antitumor efficacy.
(A, B, C, D, E, F) MCA growth curves in Ifnrgr1-deficient (n = 7–8 per condition) (A), cDC1 cell-deficient XCR1DTA (n = 10–11 per condition) (E), anti CD8 (n = 10–11 per condition) or anti NK1.1-treated (n = 8 per condition) (F) control or Pant-treated mice. Two-way ANOVA with Šídák’s multiple comparisons test; ****P-value < 0.0001, **P-value < 0.01, * P-value < 0.05. (E, F, G, H) PFU quantifying viral load (G) and numbers of CD8+ T cell subpopulations (H) in the draining lymph nodes of HSV1-infected mice after 8 d of PBS or Pant treatment. (G) Immunochemistry analysis of PBS and Pant tumor sections using anti-CD3 and anti-CD8 mAbs on D24. (H) Quantification of the absolute number of positive cells per field (top panel) and of the immune infiltration score (bottom panel). n = 10. Mann–Whitney test; ****P-value < 0.0001, * P-value < 0.05. Source data are available for this figure.
Figure S10.
Figure S10.. Control experiments.
(A, B) Flow cytometry control of CD8 (A) and NK1.1+ (B) cell depletion in peripheral blood lymphocytes. (C, D) Absolute numbers (C) and CFSE quantification (D) of OT1+ cells present in the culture with DC extracted for tumor-draining lymph nodes in the presence or absence of OVA SIINFEKL peptide (n = 5 per condition). Source data are available for this figure.
Figure 6.
Figure 6.. Metabolic changes induced by Pant administration.
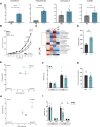
(A) Metabolomics quantification of VitB5-related metabolites with or without Pant administration in tumor masses (n = 7 per condition). (B) MCA205 tumor growth scored after daily injections of Pant, dichloroacetate (DCA) combined with Pant or not in C57BL/6 mice (n = 24). Two-way ANOVA with Šídák’s multiple comparisons test; ****P-value < 0.0001, ***P-value < 0.001, **P-value < 0.01, * P-value < 0.05. Data are shown with SEM. (C) Metabolomics analysis of total tumors from mice treated with PBS, Pant, DCA, Pant + DCA by LC-MS (n = 10) showing the hierarchical cluster of metabolic pathways according to treatment conditions. Scaling is in the unit of variance (mean/squared root of SD). (D) Geometric mean fluorescence intensity of MitoSox-stained MCA cells incubated or not for 4 h in Pant-enriched medium in vitro (n = 6 per condition). Mann–Whitney test; **P-value < 0.01. (E) Seahorse analysis of an energetic map integrating oxygen consumption and extracellular acidification rates measurements of in vitro Pant-treated MCA205 or PBS control cells (n = 2). (F) MDR/MG ratio of CD45 cells at D24 and D28 from Pant-treated or PBS control mice (n = 7). (G) Lactate concentration quantified in whole-tumor masses from PBS or Pant-treated mice at day 20 post engraftment (n = 8 per condition). (H) Energetic map of CD8+ tumor-infiltrating lymphocytes isolated from tumor mass D20 post cell engraftment. Mice were treated with PBS or Pant starting on day 10 (n = 3). (I) MDR/MG ratio of CD8+ and CD4+ tumor-infiltrating lymphocytes at D20 and D28 from Pant-treated or PBS control mice (n = 7). Mann–Whitney test; * P-value < 0.05. Source data are available for this figure.
Figure S11.
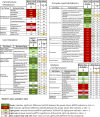
Figure S11.. Metabolomics of control and Pant samples at D20 post cell engraftment including pantothenate metabolism, complex lipid metabolism, lipid oxidation, and markers of inflammation (performed by Metabolon).
Figure S12.
Figure S12.. Metabolic analysis.
(A) Nuclear magnetic resonance principal component analysis analysis of PBS, Pant, dichloroacetate, DCA + Pant samples showing the top five enriched metabolites detected in samples. Correlation coefficients were calculated for each metabolite (n = 10 per condition). (B) Plot representation of MDR versus MG staining of CD45 cells from PBS or Pant tumors harvested at days 20 and 28 post engraftment. (C) qRT–PCR quantification of metabolic gene transcripts from CD45-negative cells enriched from tumors harvested at day 20 from PBS or Pant-treated mice (n = 5 per condition). Source data are available for this figure.

References

    1. Abdi K, Singh NJ (2015) Making many from few: IL-12p40 as a model for the combinatorial assembly of heterodimeric cytokines. Cytokine 76: 53–57. 10.1016/j.cyto.2015.07.026 - DOI - PMC - PubMed
    1. Almeida L, Dhillon-LaBrooy A, Carriche G, Berod L, Sparwasser T (2021) CD4+ T-cell differentiation and function: Unifying glycolysis, fatty acid oxidation, polyamines NAD mitochondria. J Allergy Clin Immunol 148: 16–32. 10.1016/j.jaci.2021.03.033 - DOI - PubMed
    1. Ayers M, Lunceford J, Nebozhyn M, Murphy E, Loboda A, Kaufman DR, Albright A, Cheng JD, Kang SP, Shankaran V, et al. (2017) IFN-γ-related mRNA profile predicts clinical response to PD-1 blockade. J Clin Invest 127: 2930–2940. 10.1172/JCI91190 - DOI - PMC - PubMed
    1. Bailis W, Shyer JA, Zhao J, Canaveras JCG, Al Khazal FJ, Qu R, Steach HR, Bielecki P, Khan O, Jackson R, et al. (2019) Distinct modes of mitochondrial metabolism uncouple T cell differentiation and function. Nature 571: 403–407. 10.1038/s41586-019-1311-3 - DOI - PMC - PubMed
    1. Ballot E, Ladoire S, Routy B, Truntzer C, Ghiringhelli F (2020) Tumor infiltrating lymphocytes signature as a new pan-cancer predictive biomarker of anti PD-1/PD-L1 efficacy. Cancers (Basel) 12: E2418. 10.3390/cancers12092418 - DOI - PMC - PubMed

Publication types