. 2023 Oct 13;14(1):6433.
doi: 10.1038/s41467-023-42133-5.

Chromatin organization drives the search mechanism of nuclear factors

Affiliations

Chromatin organization drives the search mechanism of nuclear factors

Matteo Mazzocca et al. Nat Commun. .

Abstract

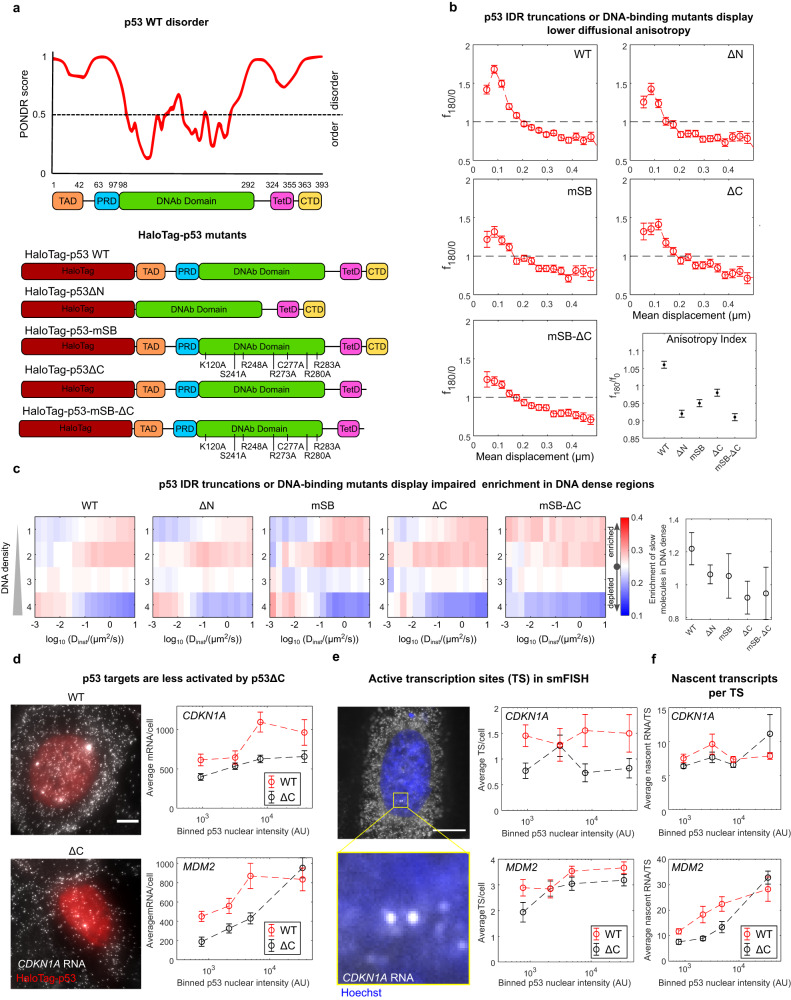
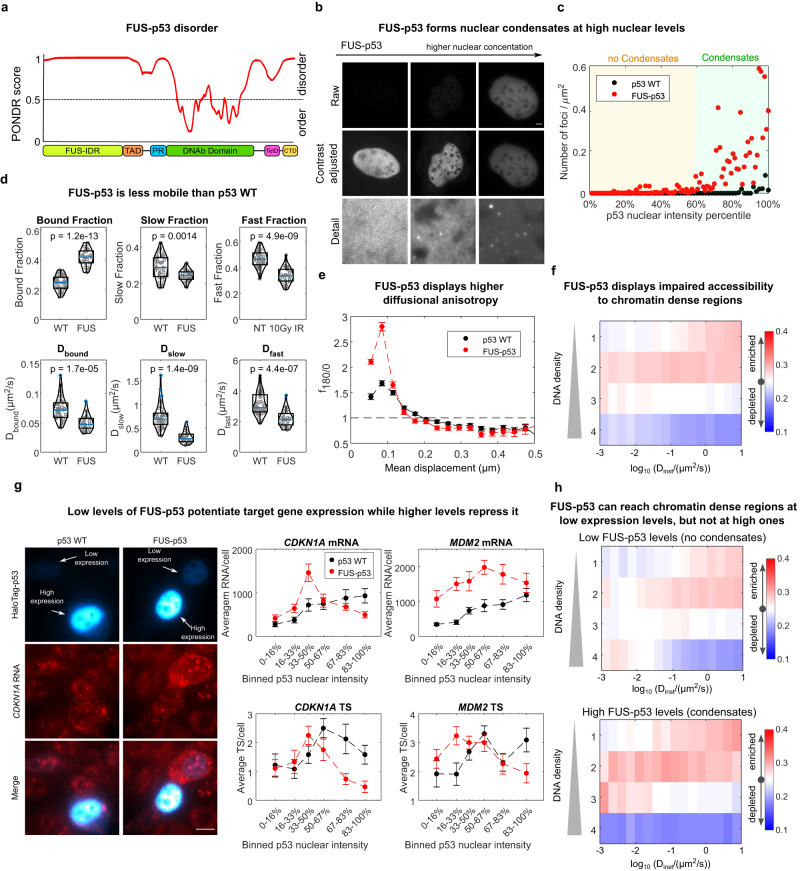
Nuclear factors rapidly scan the genome for their targets, but the role of nuclear organization in such search is uncharted. Here we analyzed how multiple factors explore chromatin, combining live-cell single-molecule tracking with multifocal structured illumination of DNA density. We find that factors displaying higher bound fractions sample DNA-dense regions more exhaustively. Focusing on the tumor-suppressor p53, we demonstrate that it searches for targets by alternating between rapid diffusion in the interchromatin compartment and compact sampling of chromatin dense regions. Efficient targeting requires balanced interactions with chromatin: fusing p53 with an exogenous intrinsically disordered region potentiates p53-mediated target gene activation at low concentrations, but leads to condensates at higher levels, derailing its search and downregulating transcription. Our findings highlight the role of disordered regions on factors search and showcase a powerful method to generate traffic maps of the eukaryotic nucleus to dissect how its organization guides nuclear factors action.


Conflict of interest statement

The authors declare no competing interest

Figures

Fig. 1
Fig. 1. SMT/mSIM microscopy probes factor-specific diffusion in chromatin.
a mSIM imaging is achieved by scanning an array of diffraction-limited spots on the sample. Shown is an example of mSIM image of a live-cell nucleus labeled with Hoechst 33342, displaying increased optical sectioning compared with Widefield (scale bar: 5 µm). b Representative frames of a live-cell acquisition combining mSIM imaging of DNA density with SMT of HaloTag-p53 (scale bar: 5 µm). c Representative localization of NF molecules on regions with different DNA density. p65 nuclear localization was analyzed upon stimulation by 10 ng/ml TNF. p53 nuclear localization was analyzed in untreated (NT) or upon 10 Gy of ionizing radiation (IR). The position of single NF molecules (green dots) is overlaid to the map of Hoechst intensity, classified in quartiles (nreplicates = 2 biologically independent experiments on at least 15 cells per nuclear factor per replicate; scale bar: 1 µm). d Different nuclear proteins are enriched in regions with different nuclear densities. Enrichment in DNA-dense regions does not significantly correlate with the NFs molecular weight (e), but it does correlate with their bound fraction, i.e., the fraction of immobile molecules (f) (nreplicates = 2 biologically independent experiments, error bar: SD, statistical test: Pearson correlation). g Localization of NFs molecules in chromatin depending on their instantaneous diffusion coefficient (ncells = 31, 32, 29, 31, 32, from two biologically independent experiments for HaloTag, p65, p53, CTCF, and Histone H2B, respectively). Source data are provided as a Source Data file.
Fig. 2
Fig. 2. Different NFs display different degrees of anisotropic diffusion.
a paSMT is carried out using highly inclined laminated optical sheet (HILO) microscopy (top left) by labelling the endogenous HaloTag-p53 with the photoactivatable dye PA-JF549 (bottom left). Movies, acquired at a framerate of 100 fps highlight quasi-immobile chromatin-bound molecules (cyan arrowhead) and diffusing (purple arrowhead) ones (max proj = maximal projection over the entire movie; cyan dotted line indicates the cell nucleus, scale bar: 5 µm). b We use vbSPT to classify track segments into bound and diffusing components, and then focus on diffusing molecules, by computing diffusional anisotropy, by calculating the distributions of angles θ between consecutive jumps, and the fold-anisotropy metric, f180/0, calculated as the probability of observing a backward displacement p(150θ210) over the probability of observing a forward displacement p(30θ30). c Different NFs display different diffusional anisotropy, with factors poorly localized in DNA-dense regions displaying lower anisotropy than factors enriched in DNA-dense regions. d Fold-anisotropy metric f180/0 as function of the distance run by the molecules. p53, CTCF, and H2B display high diffusional anisotropy at a spatial scale of ~100–150 nm, a signature of transient trapping of these molecules in traps of similar size (ncells = 30, 30, 29, 14, 31, nangles = 59470, 62813, 180414, 26052, 26566 for HaloTag, p565, p53, CTCF, and Histone H2B respectively, error bars: s.e.m. estimated through boot-strapping). e Analysis of diffusional anisotropy in our SMT/mSIM data allows us to identify that the highest diffusional anisotropy occurs for molecules with slow instantaneous diffusion coefficients in regions at high chromatin density (same data as in Fig.  1c–g). Source data are provided as a Source Data file.
Fig. 3
Fig. 3. Single-molecule diffusion of endogenously tagged p53 in DIvA cells.
a The distribution of single-molecule displacements before and after the induction of DNA damage via IR shows that p53 is described by a model accounting for three populations (red line, Eq. 2 in the Methods section), a bound one (blue line) and two diffusing ones (green and magenta lines). b The parameters extracted by fitting the distribution of displacements show that upon activation of p53 the p53 bound fraction increases, while p53 diffusion is slowed down (the blue line represents the median, box edges represent upper and lower quartiles and whiskers extend between Q1–1.5 IQR and Q3 + 1.5 IQR, where IQR is the interquartile range, ncells = 45, 44 for untreated and 10 Gy IR respectively, statistical test: two-sided Kolmogorov–Smirnov, with Bonferroni correction for multiple testing). c Diffusional anisotropy profile of endogenous p53-HaloTag is compatible with guided exploration ncells = 45, 44, nangles 1269065, 151712, for NT and IR respectively—error bars: s.e.m. estimated through boot-strapping). d The classification of track segments using vbSPT allow to compute the transition probability between the bound state and the two diffusing states. Both before and after activation by IR, p53 molecules are 10x more likely to perform the slow-to-bound transition than the fast-to-bound one. Source data are provided as a Source Data file.
Fig. 4
Fig. 4. SMT/mSIM experiments highlight that p53 molecules with different diffusivity preferentially occupy regions with different DNA density.
a Classified p53 tracks displayed over the mSIM image of DNA density (nreplicates = 2 biologically independent experiments on at least 15 cells per condition per replicate; scale bar: 5 µm). b Average Hoechst intensity (top, the cyan cross represents the position of the p53 molecule) and average radial Hoechst profile (bottom) around bound, slow-diffusing, and fast-diffusing p53 molecules. The images and the radial profiles are normalized to the average nuclear Hoechst intensity: values higher than 1 represent regions denser than average, and values lower than one represent chromatin-poor regions. Bound molecules are enriched at regions at DNA density higher than average surrounded by chromatin regions at lower density, while free molecules are enriched in chromatin-poor regions surrounded by denser ones. Slow-diffusing molecules displaying an intermediate profile. DNA damage further increases enrichment of bound molecules at DNA-dense regions (error bars: s.e.m. ncells = 29, 29 for untreated and 10 Gy IR, respectively, nmolecules = (90137,99583,70877),(174163,153493,90949) for untreated (bound, slow, fast) and 10 Gy IR (bound, slow, fast) respectively scale bar: 0.5 µm, statistical test: two-sided, one-sample t test to probe that the first point of the profile is significantly higher than 1, i.e., bound molecules sit at higher chromatin density than average). c mSIM acquisition of the chromatin surrounding the CDKN1A locus (red: CDKN1A locus, grey: Hoechst 33342, scale bar: 5 µm. nreplicates = 2 biologically independent experiments on at least 20 cells per replicate. Inset shows the localization of CDKN1A spots). d We averaged together 2 µm ROIs centered around 53 DNA FISH spots and computed the average radial profile of DNA density. On average, the CDKN1A locus appears to be positioned in regions with higher chromatin density than its surroundings (error bars: s.e.m, statistical test: two-sided one-sample t test to probe that the first point of the profile is significantly higher than 1, i.e., the CDKN1A locus sits at higher chromatin density than average). Source data are provided as a Source Data file.
Fig. 5
Fig. 5. The p53 search mechanism is governed by interactions mediated by its IDRs and DNAb domains.
a p53 disorder evaluated by PONDR (Top) and list of probed p53 mutants. b All mutants display reduced diffusional anisotropy compared to p53 WT (ncells= 45,30,28,24,31, nangles = 262907, 132280,124489, 123006, 153235 for WT, ΔN, mSB, ΔC, mSB-ΔC, respectively, error bars: s.e.m. estimated through bootstrapping). c Localization of mutant-p53 molecules by SMT/mSIM, shows that the p53 mutants lacking the C-terminal IDR display impaired recruitment to chromatin-dense regions (ncells= 42,34,20,22,9 from two biologically independent experiments for WT, ΔN, mSB, ΔC, mSB-ΔC, respectively, scatter plot: mean±SD). d p53 target gene expression as function of HaloTag-p53 levels analyzed by smFISH. Shown is maximal projection of 3D stack (left, scale bar: 5 μm) and Average mRNA counts for two p53 targets, in cells expressing either HaloTag-p53 WT or HaloTag-p53ΔC, as a function of HaloTag-p53 levels (right, ncells = 74,104,50,88, for WT-CDKN1A, ΔC-CDKN1A, WT-MDM2, ΔC-MDM2 respectively, error bars: s.e.m.). smFISH allows to estimate the number of active transcription sites (TS) per nucleus (e) and the number of nascent transcripts per TS (f) (scale bar: 5 μm, ncells = 74,104,50,88, for WT-CDKN1A, ΔC-CDKN1A, WT-MDM2, ΔC-MDM2 respectively, error bars: s.e.m.). Source data are provided as a Source Data file.
Fig. 6
Fig. 6. Fusing an exogenous IDR to p53 renders its diffusion more compact, but interferes with its targeting to DNA-dense regions.
a PONDR analysis of the FUS-p53 construct. b FUS-p53 forms intranuclear condensates above a certain nuclear level that can be estimated c approximately at the 60th percentile of our transfected cell population (ncells = 60, 96 for p53 WT and FUS-p53, experiment repeated on two independent replicates; scale bar: 5 µm). d paSMT shows that FUS-p53 displays a higher fraction of molecules in bound state and slower diffusion coefficients (the blue line represents the median, box edges represent upper and lower quartiles and whiskers extend between Q1−1.5 IQR and Q3 + 1.5 IQR, where IQR is the interquartile range, (ncells = 45, 29 for p53 WT and FUS-p53 respectively, statistical test two-sided Kolmogorov-Smirnov, with Bonferroni correction for multiple testing). e FUS-p53 also displays a more prominent diffusional anisotropy peak (ncells = 45, 29 for p53 WT and FUS-p53 respectively, error bars: s.e.m. estimated by bootstrapping). f SMT/mSIM reveals that FUS-p53 accessibility to DNA-dense regions is impaired. g Simultaneous imaging of HaloTag-p53 nuclear levels and mRNA expression by smFISH (False colors are used in the HaloTag-p53 channels to visualize both low expressing and high expressing cells, scale bar: 5 µm) highlights that p53 target genes are activated in a biphasic manner by FUS-p53. At low nuclear levels, FUS-p53 activates target genes more efficiently than p53 WT, while at higher expression levels FUS-p53 is more repressive (ncells = 65, 102, 77, 93 for WT-CDKN1A, FUS-CDKN1A, WT-MDM2, FUS-MDM2 samples respectively, error bars: s.e.m.). h Stratifying FUS-p53 mSIM/SMT data in cells without and with visible clusters highlights that FUS-p53 binds regions at higher chromatin density when expressed at low levels, with no visible clusters. (ncells = 22,13 for “no-condensate” and “with condensates” datasets respectively). Source data are provided as a Source Data file.

References

    1. Amiad-Pavlov D, et al. Live imaging of chromatin distribution reveals novel principles of nuclear architecture and chromatin compartmentalization. Sci. Adv. 2021;7:eabf6251. - PMC - PubMed
    1. Misteli, T. Beyond the sequence: cellular organization of genome function. Cell128, 787–800 (2007). - PubMed
    1. Quinodoz SA, et al. RNA promotes the formation of spatial compartments in the nucleus. Cell. 2021;184:5775–5790.e30. - PMC - PubMed
    1. Szabo Q, Bantignies F, Cavalli G. Principles of genome folding into topologically associating domains. Sci. Adv. 2019;5:eaaw1668. - PMC - PubMed
    1. Cremer T, et al. The interchromatin compartment participates in the structural and functional organization of the cell nucleus. BioEssays. 2020;42:1900132. - PubMed

Publication types

MeSH terms